


Abstract
We present a calibration method of a clinical SPECT/CT device for quantitative 99mTc SPECT. We use a commercially available reconstruction package including ordered-subset expectation maximization (OSEM) with depth-dependent 3-dimensional resolution recovery (OSEM-3D), CT-based attenuation correction, and scatter correction. We validated the method in phantom studies and applied it to images from patients injected with 99mTc-diphosponate. Methods: The following 3 steps were performed to derive absolute quantitative values from SPECT reconstructed images. In step 1, we used simulations to characterize the SPECT/CT system and derive emission recovery values for various imaging parameter settings. We simulated spheres of varying diameters and focused on the dependencies of activity estimation errors on structure size and position, pixel size, count density, and reconstruction parameters. In step 2, we cross-calibrated our clinical SPECT/CT system with the well counter using a large cylinder phantom. This step provided the mapping from image counts to kBq/mL. And in step 3, correction factors from steps 1 and 2 were applied to reconstructed images. We used a cylinder phantom with variable-sized spheres for verification of the method. For in vivo validation, SPECT/CT datasets from 16 patients undergoing 99mTc-diphosponate SPECT/CT examinations of the pelvis including the bladder were acquired. The radioactivity concentration in the patients' urine served as the gold standard. Mean quantitative accuracy and SEs were calculated. Results: In the phantom experiments, the mean accuracy in quantifying radioactivity concentration in absolute terms was within 3.6% (SE, 8.0%), with a 95% confidence interval between −19.4% and +12.2%. In the patient studies, the mean accuracy was within 1.1% (SE, 8.4%), with a 95% confidence interval between −15.4% and +17.5%. Conclusion: Current commercially available SPECT/CT technology using OSEM-3D reconstruction, scatter correction, and CT-based attenuation correction allows quantification of 99mTc radioactivity concentration in absolute terms within 3.6% in phantoms and 1.1% in patients with a focus on the bladder. This opens up the opportunity of SPECT quantitation entering the routine clinical arena. Still, the imprecision caused by unavoidable measurement errors is a dominant factor for absolute quantitation in a clinical setup.
In SPECT clinical practice, filtered backprojection is still a widely used method for image reconstruction and recommended by major nuclear medicine communities (1,2). However, if optimal corrections for image degradations induced by SPECT physical phenomena such as depth-dependent blur, photon attenuation, and scatter are needed, iterative image reconstruction is to be used (1). It was shown by Gilland et al. (3), Tsui et al. (4,5), and Rosenthal et al. (6), for example, that these corrections reduce errors for absolute quantification in SPECT. Both the availability of fast computers at low cost and advances in efficient processing allow the use of computationally expensive iterative methods in clinical routine (1). Ordered-subset expectation maximization (OSEM) (7,8) is often the iterative method of choice.
The introduction of hybrid devices, combining a SPECT camera and a CT scanner in 1 gantry, “has revolutionized the field of conventional nuclear medicine” (9). These systems facilitate the coregistration of morphologic and functional information by offering a consistent patient geometry and minimizing patient movement. Although accurate registration of the patient's torso remains a challenge because of organ motion, it was shown by Nömayr et al. (10) that the registration accuracy of a hybrid system (Symbia T2; Siemens Medical Solutions USA, Inc.) is within 0.9–1.6 mm in the lower spine region. The CT information is used to correct SPECT images for nonuniform attenuation (11–13). Both accurate registration and nonuniform attenuation correction are equally important for accurate quantification in SPECT.
Active research is conducted to improve correction techniques for quantification in SPECT (14–17) and evaluate the accuracy of quantitative image reconstruction techniques (18–25). Shcherbinin et al. (19), for instance, reported between 3% and 5% absolute errors for total activity estimation in a torso phantom for the isotopes 99mTc, 123I, 131I, and 111In using CT-based attenuation correction, detector response, and scatter and septal penetration correction. Other studies—for example, by Du et al. for 123I (17) and Vandervoort et al. (14) for 99mTc—showed 2% accuracy in regions of a brain phantom and 4% in a cardiac chamber using their versions of correction for attenuation, scatter, detector response, and partial volume. The correction techniques for scatter and septal penetration used in these studies were based on computational expensive methods such as Monte Carlo simulations or analytic photon distribution and seemed to perform well in phantoms also for high- and multienergy isotopes. Da Silva et al. (24,25) presented a quantitative method using CT-based attenuation and partial-volume correction but no scatter correction in cardiac 99mTc SPECT studies. They reported a quantitative accuracy within 4%−7% in phantoms and 10% in vivo in the porcine myocardium. In vivo quantification in humans was presented by Willowson et al. (16). They studied 99mTc-macroaggregated albumin lung perfusion in 12 patients and calculated the total lung uptake in large, minimally varying volumes, reporting an average accuracy of −1% (range, −7% to +4%).
In the studies mentioned, little or no comment was made on the nonstationary behavior of OSEM in terms of quantification and the dependency of quantification errors on imaging parameters and instrumentation.
SPECT-reconstructed spatial resolution is highly nonuniform when using maximum likelihood reconstruction without corrections for depth-dependent blur (26). Still, with those corrections built in, resolution can be fully recovered only when iterating until convergence (27,28). This would lead to overly noisy and difficult-to-interpret images when applied to clinical data. Therefore, a lower number of iterations in combination with regularization in the form of postsmoothing is usually used in clinical practice (2).
The goal of this work was to develop and evaluate an approach to quantitative SPECT by taking into account the nonstationary behavior of OSEM reconstruction when used in the clinical operation range. We assessed the dependencies of activity estimation errors on structure size, pixel size, count density, and reconstruction parameters. Using the obtained results, we developed a calibration method for the determination of activity concentrations in kBq/mL, which can be applied to our clinical SPECT/CT system. We explicitly used standard commercial iterative reconstruction software with depth-dependent 3-dimensional resolution recovery, CT-based attenuation correction, and energy window–based scatter correction. We used available technology to ensure clinical practicability including acceptable reconstruction times and a familiar operation environment.
We validated our method on phantoms and applied it to in vivo patient data.
MATERIALS AND METHODS
The following 3 steps were performed to derive absolute values for activity concentrations in kBq/mL from reconstructed images: estimation of emission recovery errors for various imaging parameter sets using simulations, cross calibration of the SPECT/CT system with the well counter, and application of correction factors derived from estimation and cross calibration to reconstructed image data.
Simulations of Imaging System
We performed quasianalytic simulations using a voxel size of 0.6 mm in image and data space. We modeled the projection operator in 3 dimensions according to the detector and collimator specifications of the Siemens Symbia T-series γ-cameras (Siemens Healthcare) using a low-energy high-resolution (LEHR) collimator, with a sensitivity of 91 counts/s/MBq and a geometric resolution of 5.9 mm in full width at half maximum (FWHM) at a 10-cm distance. The detector intrinsic resolution was set to 3.8 mm in FWHM, resulting in a system resolution of 7.4 mm in FWHM at a 10-cm distance. The point spread function for each voxel in image space was modeled by a 3-dimensional (3D) gaussian kernel with a FWHM calculated using the distance from the point of origin to the interaction plane in the detector. Projections were generated by assigning counts according to the aforementioned sensitivity and geometry conditions to a 512 × 512 detector array with a bin size of 0.6 × 0.6 mm. For each detector pixel, a Poisson realization was created using the projected pixel count value as the mean. We accounted for photon attenuation in the simulated object using a constant linear attenuation coefficient of 0.15 cm−1 and used a derived μ-map for attenuation correction. Because of the lack of an accurate scatter model, we assumed an acquisition with perfect scatter rejection of 140-keV (99mTc) photons.
We simulated hot spheres with diameters between 9.8 and 168 mm in a warm cylindric background with a diameter of 216 mm and height of 228 mm (sphere-to-background ratio, 10:1). We varied total counts between 0.125 and 32 million and reconstruction pixel size between 2.4 and 9.6 mm by rebinning the high-resolution projection data. We used OSEM for image reconstruction including 3D (transversal and axial) resolution recovery and attenuation correction (Flash3D; Siemens Healthcare) (29,30). Both the 3D point spread function and the attenuation effect were modeled in the forward projection and backprojection steps of the reconstruction. Figure 1 shows images of simulated and reconstructed spheres.
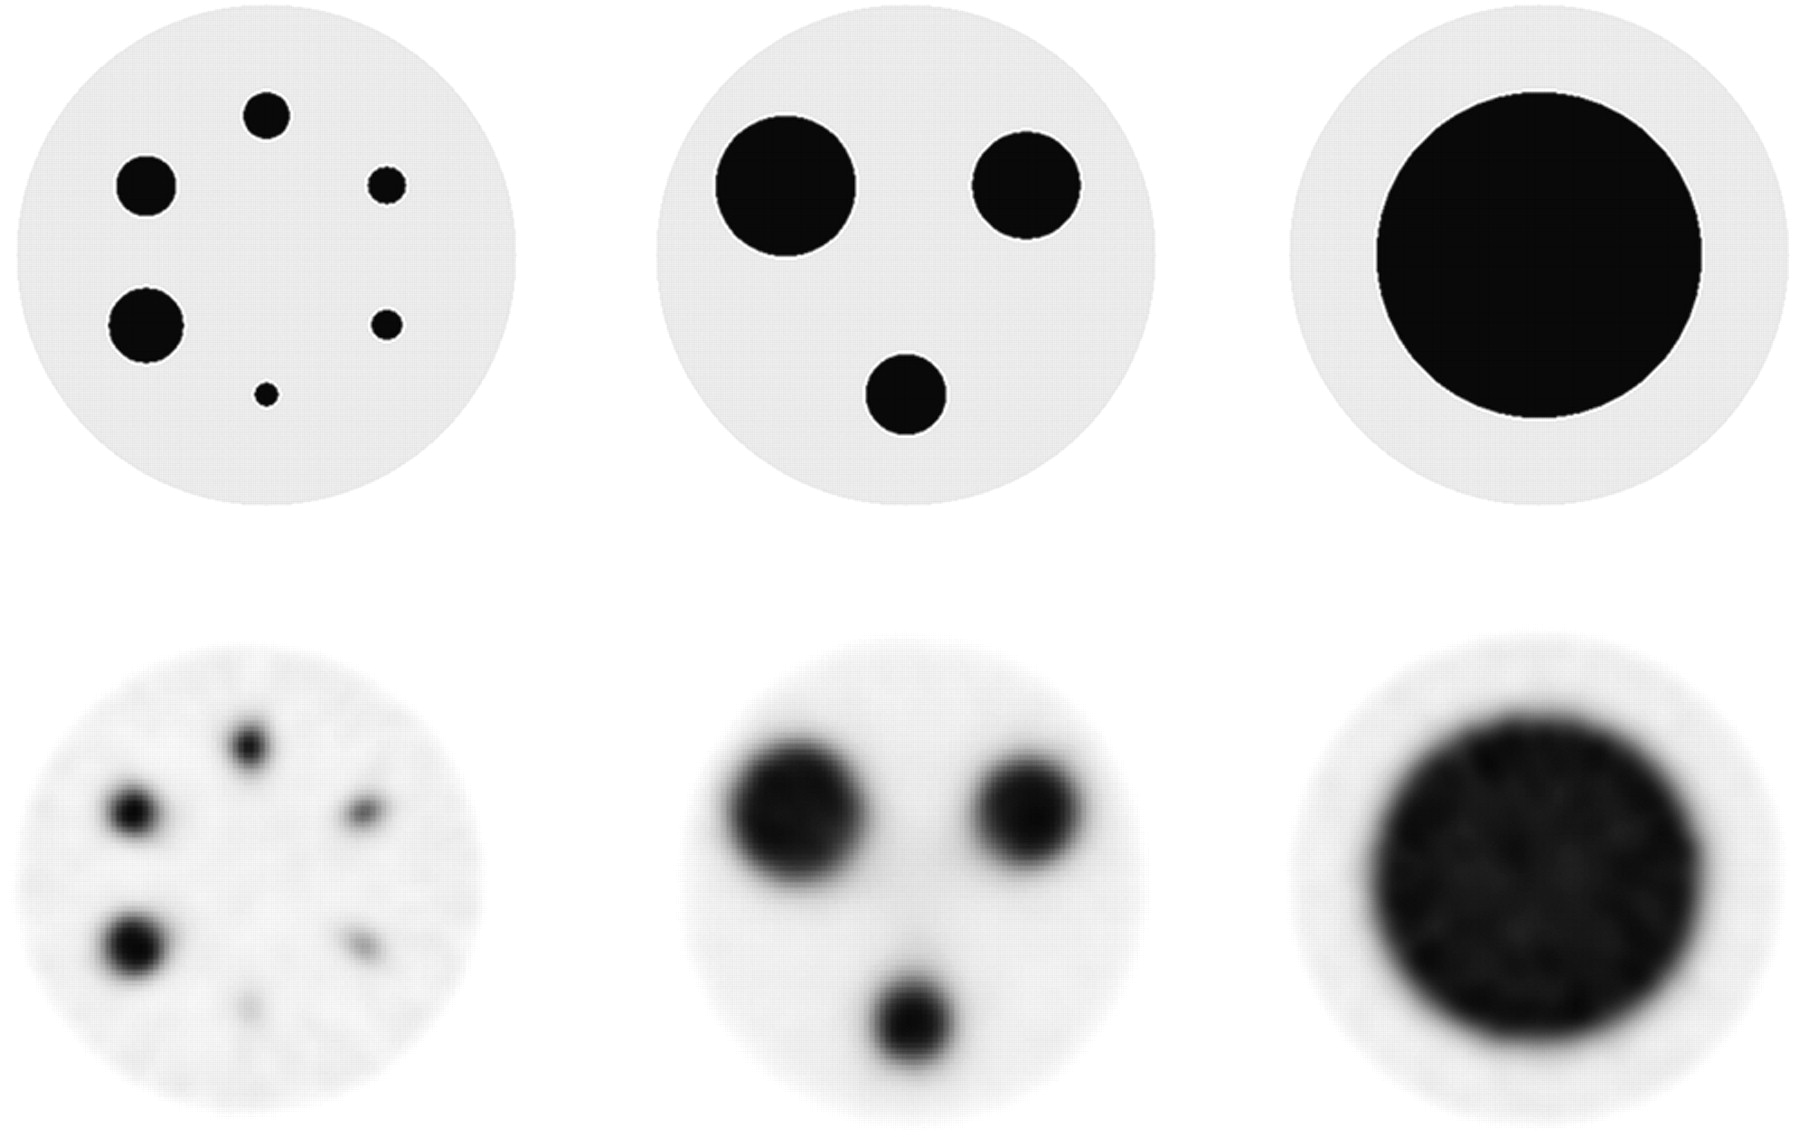
True (top) and example reconstructed images (bottom; LEHR collimation, 2.4-mm voxel, 32 OSEM updates) of simulated spheres of different diameters in 10% background.
We derived the mean count density  in the reconstructed objects and defined the emission recovery coefficient for a given object j and a given imaging parameter set i:
 Eq. 1where dTrue is the true count density. The boundaries of the target object to be measured were derived from the true high-resolution image (Fig. 1, top). We compensated for partial-volume effects, specifically spillover at the object boundaries because of finite pixel size, by measuring the loss of emission in the simulation using different pixel sizes.
Cross Calibration of Imaging System
We cross-calibrated our clinical SPECT/CT system using a large cylindric phantom (diameter, 216 mm; height, 186 mm) filled with a uniform dilution of 99mTc. The total dose of the 99mTc activity was measured in a well counter before being introduced into the phantom. The well counter was calibrated with a standard reference source (137Cs), and the measurement error for 99mTc specified by the manufacturer was 5%. Approximately 50 million total counts were collected in a 360° acquisition range, 120 projections, and a 150-mm detector radius of rotation. We used 2 separate energy windows for the acquisition of the photopeak and the lower scatter according to our standard clinical protocol for 99mTc (140 keV). The window widths were both set to 15% as recommended by the manufacturer, resulting in 108.5–129.5 keV for the lower scatter window and 129.5–150.5 keV for the photopeak window. We generated an attenuation map from a CT scan of the phantom using 130 kV, 30 mAs, and a smooth reconstruction kernel (B08s; Siemens Healthcare), with a value of the modulation transfer function at 50% of 1 line pair per centimeter. The reconstructed slice thickness was set to 5 mm. SPECT data were reconstructed using OSEM with depth-dependent 3D resolution recovery (OSEM-3D) (Flash3D; Siemens Healthcare) with CT-based attenuation correction and energy window–based scatter correction. We used a triple-energy window method (31,32) for scatter estimation, with a 15% window for both photopeak and lower scatter. The upper scatter window was set to zero (32). We estimated the scattered photons SPP in the photopeak window as follows: Eq. 2where PLS is the pixel intensity in the lower scatter window and wPP and wLS are the widths of the photopeak and lower scatter window, respectively. In our case wPP=wLS = 15%; thus, a scaling factor of 0.5 was used. The scatter estimate was then included in the statistical model of the reconstruction by adding it to the projection estimate in the forward projection step (33,34).
The μ-values used for attenuation correction were determined using a bilinear transformation from CT Hounsfield units to linear attenuation coefficients and converted from the effective CT energy to the energy of the radioisotope (35). The attenuation correction was applied in the forward projection and backprojection steps within the reconstruction. Both scatter- and attenuation-correction methods are implemented in the commercial reconstruction software package (Syngo MI Applications 2009A; Siemens Healthcare).
We calculated the system volume sensitivity by first drawing a large volume of interest (VOI) (>3,000 mL) in the reconstructed image and calculating the decay-corrected counting rate  as follows:
 Eq. 3where R is the counting rate derived from the reconstructed image (counts/dwell time), T0 is the start time of the acquisition, Tcal is the time of the activity calibration, T1/2 is the half-life of the isotope, and Tacq is the time duration of the acquisition (36). The first term in brackets corrects for the radioactive decay from the time of calibration until the start time of the acquisition. The second and third terms correct for the time duration of the acquisition and calculate the mean counts considering an exponential decay during acquisition, respectively.
The system volume sensitivity is then: Eq. 4where VVOI is the volume of the drawn VOI, and cA is the actual activity concentration in the phantom. The unit of the system volume sensitivity is counts per minute (cpm)/kBq. In addition to 1 large VOI, we drew 15 small spheric VOIs (60 mL each), evenly distributed in the cylindric volume, and calculated SVol for each small VOI as a reference.
Application of Corrections to Reconstructed Image Data
Phantom Experiments
We verified the calibration method using a standard quality-control sphere phantom (Flangeless Deluxe Jaszczak Phantom and Hollow Sphere Set (6); Data Spectrum). The measured activity concentration according to the calibrated well counter was 729 kBq/mL in the spheres and 64 kBq/mL in the background, resulting in an activity concentration ratio of 11.5:1. The activity dilution for the spheres was prepared using a calibrated pipette (Eppendorf Research; Eppendorf International), with 0.6% inaccuracy as specified by the manufacturer. The total activity in the phantom at the time of acquisition was 427.7 MBq. We acquired data with the phantom in the center of the field of view using a 150-mm detector radius of rotation over a 360° scan range and 120 projections with a dwell time of 15 s each. We used LEHR collimation with a 4.8-mm pixel size and acquired approximately 24 million total counts. For attenuation correction, a CT scan of the phantom was acquired using 130 kV, 30 mAs, and smooth (B08s; Siemens Healthcare) and medium reconstruction kernels (B40s; Siemens Healthcare), with the modulation transfer function at 50% equaling 4.5 line pairs per centimeter. The reconstructed slice thickness was set to 3 mm.
The SPECT data were reconstructed with OSEM-3D with scatter and CT-based attenuation correction, as described earlier. We manually drew spheric VOIs on a clinical processing station using Syngo MI Applications 2009A (Siemens Healthcare) by following the CT boundaries of the fused SPECT/CT image (Fig. 2). We shifted the VOIs by 2.4 mm (0.5 times voxel size) in negative and positive x, y, and z directions and calculated the average of the total counts in the VOIs. This procedure was done to minimize biases introduced by the initial positioning of the VOI by hand and by residual misregistration of SPECT and CT images. We calculated the absolute activity concentration for a given object size j using the following formula: Eq. 5where
  is the average counting rate in the drawn VOIs and i′ the specific imaging parameter set used.
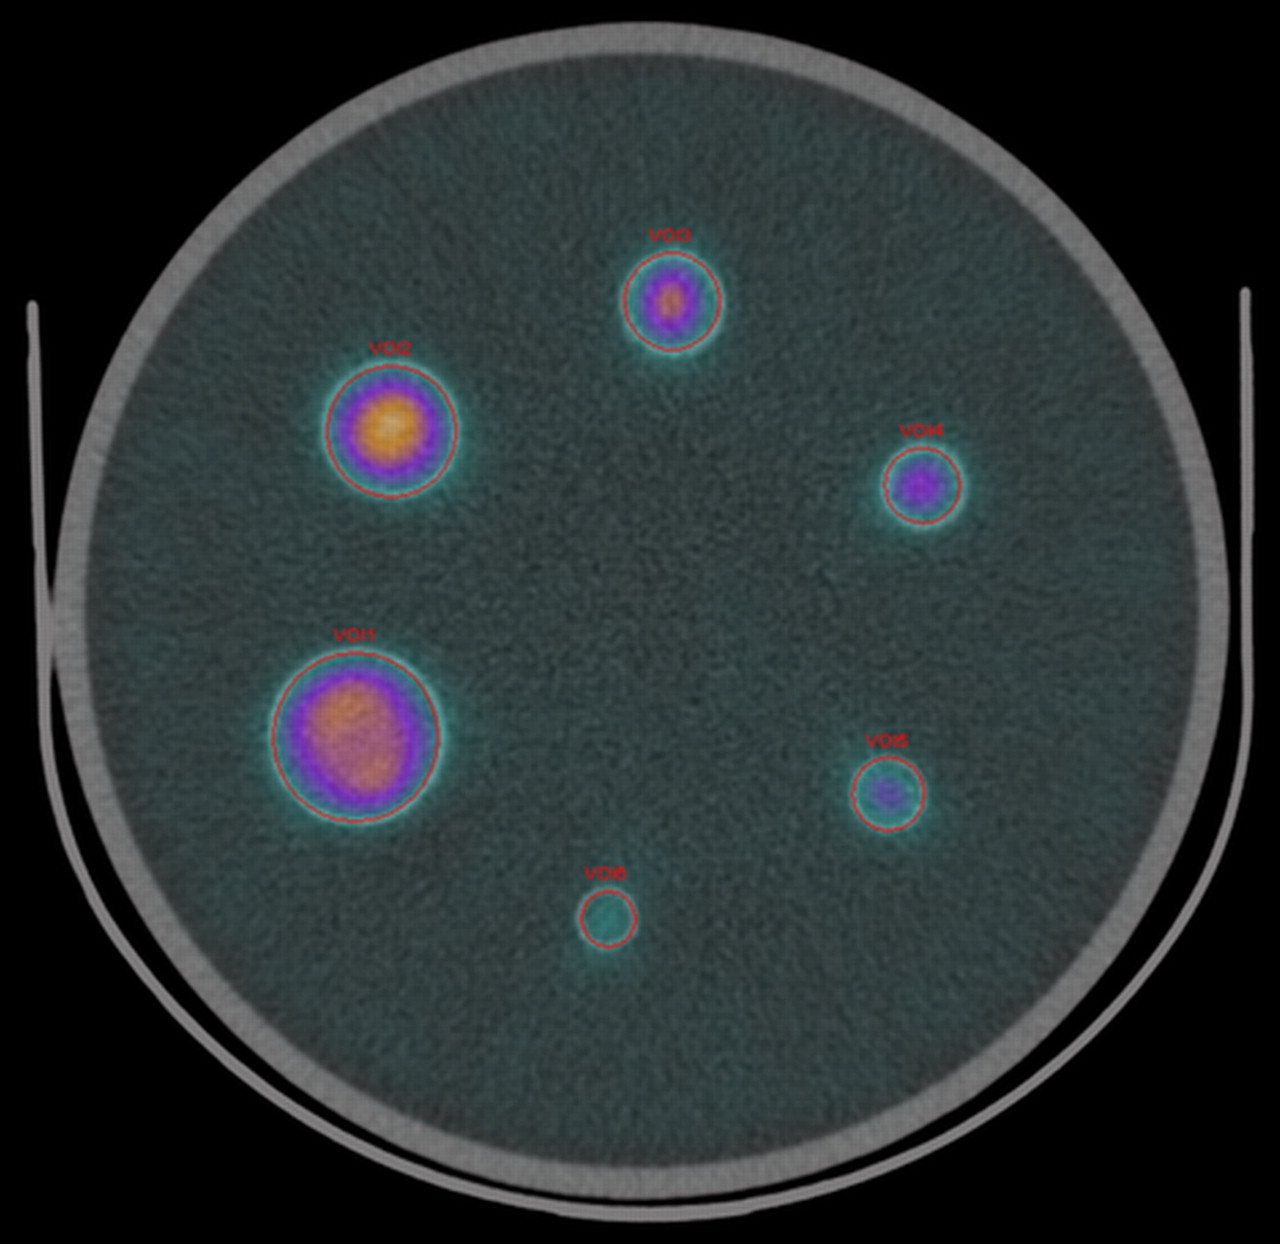
Reconstructed image of sphere phantom fused with CT image (LEHR collimation, 2.4-mm voxel, 32 OSEM updates). Circular VOIs were drawn manually using CT boundaries as reference.
In Vivo Patient Experiments
Permission to perform studies in patients was granted by the Ethical Committee of the University of Erlangen-Nuremberg. We acquired image datasets from 16 patients undergoing 99mTc-diphosponate bone examinations of the pelvis for clinical reasons according to our standard SPECT/CT protocol. The injected dose was between 7 and 10 MBq of 99mTc-diphosponate per kilogram of body weight. SPECT/CT was performed 3–4 h after intravenous injection. We used LEHR collimation, a 128 × 128 matrix, a 4.8-mm pixel size, and a total of 120 projections, each with a dwell time of 15 s, over 360°. The total number of counts was between 2.9 and 8.5 million for the 16 patients examined. A low-dose CT scan with 130 kV and 30 mAs using adaptive dose modulation (CARE Dose 4D; Siemens Healthcare) was acquired subsequent to the SPECT acquisition. The CT reconstruction used smooth and medium kernels (B08s and B40s, respectively; Siemens Healthcare) with 5- and 1-mm, respectively, reconstruction increments.
After we created the CT-derived attenuation map, we reconstructed the SPECT data of the 16 patients using OSEM-3D with scatter and CT-based attenuation correction using 4 subsets and 8 iterations. No postsmoothing was applied to the reconstructed images.
We collected the patients' urine after the examination and measured it in the well counter. For this step, 3 test tubes were filled independently with a pipette (1 mL each), and the average decay-corrected activity concentration values served as the gold standard.
We drew VOIs in the reconstructed image by manually adjusting the threshold of an isocontour such that the VOI boundaries coincided with the bladder boundaries of the fused CT image. The values for the threshold resulted in between 20% and 25% of the maximum voxel value of the respective VOI. Similar values were reported by Shcherbinin et al. (19) to most accurately represent the true volume of a given object. The VOI volumes varied between 40.7 and 482.0 mL. Figure 3 shows fused images of 2 representative patients and the respective VOIs.
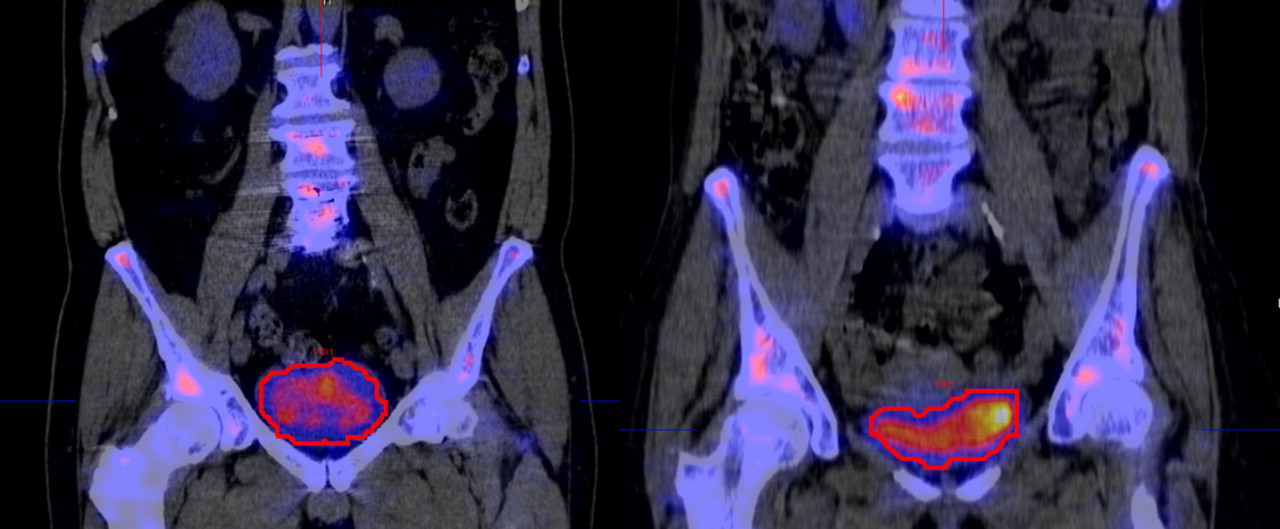
Reconstructed images of 2 patients fused with CT images (LEHR collimation, 4.8-mm voxel, 32 OSEM updates). VOIs were drawn by setting threshold of isocontour to coincide as close as possible with CT boundaries.
We calculated absolute activity concentrations according to Equation 5 using the emission recovery coefficient CE at the particular operation point (volume and imaging parameters).
Because one cannot assume a constant activity concentration in the bladder during the acquisition and until the time of urine collection, we estimated the concentration change rate by measuring the mean count density in the bladder in the first and last 2-dimensional frame of the projection dataset. The difference in the angular position of the 2 frames was 3°. We drew isocontours with a 50% threshold in both frames and calculated the decay-corrected count density in the regions of interest. Using the difference in the count density of the 2 frames, we extrapolated a linear curve beyond the endpoint of the acquisition until the time of urine collection.
RESULTS
Simulation Results
In Figure 4A the loss of emission recovery due to spillover at the object boundaries is shown for the different object and voxel sizes used. The values are derived from simulations when a target-to-background ratio of 10:1 is assumed. Figure 4B illustrates the effect when various sphere-to-background ratios are used. In this case, we exemplarily used a 16-mL sphere (diameter, 31.3 mm). In subsequent simulations these results were used in a postprocessing step after reconstruction to compensate for the spillover effect by adding the respective values to the emission recovery coefficients measured in the simulations.
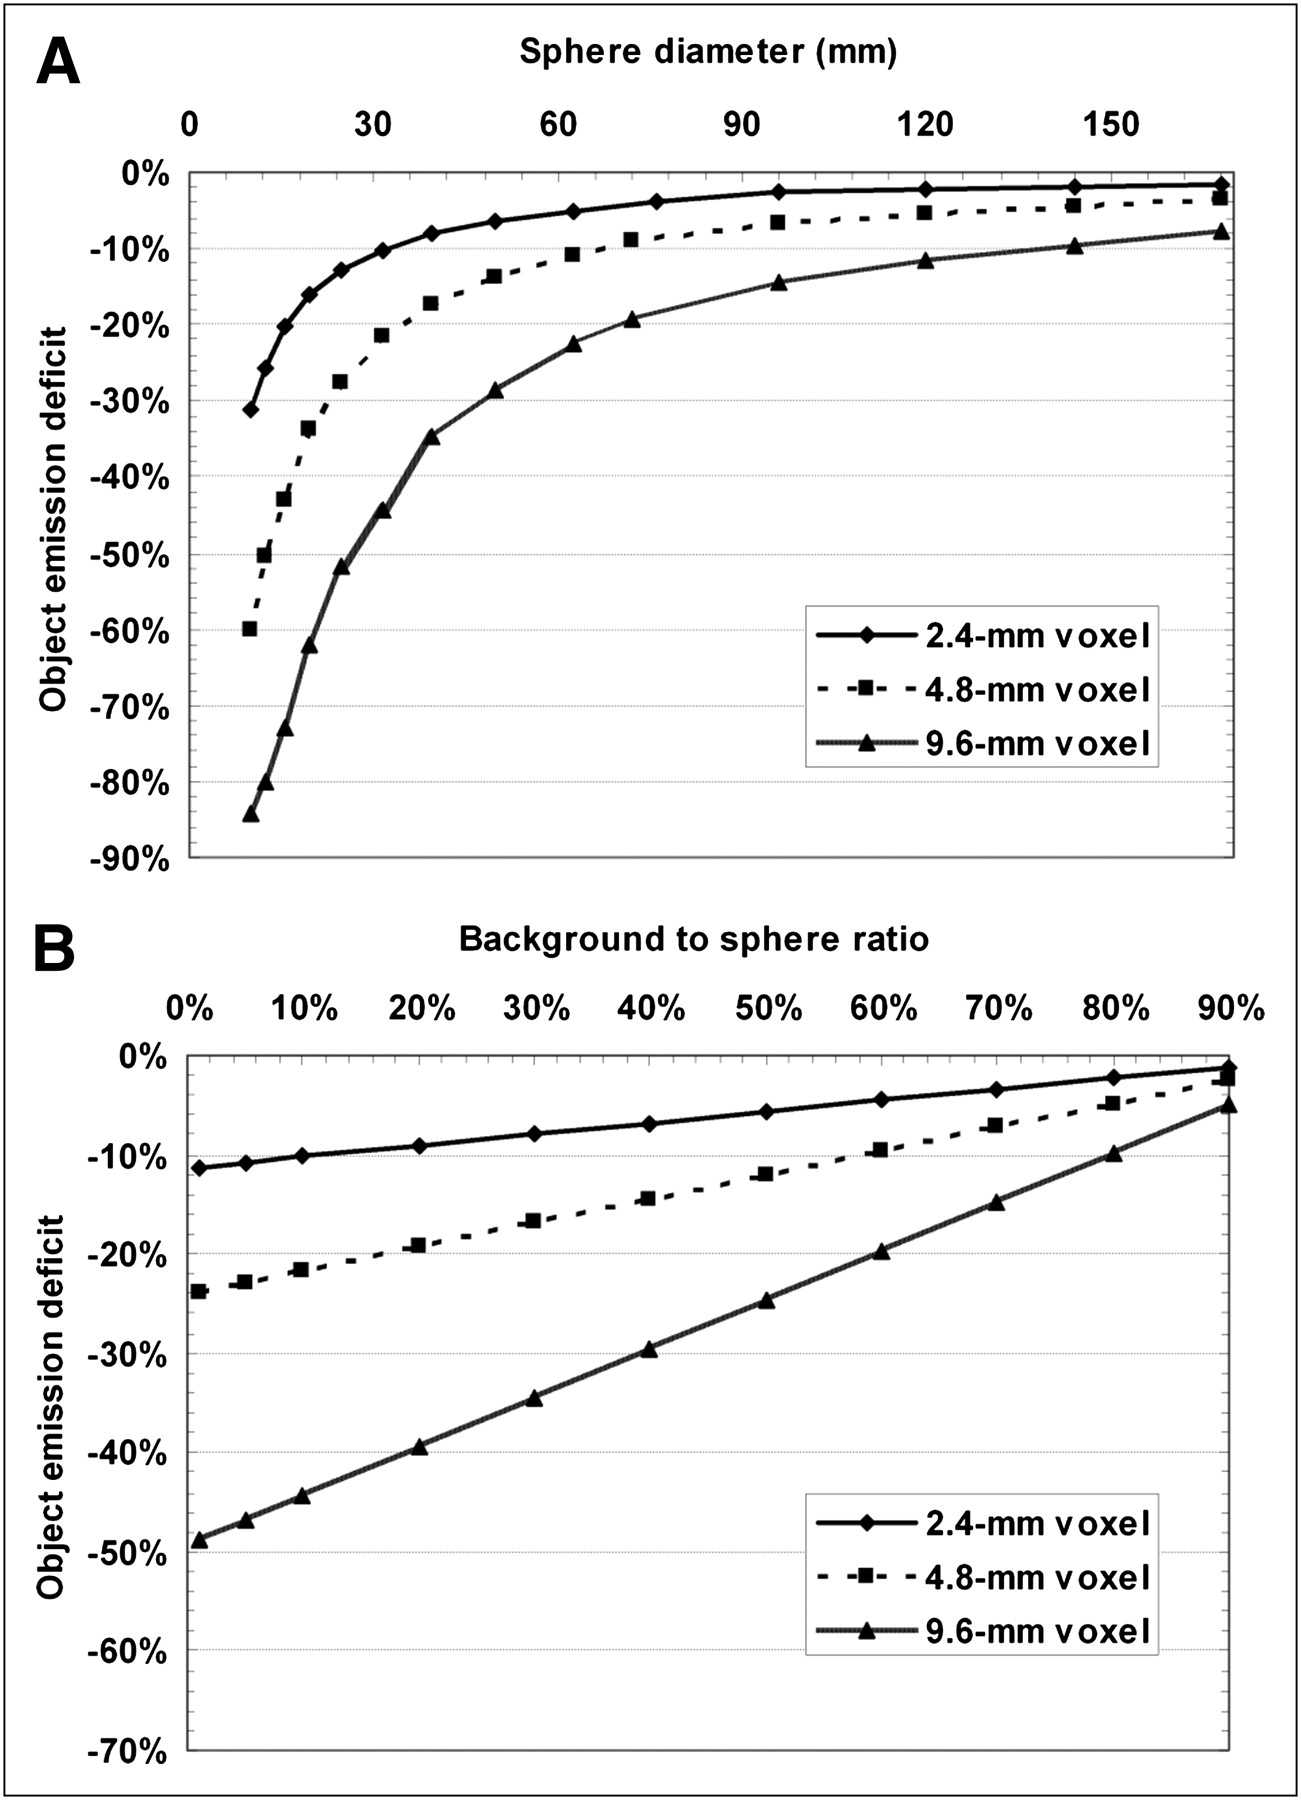
Effect of spillover at object boundaries on emission recovery due to finite voxel size for different object and voxel sizes with target-to-background ratio of 10:1 (A) and different target-to-background ratios using 16-mL sphere (B).
Figures 5A and 5B show the emission recovery coefficients for different object sizes, number of OSEM updates, and voxel sizes used. Results are shown for LEHR collimation and 2 million total counts. Each data point is the average value of 5 independently performed simulations. In general, the emission recovery coefficient is highly dependent on the number of OSEM updates, especially for object sizes below 3 times the system resolution. In addition, the convergence rate in terms of emission recovery is slower for a smaller voxel size. The curves are steeper for 4.8-mm voxels than for 2.4-mm voxels, especially for low iteration numbers.
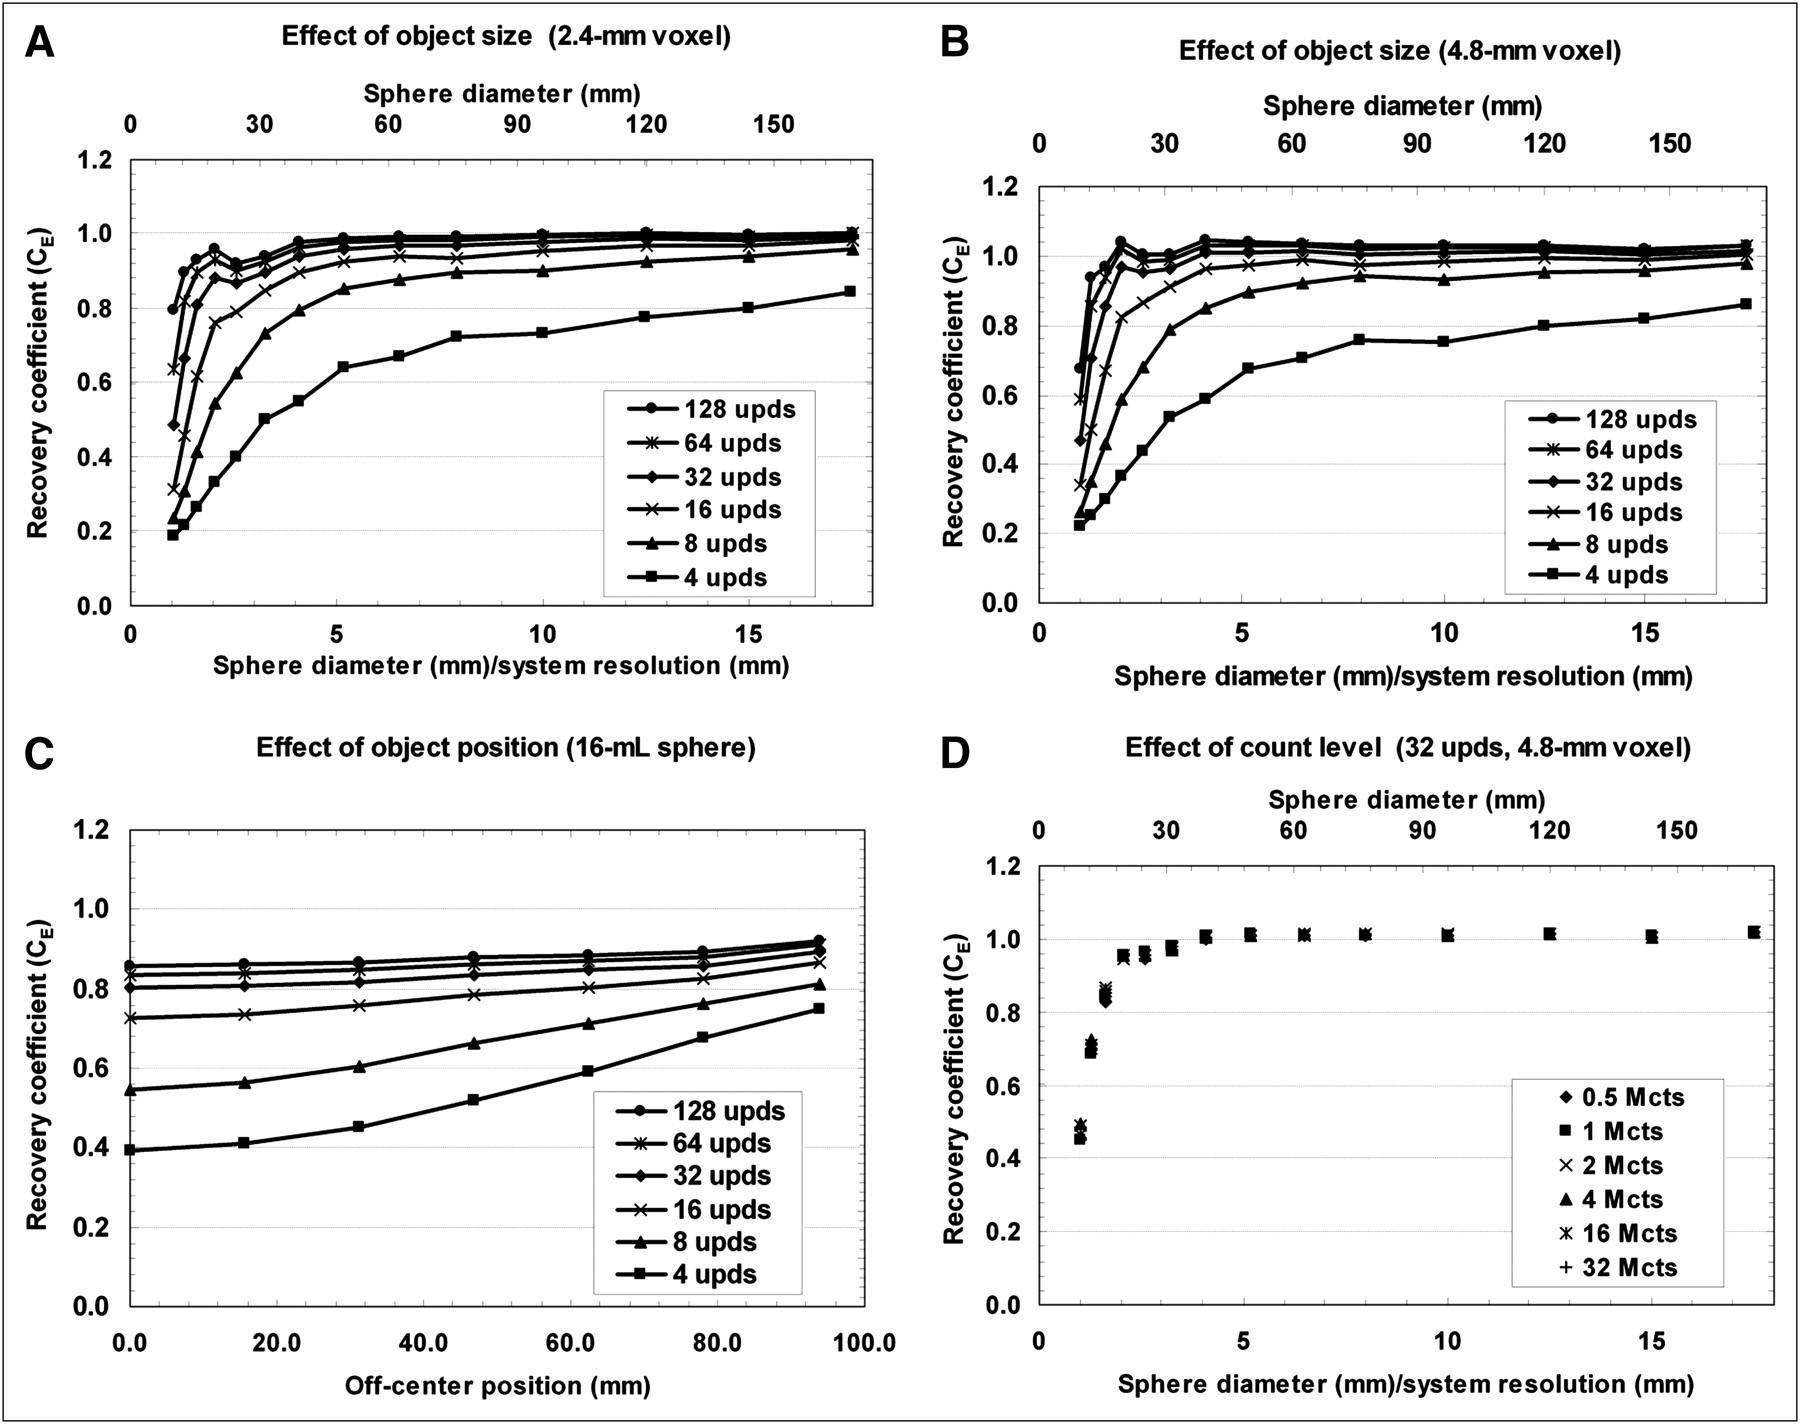
Emission recovery coefficients as function of object size and number of OSEM updates for different voxel sizes using LEHR collimation and 2 million total counts (A and B), for different object positions of 16-mL sphere (C), and for different total counts (D). upds = the number of OSEM updates; Mcts = million counts.
Figure 5C describes the effect of the object position in the cylinder with 10% background on the emission recovery of a 16-mL sphere (object diameter, 31.3 mm). The recovery coefficients, for example, for 32 updates, vary between 0.80 ± 0.01 for the center position and 0.89 ± 0.01 for 92-mm off-center.
The dependency of total counts on the emission recovery is shown in Figure 5D. Here we used 32 OSEM updates and a voxel size of 4.8 mm as in the patient studies. Beyond 3 times the system resolution, the SD of the recovery coefficient is below 0.0052 for all count levels tested. Below this point, SDs are between 0.0065 for 16-mL spheres and 0.0462 for 0.5-mL spheres. This result indicates that our recovery coefficients are independent of the count level.
Quantitative Results from Phantom Experiment
The calculated system volume sensitivity (SVol) using a large VOI was 10.29 cpm/mL. The mean SVol value using 15 small VOIs at different positions was 10.28 ± 0.24 cpm/mL.
We calculated the absolute activity concentrations for all 6 spheres by applying Equation 5 using recovery coefficients between 0.291 and 0.801 for the smallest and the largest sphere, respectively. Beginning with measurement errors of 5% for the well counter and 0.6% for the pipette, we propagated the errors and obtained measurement error estimates for each of the variables in Equation 5 and ultimately for ĉA.
The results are summarized in Table 1, showing the true and calculated activity concentrations, applied volume sensitivity and recovery coefficients, and VOIs. Propagated relative SEs are given in parentheses. The average difference between true and calculated activity concentration is −3.6%, with an average SE of 8.0% and a 95% confidence interval between −19.4% and +12.2%
Quantification Accuracy and Accumulated Errors for Sphere Phantom
Quantitative Results from Patient Data
The mean activity-concentration change rate of the urine during the acquisition was 0.5% per minute. The average time from the end of the acquisition until the urine collection was 8.8 min, resulting in a correction factor for the reconstructed counts of 4.3%. Table 2 summarizes the results from the patient experiments. The mean deviation of the calculated activity concentrations from the gold standard values is +1.1%, with an average SE of 8.4%. The lower and upper boundaries of a 95% confidence interval are −15.4% and +17.5%. The target volumes and activity concentrations were between 40.7 and 482.0 mL and 13.6 and 284.1 kBq/mL, respectively. Mean quantification accuracy within 10% could be achieved in 13 of 16 patients.
Quantitative Accuracy and Accumulated SEs for Patient Data
DISCUSSION
Our results show an average quantitative accuracy within 3.6% in phantoms with different-sized spheres when using 99mTc. These results reproduce the accuracy reported by Vandervoort et al. (14), Willowson et al. (16), and Shcherbinin et al. (19). In addition, we show that this accuracy can be achieved independent of target volume when the appropriate correction factors are used. It turns out that these correction factors depend not only on object size but also on position and, more important, on the number of OSEM updates. Little comment was made on this nonstationary behavior in previous work, although this represents a major challenge for quantification using OSEM.
We estimated the precision of our experiments by taking errors into account that are unavoidable and caused by processes such as activity and volume measurement, drawing of VOIs, and also image statistics. Considering the various sources of error, we obtain an average accumulated error of 8.0% in our phantom experiment, resulting in a 95% confidence interval between −19.4% and +12.2%. This confidence interval outlines realistic uncertainty boundaries when operating in a clinical setup.
In vivo results show an average accuracy within 1.1%, with an average precision of 8.4%, similar to that of the phantom experiment. The accuracy in patient studies ranges from −7.8% to +16.9%, resulting in an SD of 8.5%, compared with 3.6% in the phantom experiment. The larger variation in the patient study relates to procedures and assumptions inherent to our calibration method. We assumed a linear extrapolation with a slope derived from projection data to account for metabolic function. This linear extrapolation of activity concentration change rates is an assumption and might not represent the truth in all the cases.
The VOIs in the SPECT images were determined by drawing an isocontour that best represented the object boundaries in the fused CT image. This is not a trivial task, especially if other high uptake regions are close to the target. Besides, one cannot assume that CT images are always available, so other techniques—such as the one proposed by Shcherbinin et al. (19) using different thresholds for volume and activity estimation—might be considered.
The method used to simulate the imaging system takes only the primary photons of 140 keV into account, neglecting septal penetration and assuming perfect scatter rejection. Object and collimator scatter is present in the acquired data and corrected using triple-energy window–based scatter estimates included in the iterative reconstruction. The triple-energy window method for scatter correction is easy to implement and proved to give accurate scatter estimates in phantoms (32,37). Narita et al. (37) showed that this method introduces an overall bias of 4% for absolute quantification. We should point out that we indirectly accounted for biases caused by the scatter-correction technique, because scatter correction is applied both in the cross-calibration step and in the actual measurements. Still, the imaging setup was slightly different and the scatter response is different in patients than in phantoms.
In the correction factors derived from simulations, only the effects of spillover at object boundaries are considered. Partial-volume effects caused by the detector response are not corrected. This might improve results especially for objects smaller than 3 times the system resolution (20).
Despite various inconsistencies, the developed calibration procedure shows encouraging results for the accuracy of absolute quantitation in SPECT when using 99mTc in combination with commercial reconstruction software in phantoms and also in patients. Our results for the propagated measurement errors show that the real challenge for quantitative SPECT in a clinical setup is to improve the precision—that is, to reduce the error bars. The lower bound of the precision is given by the measurement tools available at the clinical site and may rarely be below 5%.
Accurate quantitation of other clinically important isotopes, for example, for image-based dosimetry in radiotherapy, such as 111In or 131I, may need additional correction factors in the reconstruction and calibration methods (23,38). Our method uses recovery coefficients derived from hot spheric objects, which do not move. To use the method for other specific applications—such as cardiac imaging—recovery coefficients specific for the shapes and positions of the target organ and more sophisticated partial-volume corrections (24) ought to be used. For moving objects—for example, the heart or lung tumors—motion-correction methods need to be used to obtain the accuracy presented in this work.
CONCLUSION
Absolute quantitation of 99mTc SPECT using the calibration procedure presented here in combination with standard commercial reconstruction software is possible, with an average accuracy of 3.6% in phantoms with small spheres and 1.1% in patients with a focus on the bladder. Still, the overall uncertainties due to measurement errors are a dominant factor for absolute quantitation in a clinical setup. Hence, the long-term goal is to minimize the error bars and increase the confidence in the obtained accuracy. New acquisition and processing techniques can help in the future to increase the image information relevant for quantitation and improve the precision.
Acknowledgments
We thank Ron Malmin, Manjit Ray, and Rainer Linke for valuable discussions; the Systems Test team at Hoffman Estates, in particular Rick Panesi and Michael Rose, for their help during system quality control and acquisition of the data; and the technologists at the Clinic for Nuclear Medicine in Erlangen, Wolfgang Sprengart and Valentina Totev, for their help during patient examinations.
Footnotes
-
COPYRIGHT © 2010 by the Society of Nuclear Medicine, Inc.
References
- Received for publication November 3, 2009.
- Accepted for publication March 1, 2010.


