


Abstract
The aim of this study was to evaluate the assessment of the left ventricular ejection fraction (LVEF) in patients by gated IQ-SPECT. Methods: Twenty-eight patients were examined using gated 99mTc-sestamibi IQ-SPECT. Two different reconstruction datasets were created using the same projection data. The number of iterations, subsets, and gaussian filtering were based on 2 different recommendations from the manufacturer. For each dataset, end diastolic volume, end systolic volume, and LVEF were calculated using 4DMSPECT. A multigated planar equilibrium radionuclide ventriculography (MUGA) study with 99mTc-labeled red blood cells was used as a reference for the LVEF. Results: The values of the different datasets were tested using the Bland–Altman analysis method. The calculated mean and 95% limits of agreement for the LVEF when dataset 1 and 2 were compared were −1.1% and ±15% points; when dataset 1 was compared with MUGA, the mean was calculated to −3.1% points and ±17% points for the 95% limits of agreement. When dataset 2 and MUGA were compared, the mean was −4.2% and 95% limits of agreement of ±18% points. Conclusion: Neither of the gated reconstructed datasets analyzed with 4DMSPECT was comparable to LVEF estimated by MUGA, with a tendency to overestimate LVEF. However, large random variations of the end diastolic volume, end systolic volume, and LVEF between the 2 gated reconstructed datasets were found. The reconstructed datasets were not interchangeable. Thus, these values should only be used with great caution when evaluating the functional state of the heart.
As a diagnostic technique in coronary artery disease, electrocardiography (ECG)-gated SPECT (gSPECT) data acquisition is an established method. Reconstruction and analysis of the data provide information of left ventricular perfusion, wall motion, wall thickness, and quantification of parameters as left ventricular end diastolic and systolic volumes (EDV and ESV, respectively) and ejection fraction (LVEF). The study is normally performed using dual- or triple-head γ-camera systems with low-energy all-purpose or low-energy high-resolution (LEHR) collimators installed and with a 90° or L detector configuration (1). To generate adequate imaging statistics, the overall acquisition time can be 20–30 min. Developments in hardware and software continue improving gSPECT image quality (2,3). In December 2008, Siemens Healthcare announced the Food and Drug Administration clearance of their newly developed hardware and software package called IQ-SPECT, with the purpose of shortening the acquisition time considerably. The Siemens IQ-SPECT system consists of SMARTZOOM collimators (magnifying collimators with a complex design), gantry movement control, and special reconstruction software. SMARTZOOM collimators center on the heart, collecting up to 4 times more counts than LEHR collimators. These collimators magnify the heart while still capturing counts from the entire field of view (4,5). IQ-SPECT's cardiocentric orbit is centered on the heart instead of the gantry’s mechanical center, ensuring that the heart is always in the SMARTZOOM collimators’ magnification area. Thus, the system is able to reduce acquisition time from approximately 20 min to approximately 5 min with the same patient dose (6,7).
In our department, the IQ-SPECT system has been used routinely for clinical gated and nongated myocardial perfusion imaging (MPI) studies since the installation in 2011. The use of the new system has led to suspicion that the reliability of the LVEF using IQ-SPECT may be questioned. The aim of this study was to evaluate the LVEF using IQ-SPECT with 2 different reconstruction settings (Siemensoriginal and Siemensnew) and to explore how these values relate to the LVEF using multigated planar equilibrium radionuclide angiography (MUGA). MUGA is a well-established method first reported in 1971 by Strauss et al. (8), and it was earlier shown to be a simple, reproducible, and highly accurate method for determination of LVEF (9,10).
MATERIALS AND METHODS
Patients
Twenty-eight patients (12 men, 16 women; mean age, 65 y; age range, 43–82 y) scheduled for routine MPI using 99mTc-sestamibi IQ-gSPECT/CT were prospectively included. Exclusion criteria included pregnancy, arrhythmia, and patient inability to give written commitment. Seventeen patients were referred with suspected coronary artery disease and 11 with known coronary artery disease. In 12 patients, the stress test was performed as a physiologic treadmill test, and 16 patients had a pharmacologic stress test with dipyridamol. None of the patients required longer acquisition time or higher dose, and Siemens quality control check was met (11). A 2-d SPECT/CT protocol was applied. gSPECT was performed only for the stress MPI. The stress test was performed according to the international guidelines (1). If the stress MPI was normal, the rest MPI was not performed. A MUGA study was performed in addition to the MPI 3.4 ± 0.5 d (range, 3–6 d) later as a method of reference for the LVEF. All patients were informed orally and in writing. Written consent was given by all the patients. The study was approved by The Regional Committee on Health Research Ethics.
Method A: Gated Stress 99mTc-Sestamibi SPECT/CT Study
Acquisition
Gated stress MPI was performed using a Symbia T16 SPECT/CT scanner (Siemens AG) equipped with SMARTZOOM collimators. Images were acquired approximately 115 ± 20 min (range, 73–234 min) after injection of an average 650 ± 50 MBq (range, 600–705 MBq) of 99mTc-sestamibi. Gated IQ-SPECT images were acquired over 208° cardiac-centric orbits with 17 views per detector of 14 s. The radius of the orbit was 280 mm. The total acquisition time for the study was only 6 min (including CT). Images were acquired with low-dose CT for attenuation correction for the nongated images. Attenuation correction for gated images was not supported by the manufacturer. Additional acquisition settings are given in Table 1.
Settings for Acquisition and Data Processing for the 3 Methods
Reconstruction
After data acquisition was completed, the study was transferred to a Siemens Syngo Processing workstation for reconstruction. The projection data were reviewed for motion, and motion correction was applied, if necessary. The manufacturer’s original recommendation for the reconstruction was used: Siemens Flash3D iteration reconstruction algorithm, 15 iterations, 2 subsets, and 10-mm gaussian filtering (Siemensoriginal). Processing steps included determination of myocardial axes and boundaries and masking of the myocardium.
The Siemens Flash3D technology is based on the maximum-likelihood reconstruction using ordered subset. It uses a 3-dimensional beam model for collimation in the iterative process, providing increased accuracy over earlier models (2-dimensional ordered-subset expectation maximization). Correctly modeling the collimation beam enables the distribution of the activity over the slices to be more accurately reconstructed. The Flash3D has furthermore been modified to include SMARTZOOM collimator and gantry movement. The gaussian filtering is applied to the reconstructed images to reach the desired trade-off of resolution versus image noise.
Data Analysis
The reconstructed gated dataset was loaded into the third program 4DMSPECT (version 2010.1.0.56; University of Michigan Center). This program measures the EDV, ESV, and LVEF and is described elsewhere (12). Automatic processing was initially used for all software. Tracing of the ventricular walls was visually evaluated by an experienced operator, and if necessary the ventricular border surrounding the ventricle was modified and reprocessed.
Two experienced nuclear medicine physicians processed each dataset independently, beginning with the projection images and continuing through reconstruction and gated SPECT analysis. The average of the values was calculated and used for further analysis. The interobserver variability was 1%–3% points for all LVEFs (data not presented here).
Method B: Gated Stress 99mTc-Sestamibi SPECT/CT Study
The same projection data acquired in method A were used to create a new reconstruction for all patients. The manufacturer’s new recommendation for the reconstruction was used: Siemens Flash3D iteration reconstruction algorithm, 12 iterations, 1 subset, and 10-mm gaussian filtering (Siemensnew). Data analysis is as described in method A.
Method C: Multigated Blood-Pool Imaging
International guidelines for determination of the LVEF using planar equilibrium radionuclide angiography was followed (13).
Acquisition
The patients’ red blood cells were labeled in vitro with 740 ± 45 MBq (range, 680–810 MBq) of 99mTc and reinjected in the patient. After the injection of the labeled red blood cells, the MUGA was performed in the left anterior oblique projection (30°−45°). The data were acquired using a 64 × 64 matrix with a Symbia S γ camera (Siemens AG) with LEHR collimators. Sixteen frames per R-R interval were used, and the R-R interval tolerance window was set to 20%.
Data Analysis
LVEF was measured by the standard program supplied by the manufacturer (eSoft MI Apps VE50A; Siemens Medical Solutions). Ventricular and background regions of interest were created semiautomatically by the operator, with support of the cine loop and phase image for an accurate definition of valvular planes. Butterworth 0.55, volume curve smoothing, and curve fitting were used.
Statistics
Mean values and SDs were calculated for LVEF for each method and for EDV and ESV for methods A and B. Scatterplots were drawn, and linear regression analysis was performed by least-squares fitting. The coefficient of determination, R2, and the Pearson correlation coefficient, r, were calculated ( ).
).
The similarity of the methods was tested according to the method of Bland–Altman (14–19).
The mean of the differences, the 95% limits of agreement, and the confidence intervals (CIs) for the mean and the 95% limits of agreement were calculated.
The distribution of the differences was compared with a normal distribution using the Kolmogorov–Smirnov test. The differences among the LVEF results were shown in absolute LVEF units, called percentage points (% points) not by percentage of LVEF. The statistical analysis was done using Excel 2003 (Microsoft).
To help us in the interpretation of the method comparison, we predefined a medically accepted limit. LVEF is an important parameter for prediction of poor long-term prognosis, and the accuracy and reproducibility of the estimated LVEF are of great importance (20–22). The current guidelines for treating patients with cardiotoxic chemotherapy states that chemotherapy should be considered discontinued if the patient presents again with a drop in LVEF of 10% points or more (23).
Therefore, if the new method for measuring the LVEF is unlikely to give readings for a subject who differs more than 10% points from those obtained using the old method, we would rely on the measurements made by the new method, as differences smaller than this would not be affected in the clinical interpretation of the result. On the other hand, differences of 10% points or more would not be satisfactory because an error of this magnitude could lead to a change in patient management. For the Bland–Altman plot, this means that ±1.96 SDs is ≤10%, or actually that the upper/lower CI for the 95% limit of agreement is ≤10%.
RESULTS
For the 28 patients included in the study, the mean of the LVEF was, respectively, 68% ± 26%, 69% ± 22%, and 64% ± 24% for method A, method B, and method C. The range of the LVEF was approximately 20%–83% (Table 2). Most of our patients had normal LVEF, as only 1 was below 50%.
Average Value, SD, and Range for LVEF, EDV, and ESV for All Patients and for Each of the Methods Applied
Comparison of Volumes
The results of the statistical analysis of EDV and ESV are summarized in Tables 2–4 and Figures 1 and 2.
Results of Kolmogorov–Smirnov Test for Each Method
Results of Statistical Analysis for EDV and ESV for Comparison Between Method A and B
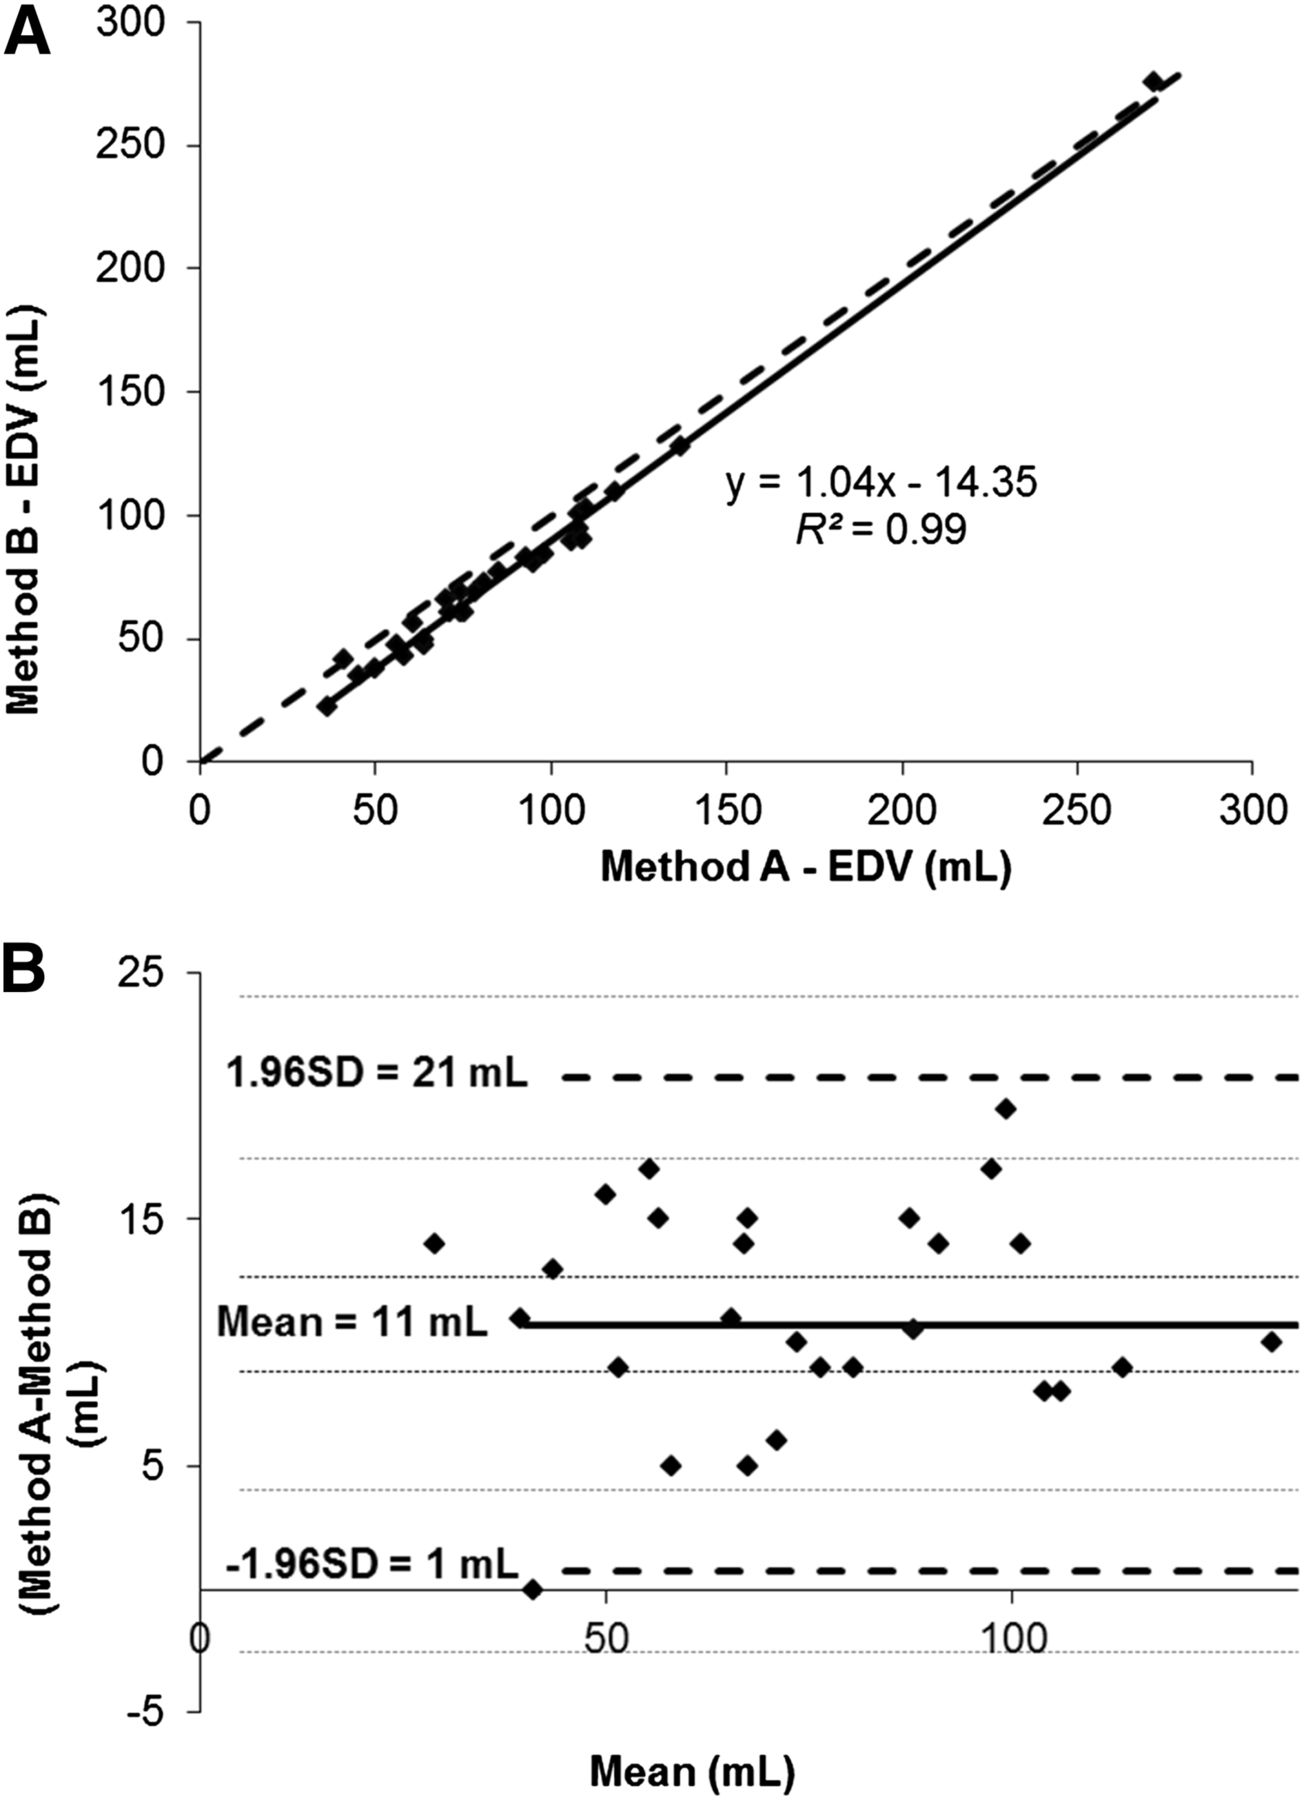
Method A vs. B for EDV. (A) Scatterplot. Linear regression was calculated and is shown as full curve, and line of equality is illustrated by dotted curve. (B) Bland–Altman plot. One point in Bland–Altman plot is omitted due to scaling of x-axis. Bold curve = mean of differences; dotted curve = ±1.96 SDs; small dotted curves = CIs of mean and CIs of limit of agreement.

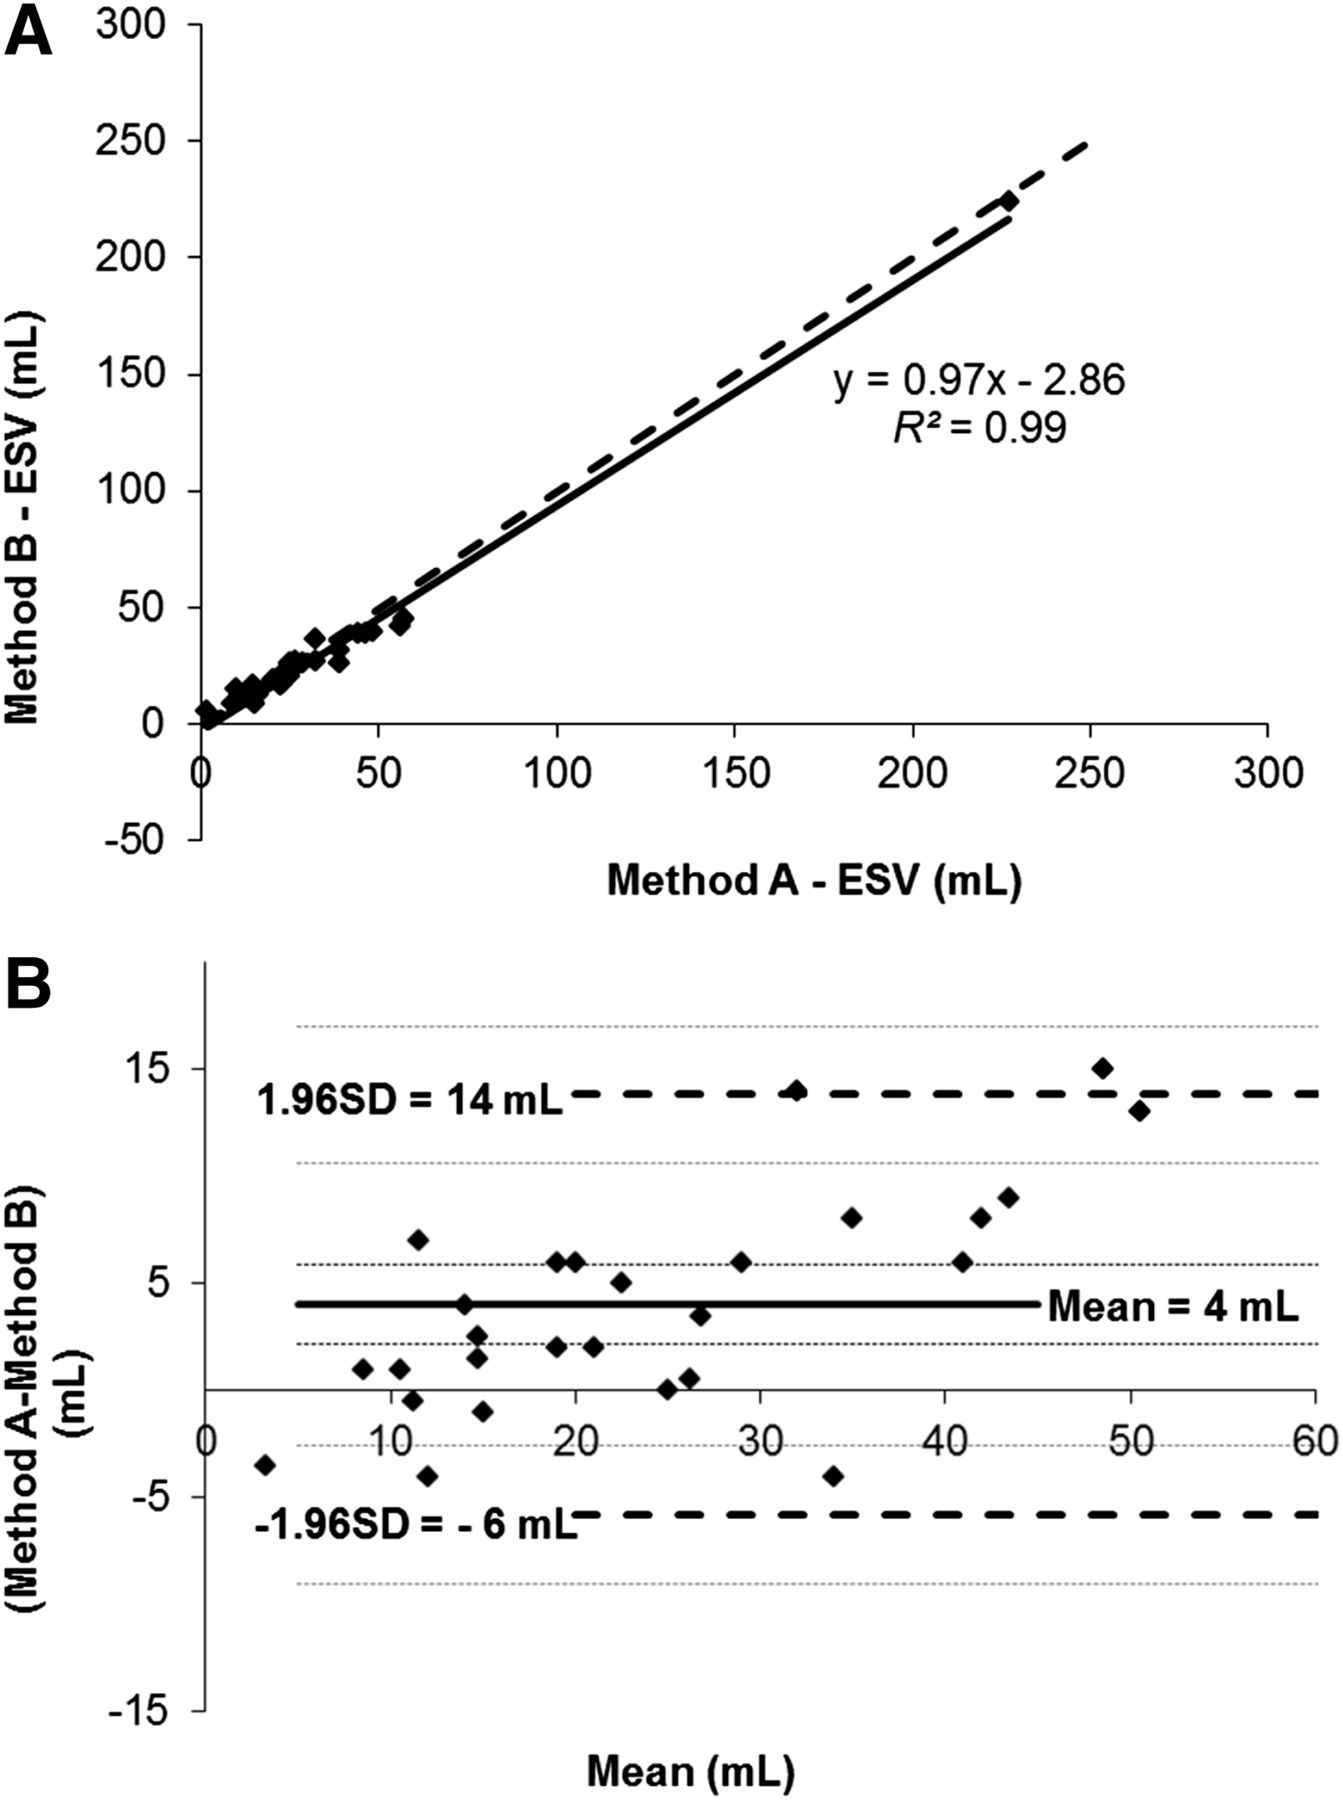
Method A vs. B for ESV. (A) Scatterplot. Linear regression was calculated and is shown as full curve, and line of equality is illustrated by dotted curve. (B) Bland–Altman plot. One point in Bland–Altman plot is omitted due to scaling of x-axis. Bold curve = mean of differences; dotted curve = ±1.96 SDs; small dotted curves = CIs of mean and CIs of limit of agreement.
When EDV and ESV for methods A and B were compared, the Pearson correlation coefficients were in both cases high, r = 0.99, and showed good correlation. From the Bland–Altman plots, Figures 1 and 2, we found that EDV has a systematic error of 11 mL and the systematic error of ESV was 4 mL. EDV and ESV were therefore estimated lower in method B than method A. The Bland–Altman analysis revealed high limits of agreement: 22 mL for EDV and 20 mL for ESV, shown in Figures 1 and 2.
Comparison of LVEF
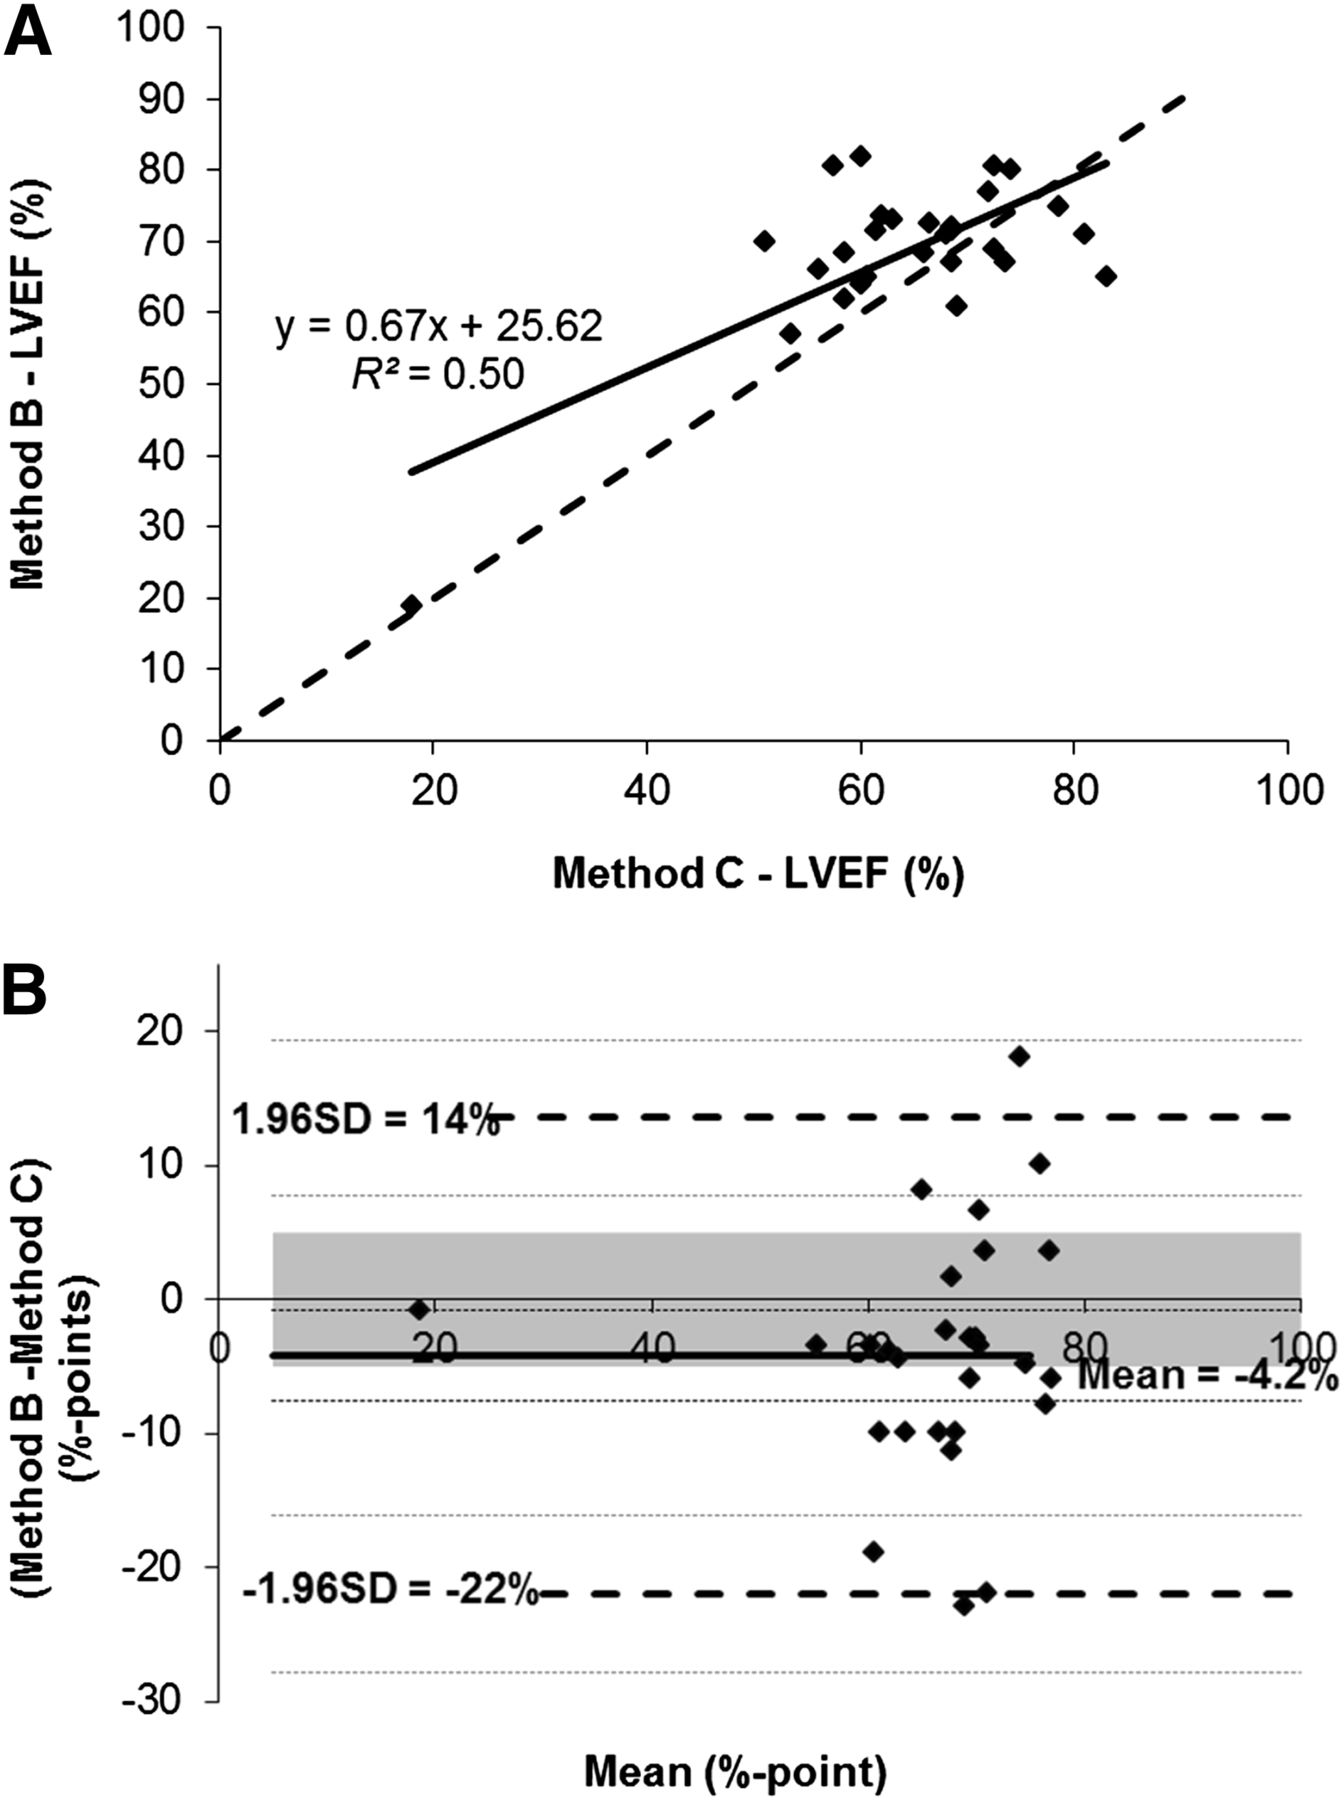
On the Bland–Altman plots, Figures 3–5, we found that the highest systematic error for the LVEF was 4.2% points comparing method B with C, followed by 3.1% points comparing method A with C, and the smallest systematic error was 1.1% points comparing method A with B. In addition to the systematic error, the Bland–Altman plots indicated a significant random variance. For LVEF, the range of limits of agreement were unacceptably high (respectively, ±15% points, ±17% points, and ±18% points for method A vs. B, A vs. C, and B vs. C). There was a poor correlation between methods A and B for assessment of the LVEF (r = 0.71) (Table 5), and LVEF values calculated from 4DMSPECT showed poor to modest correlation with MUGA (r = 0.86 and 0.67).

Method A vs. B for LVEF. (A) Scatterplot. Linear regression was calculated and is shown as full curve, and line of equality is illustrated by dotted curve. (B) Bland–Altman plot. Bold curve = mean of differences; dotted curve = ±1.96 SDs; small dotted curves = CIs of mean and CIs of limit of agreement; gray area = predefined medical limits of 10% points.

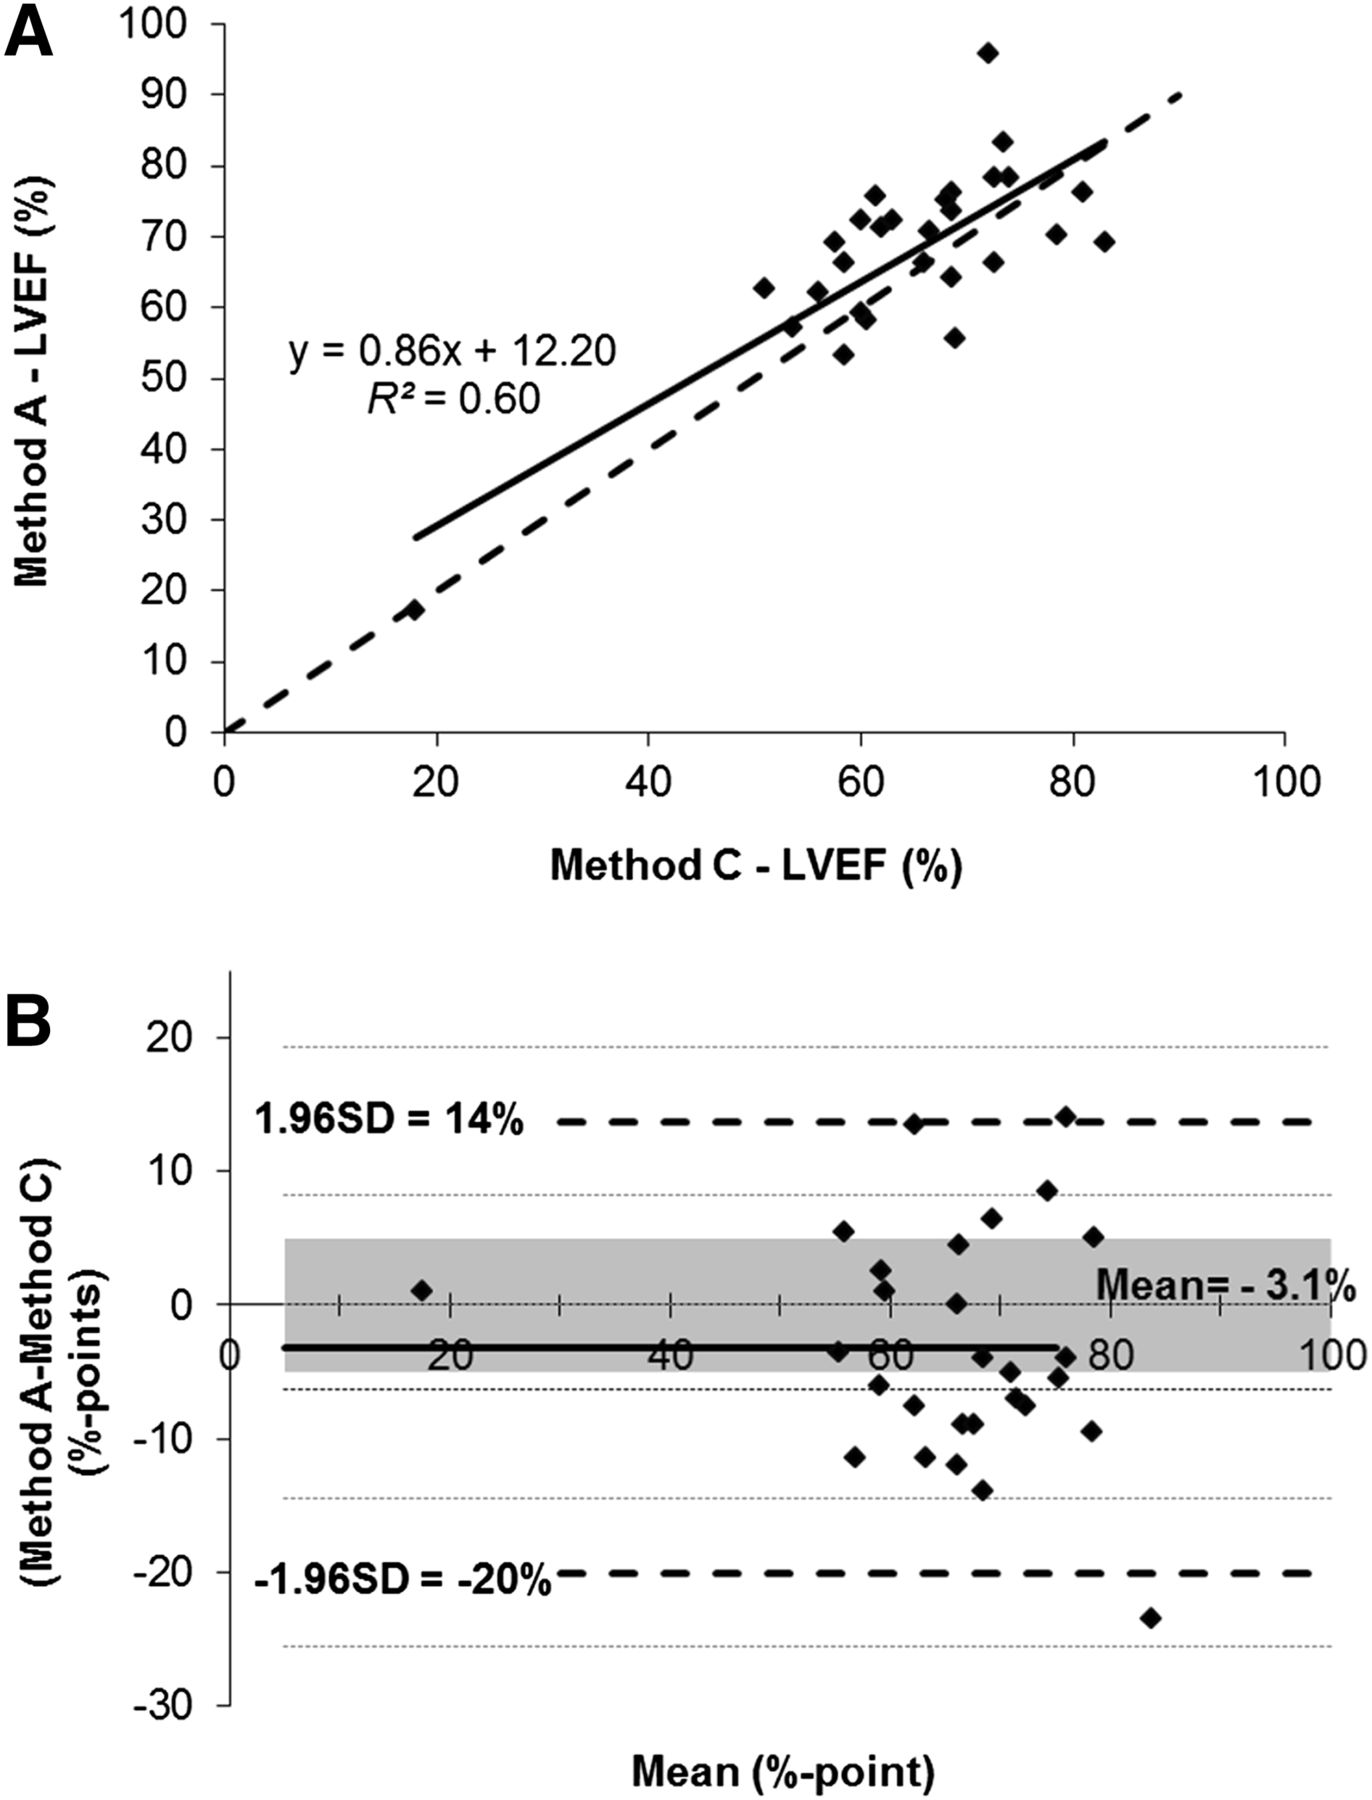
Method A vs. C for LVEF. (A) Scatterplot. Linear regression was calculated and is shown as full curve, and line of equality is illustrated by dotted curve. (B) Bland–Altman plot. Bold curve = mean of differences; dotted curve = ±1.96 SDs; small dotted curves = CIs of mean and CIs of limit of agreement; gray area = predefined medical limits of 10% points.

Method B vs. C for LVEF. (A) Scatterplot. Linear regression was calculated and is shown as full curve, and line of equality is illustrated by dotted curve. (B) Bland–Altman plot. Bold curve = mean of differences; dotted curve = ±1.96 SDs; small dotted curves = CIs of mean and CIs of limit of agreement; gray area = predefined medical limits of 10% points.
Results of Statistical Analysis for LVEF for Each Comparison Between Methods A, B, and C
DISCUSSION
This study evaluated the estimation of LVEF using IQ-gSPECT with different reconstruction settings.
MUGA was chosen as the method of reference, because it remains a generally accepted standard against which other LVEF measurement techniques are evaluated (24–26), and the method has been shown to be as good as MR imaging (27). Twenty-eight patients were included in the study. At this number, we estimated that the width of the 95% limit of agreement was so high that increasing the number of patients would only reduce the CIs and not contribute to reducing the fluctuations around the mean to the medically accepted tolerance.
When the IQ-SPECT system was introduced in 2011, recommendations from the manufacturer for processing of gated studies were to use Siemens Flash3D iterative reconstruction algorithm with 15 iterations and 2 subsets. This process resulted in reconstruction times of 10–12 min per study. To reduce reconstruction time, a new method was later suggested, reducing the number of iterations from 15 to 12 and the number of subsets from 2 to 1. To see the effect of changing reconstruction parameters, we compared method A with method B. This study reveals only a modest correlation (r = 0.83, y = 0.7, b = 20) between the 2 methods.
Using the Bland–Altman analysis, we calculated the mean to −1.1% points. Such a small systematic difference is within our predefined medical limits; however, the variations around the mean cause problems. As seen in the Bland–Altman plot in Figure 3, the differences between the 2 methods are widely spread, and the values for the ±1.96 SDs are high, with values of ±15% points. These variations around the mean tell us how far apart measurements by the 2 methods are likely to be.
Thus, for 95% of the patients the LVEF determined by method B will be within a range of +14% point and −16% points of the LVEF determined by method A.
As shown in Figure 3, the 95% limits of agreement are much wider than the medically accepted limits (the gray area). To accept the 2 methods to be interchangeable, the width of the 95% limits of agreement (and its lower/upper CIs) needs to be less than or equal to the predefined medical limit. In our case, the width of the 95% limits of agreement is 30% points (40% with the CI), which is 3 times (4 times with the CI) larger than our tolerance.
The statistical analysis of the EDV and ESV is summarized in Tables 2–4 and Figures 1 and 2. There is a large systematic error of 11 mL for the estimation of the EDV between the 2 methods and only a small systematic error of 4 mL for the ESV. The limits of agreement are in both cases approximately 20 mL, indicating large fluctuation around the mean. The large limit of agreement for the LVEF between method A and B is due to the large systematic error of the EDV and due to the variations in both EDV and ESV.
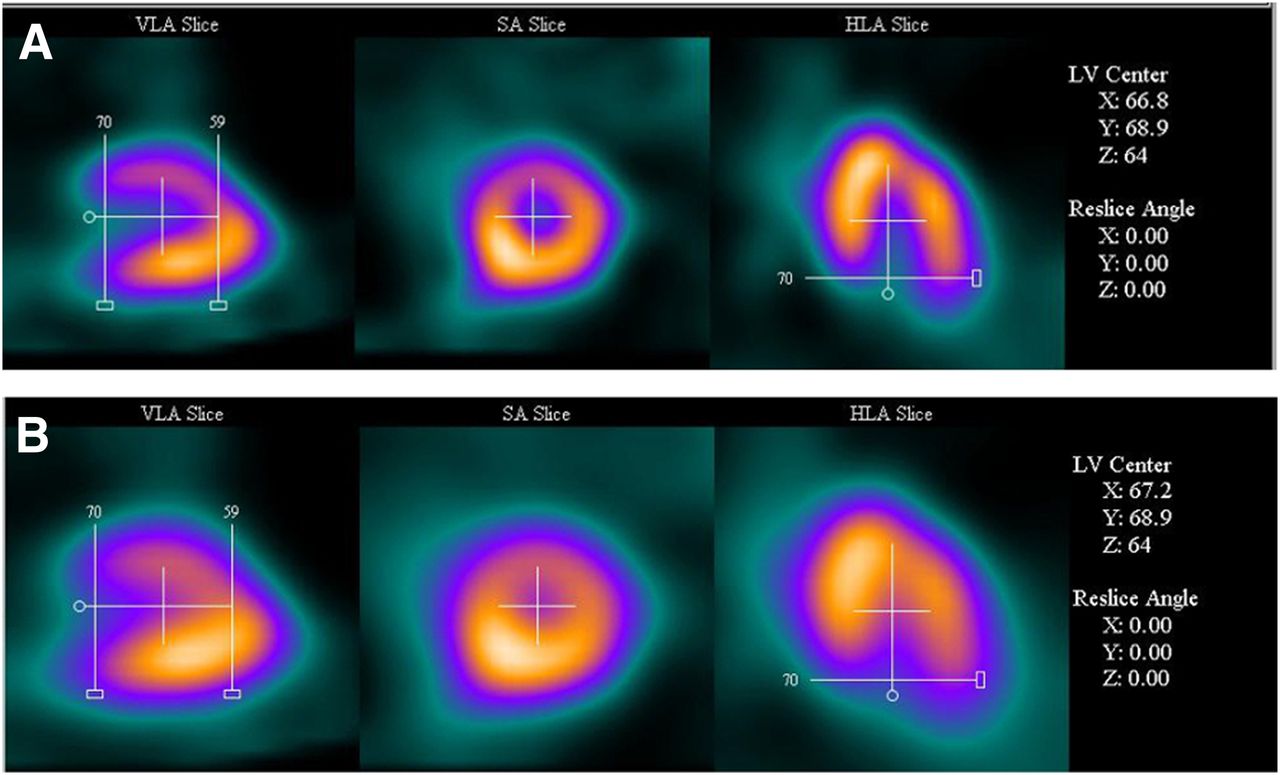
To demonstrate this variation, an example of reconstructed IQ-gSPECT data using methods A and B loaded into 4DMSPECT is displayed in Figures 6 and 7. Method A has better/more clearly defined borders than method B, and the volume of the myocardium seems to be smaller. As the number of iterations and subsets increase, the level of details in the image (including edge sharpness and conspicuity) is expected to improve but also the noise is expected to increase. When the same gaussian filtering is used, the images in method B are in this case oversmoothed (reducing the gaussian filtering has little effect). In Figure 7, the 4DMSPECT seems to have a problem, particularly in method B, with the definition of the borders used for volume estimation.

Screen capture of tap setup in 4DMSPECT. Determination of position of left ventricular (LV) center and apical and basal limits. (A) Results for method A. (B) Results for method B. Quality of images in method B is in this case reduced. Gaussian filtering in method A and B is equal.
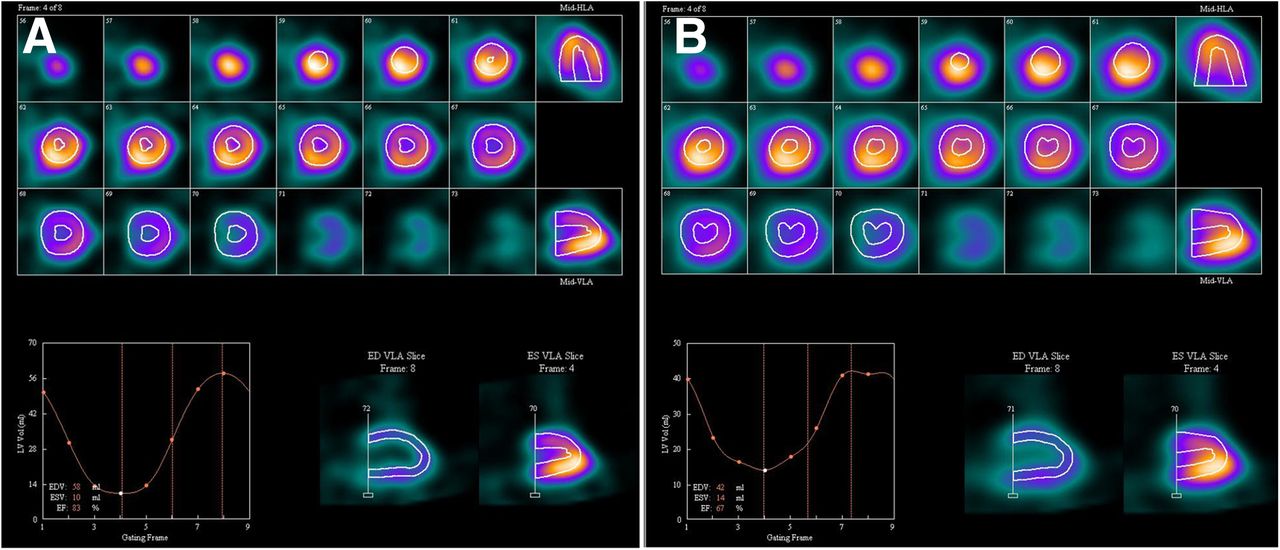
Screen capture of IQ-gSPECT data loaded into 4DMSPECT. Frame 4 of 8 is shown. (A) Results displayed for method A, EDV = 58 mL, ESV = 10 mL, and LVEF = 83%. (B) Results displayed for method B, EDV = 42 mL, ESV = 14 mL, and LVEF = 67%. LVEF for method C = 73%.
Overall, the statistical analysis and example show that with even the most optimistic interpretation there are considerable discrepancies between the 2 methods, and we think that the disagreement is unacceptable for clinical use.
Another question to be answered is whether the LVEF measured by either method A or method B is comparable to the method of reference. When method A was compared with method C, the scatterplot in Figure 4 and Table 5 shows that the correlation between the 2 methods was poor. The Pearson correlation coefficient is only 0.77, with a y intercept at 12 and a gradient of 0.86. The deviation from the identity line is obvious. From the Bland–Altman analysis, the mean difference is calculated to −3.1% points, which are within our predefined limit. As before, the variations around the mean are high, and the ±1.96 SDs are equal to ±17% points. In this case, we can estimate that for 95% of the patients examined, the LVEF determined by method A will be between 14% points above the method of reference and 20% points below. The limit of our medically accepted error of 10% points is thus exceeded by a factor of more than 3, implying that method A cannot be used as an alternative for estimation of the LVEF, compared with method C.
Comparing method B and C is even worse. The Pearson correlation coefficient is as low as 0.70, and visual inspection of the scatterplot in Figure 5 confirms that the correlation is poor. The mean difference is calculated to −4.2% points, and the limits of agreement are ±1.96 SDs = 18.2% points. Once again, we estimated that for 95% of the subjects the LVEF determined by method B would be between 14% points above method of reference and 22% points below. The predefined medical limit was exceeded with a factor close to 4, and we must conclude that methods B and C are not interchangeable.
In summary, none of the values EDV, ESV, and LVEF generated by the methods A, B, and C are comparable because of the large variations.
To the best of our knowledge, most of the studies performed with IQ-SPECT are nongated SPECT MPI, comparing image quality with conventional SPECT MPI (28–31). Onishi et al. (31) showed that the spatial resolution in the center of the scanner and image quality of the IQ-SPECT was comparable to the conventional SPECT (in a radius of 28 cm), suggesting that IQ-SPECT would be the optimal technology for MPI because of the reduced acquisition time. However, IQ-gSPECT’s ability to quantify the EDV, ESV, and LVEF was not investigated because gated phantom studies were not performed. Corbette et al. (28) found in a single-center clinical trial that IQ-SPECT provided better image quality than conventional SPECT, but again gated studies were not performed. Caobelli et al. (29,30) concluded that MPI with IQ-SPECT protocol can be acquired using about a quarter the scan time normally needed without disagreement, compared with full-time scan acquisition performed with standard protocols but only for nongated studies. A paper from Siemens Healthcare (Hawman et al. (7)) evaluated several patient studies to describe the differences between conventional SPECT and IQ-SPECT, but none of the studies was done as gSPECT, and estimation of EDV, ESV, and LVEF was lacking. An earlier paper from Siemens (11) compared the IQ-gSPECT with LEHR conventional gSPECT for estimation of the LVEF analyzed with 4DMSPECT. We have not asked Siemens Healthcare for permission to transmit the results. Talleruphuus et al. (32) have also compared the quantification of the EDV, ESV, and LVEF between IQ-gSPECT and conventional LEHR gSPECT. For conventional gSPECT the values for LVEF, ESD, and EDV were 60.8 ± 3.0% points, 44.2 ± 6.6% points, and 101.6 ± 10.1% points. For IQ-gSPECT, the corresponding values were 66.0 ± 4.2% points, 32.2 ± 6.2% points, and 79.2 ± 9.3% points. They concluded that IQ-gSPECT studies exhibited systematic deviations from conventional studies concerning EDV, ESV, and LVEF (as estimated by Quantitative Gated SPECT software [QGS]).
A follow-up of our study would be to compare the LVEF estimated with other software packages (e.g., QGS, Emory toolbox) and try to optimize the reconstruction settings to see if it is possible to obtain values for the LVEF that are comparable to the LVEF estimated by method C.
Some limitations of this study should be noted. First, most of our patients had normal LVEF. The correlation in patients with impaired left-ventricular function should be further evaluated in the 15%–50% range. Second, the acquisition of gSPECT was performed more than 1 h after the pharmacologic stress test. The effect of myocardial stunning in the state of poststress was unknown. Third, there are known variations in the estimation of EDV, ESV, and LVEF between third-party cardiac software packages, caused by differences in the way the contours that identify the cardiac surfaces are generated (33). Only the software package 4DMSPECT has been used here. Fourth, quantification of LVEF is dependent on the number of gates per cardiac cycle. In methods A and B, 8 gates per cardiac cycle are used, and in method C 16 gates per cardiac cycle are used. In 1995, Germano et al. (34) showed that the use of 8 gates per cardiac cycle instead of 16 resulted in a constant and predictable 4% points decrease in LVEF. However, this should not influence our results. The main problem is the LVEF variations between the 2 methods.
CONCLUSION
Some differences in the measurement of LVEF can be expected when using different imaging techniques. To evaluate whether 2 methods were interchangeable, we defined an acceptable clinical change for the total deviation of LVEF, which was set to 10% points. With this limit in mind, we can conclude that changing the reconstruction settings for the iterative algorithm has a large impact on the estimation of EDV, ESV, and LVEF using IQ-gSPECT. Therefore, methods A and B are not interchangeable. Furthermore, we can conclude that neither LVEF value using method A nor that using method B (estimated with 4DMSPECT) is comparable with LVEF estimated by MUGA, and the methods are not suitable for evaluation of LVEF in critical settings, for example, in control of chemotherapy or evaluation of cardiac pumping efficiency.
DISCLOSURE
No potential conflict of interest relevant to this article was reported.
Footnotes
Published online Jun. 25, 2015.
REFERENCES
- Received for publication February 3, 2015.
- Accepted for publication May 5, 2015.


