


Article Figures & Data
Figures
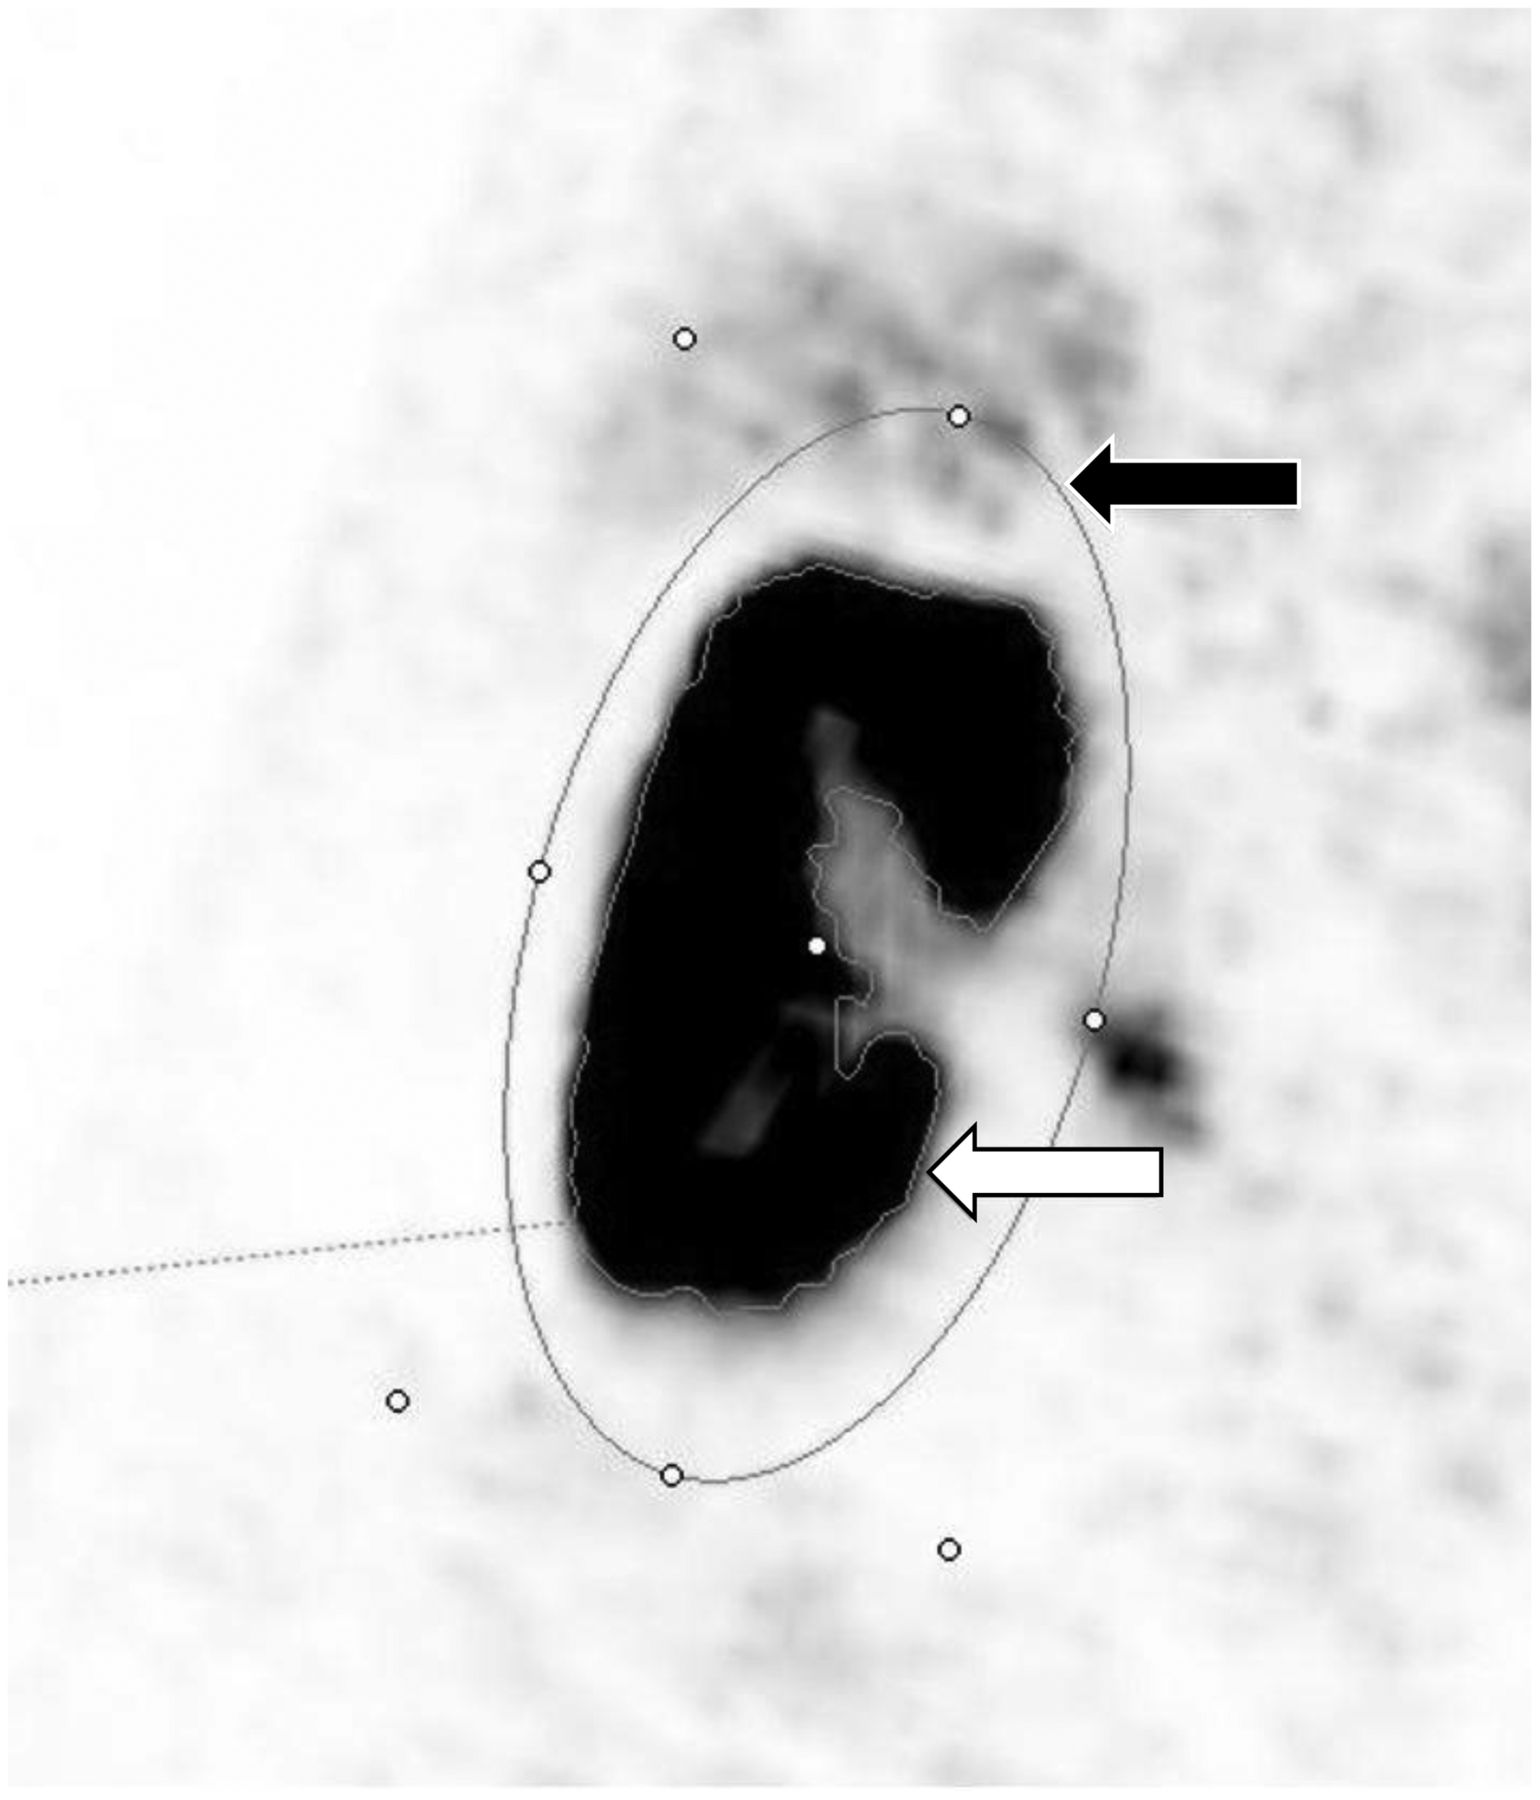
- FIGURE 1.
Example of VOI placement. Ovoid VOI is placed around kidney (black arrow). Software automatically traces edge with previously defined lower boundary of SUVmax of 10, thus establishing isocontour VOI with whole cortical kidney volume (white arrow).
- FIGURE 2.
Example of VOI placement for liver (A), spleen (B), and blood pool (C). VOIs for liver and blood pool are drawn by software, whereas splenic VOI had to be drawn manually. Color version of this figure is available as supplemental file at http://tech.snmjournals.org.
- FIGURE 3.
Example of excluded patient. Because of the large portion of calyceal tracer (circled), patient was omitted from measurement as software would add this area, falsifying measured values.
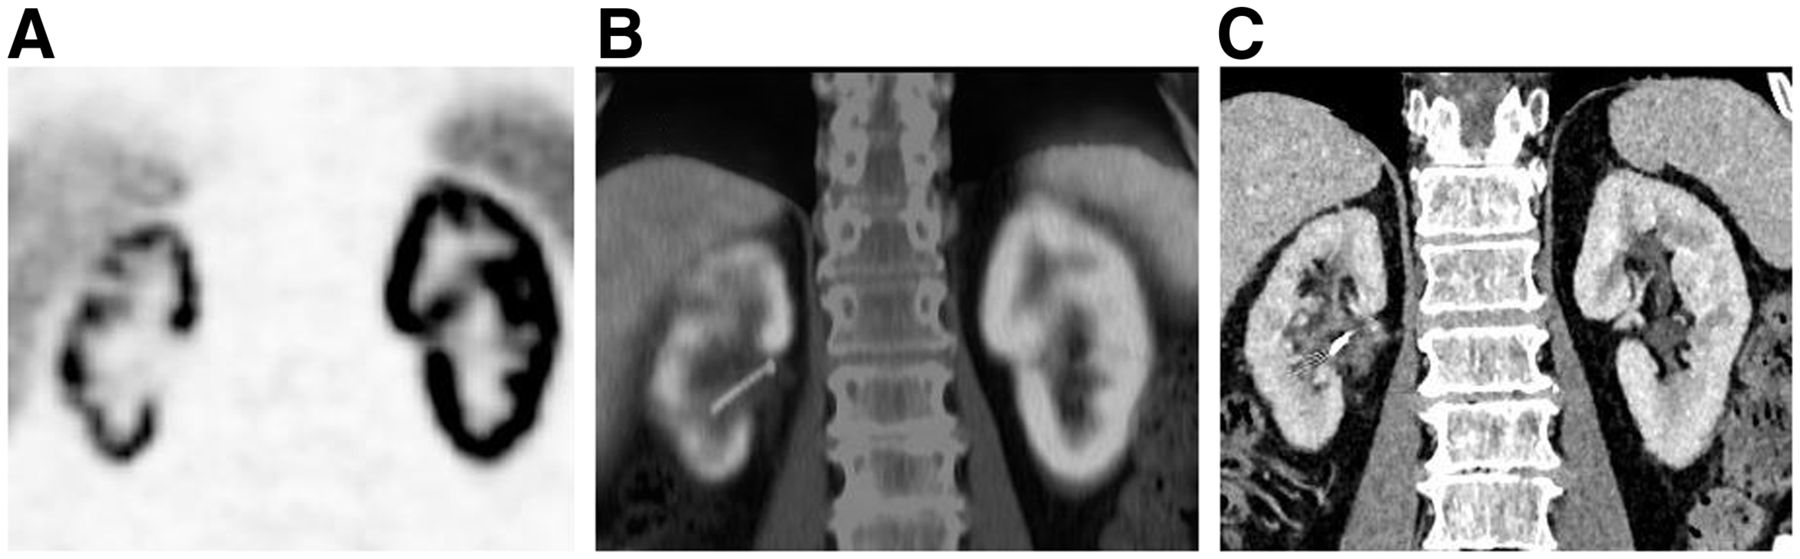
- FIGURE 4.
Example of strong asymmetry between kidneys. Because of mechanic outflow obstruction, right kidney atrophied and, later, nephrostomy was placed. Shown are PET (A), PET/CT (B), and contrast-enhanced CT (C). Color version of this figure is available as supplemental file at http://tech.snmjournals.org.


Tables
Covariate n Mean SD Minimum Maximum Age 25 71.6 9.84 34 82 Weight 25 88.4 13.72 68 116 Height 25 175.4 5.07 163 182 Body mass index 25 28.70 4.0 22.7 37.6 GFR 25 78.64 17.71 53 134 Creatinine 25 85.32 17.02 50 114 Covariate n Mean SD Minimum Maximum Mean SUVmax 25 57.75 20.68 21.90 100.95 Mean SUVmean 25 27.68 10.68 12.97 57.75 Mean SULmax 25 41.86 13.9 15.4 66.97 Mean SULmean 25 18.19 4.59 9.12 25.8 SUVmean liver 25 4.46 1.38 2.1 6.8 SUVmean bp 25 1.16 0.32 0.5 1.70 SUVmean spleen 25 6.13 2.42 2.8 11.4 Renal SUVmax/liver ratio 25 14.33 6.95 3.22 32.65 Renal SUVmax/bp ratio 25 53.61 22.94 19.91 100.95 Renal SUVmax/spleen ratio 25 10.99 6.21 2.55 28.84 Renal SUVmean/liver ratio 25 6.94 3.89 1.91 19.48 Renal SUVmean/bp ratio 25 26.17 13.03 9.43 57.75 Renal SUVmean/spleen ratio 25 5.23 4.86 1.51 16.50 Sum volume 25 354 93.61 194 567 Sum TLG 25 9,968.8 5,042.7 2,520 26,999 Sum TLG (SUL) 25 7,758.4 4,093.8 1,772.3 19,112.9 Sum counts 25 8,077.5 3,985.8 2,176 17,473 bp = blood pool.
- TABLE 3.
Spearman Rank Correlation Coefficient Estimate Between GFR and Creatinine, with Several Covariates Along with Their CI Using Bootstrapping with Bias-Corrected and Accelerated Method Based on 2,000 Resamples
GFR Creatinine ρ Covariate ρ P 95% CI ρ P 95% CI SUVmean liver −0.310 0.132 −0.634, 0.118 0.218 0.295 −0.246, 0.606 SUVmean bp −0.415 0.039 −0.753, 0.064 0.346 0.090 −0.105, 0.723 SUVmean spleen −0.130 0.535 −0.519, 0.285 0.057 0.786 −0.423, 0.514 Mean SUVmax 0.199 0.340 −0.224, 0.596 −0.226 0.278 −0.583, 0.161 Mean SUVmean 0.317 0.123 −0.090, 0.645 −0.329 0.108 −0.653, 0.063 Renal SUVmax/liver ratio 0.402 0.046 0.028, 0.706 −0.364 0.074 −0.731, 0.124 Renal SUVmax/bp ratio 0.471 0.018 0.115, 0.736 −0.422 0.036 −0.738, 0.017 Renal SUVmax/spleen ratio 0.245 0.237 −0.160, 0.614 −0.210 0.314 −0.631, 0.287 Renal SUVmean/liver ratio 0.505 0.010 0.102, 0.786 −0.451 0.024 −0.800, 0.041 Renal SUVmean/bp ratio 0.574 0.003 0.220, 0.832 −0.515 0.008 −0.820, −0.075 Renal SUVmean/spleen ratio 0.353 0.083 −0.075, 0.689 −0.304 0.140 −0.708, 0.209 Sum counts 0.124 0.554 −0.245, 0.467 −0.159 0.446 −0.537, 0.269 Sum volume −0.005 0.982 −0.391, 0.397 −0.038 0.856 −0.398, 0.324 Sum TLG 0.225 0.280 −0.166, 0.570 −0.268 0.195 −0.617, 0.164 Age −0.683 0.001 −0.907, −0.344 0.565 0.003 0.175, 0.839 Weight 0.133 0.528 −0.224, 0.473 −0.175 0.402 −0.530, 0.220 Height 0.158 0.452 −0.279, 0.513 −0.194 0.354 −0.546, 0.217 Body mass index 0.061 0.773 −0.392, 0.466 −0.100 0.635 −0.481, 0.341 Mean SULmean 0.343 0.093 −0.031, 0.622 −0.329 0.108 −0.640, 0.075 Mean SULmax 0.171 0.413 −0.229, 0.532 −0.190 0.362 −0.555, 0.230 Sum TLG (SUL) 0.334 0.103 −0.080, 0.644 −0.361 0.076 −0.653, 0.031 bp = blood pool; ρ = estimated Spearman rank correlation coefficient.
P values are based on 2-sided test.
Supplemental Data
Files in this Data Supplement:


