


Abstract
The administered dose of 18F-FDG can be greatly reduced using body mass index (BMI) instead of the patient’s weight, without diminishing image quality. We have focused on reducing the administered dose while maintaining the acquisition time and have developed dosing-based algorithms using BMI. We conducted a prospective dose-adjustment research study with more than 1,800 patients undergoing time-of-flight PET/CT. Methods: From January 2009 to October 2010 we recruited 1,000 patients, of whom 180 were randomly selected to create the control group. The treatment group was created by selecting 180 new subjects from a total of 800 recruited from January to December 2011. The control group was administered a body weight–calculated dose of 5.55–7.4 MBq/kg. The treatment group was administered a BMI-calculated dose of 6.85–11.1 MBq/BMI. Each group was divided into 5 subgroups according to BMI classification (underweight, normal weight, overweight, obese, and morbidly obese). All scans were acquired with a time-of-flight PET/CT scanner and were evaluated in a masked manner by 2 nuclear medicine physicians. Evaluation of images was purely qualitative, with visual scoring of image quality from 1 to 3 (high to low). These data were analyzed for statistical significance. Dosimetric measures of patients’ emitted radiation were taken at the surface and at a distance of 0.5 m and 1 m to compare the groups. The readings of PET staff dosimeters were evaluated during this period and analyzed. Results: A reduction of between 9% and 22% in administered dose per patient was achieved for the BMI-derived dose group with respect to the body weight–calculated dose group. In addition, an effective dose reduction of 56% and 12.5% for patients and staff, respectively, was achieved. The cost per study was therefore reduced while diagnostic image quality was maintained or even improved in most cases. Conclusion: BMI-calculated doses, which are often lower than strictly weight-based doses, can be administered while maintaining acquisition times. This dose reduction is not only consistent with the as-low-as-reasonably-achievable principle but can be performed without diminishing diagnostic accuracy and should lead to lower dose to staff and potential economic savings.
Whole-body 18F-FDG PET/CT imaging has become an indispensable tool for diagnosis, staging, and restaging of a wide variety of cancers (1,2). It provides valuable functional and anatomic information that can demonstrate and precisely locate foci of abnormal metabolic activity before the appearance of morphologic alterations, therefore increasing the specificity and sensitivity of the examination. This is the reason why the number of PET/CT studies has increased at the expense of other diagnostic imaging techniques, especially CT studies. However, although 18F-FDG PET/CT has increased diagnostic value, it also considerably increases the radiation dose received by patients. Epidemiologic studies have linked exposure to the radiation in PET/CT studies with the development of radiation-induced cancer (3–6).
An increasing number of studies advocate using a low-dose CT acquisition in PET/CT studies (7–11). In January 2010, our department established a low-dose protocol for PET/CT.
National and international procedure guidelines and the scientific literature agree that the patient’s weight is the limiting factor for dose adjustment of 18F-FDG (12,13). However, we believe that this criterion is obsolete. New technologies that have been developed for current PET/CT scanners—such as time-of-flight technology (14–17)—improve the signal-to-noise ratio, resulting in a higher image quality even when the administered dose is reduced (ImPACT CT Patient Dosimetry Calculator, version 1.0.4 (18)). Therefore, it was necessary to find a new way to adjust the 18F-FDG dose in PET/CT studies. The aim of this prospective study was to prove the feasibility of using body mass index (BMI) to reduce the administered amount of 18F-FDG in whole-body PET/CT scans without compromising diagnostic accuracy.
MATERIALS AND METHODS
Patients
From January 2009 to October 2010, 1,000 patients (mean age, 59 y; range, 18–89 y) were prospectively recruited for 18F-FDG whole-body PET/CT scans in our department, and from January to December 2011, 800 patients were recruited (mean age, 55 y; range, 21–86 y). The former set of patients was recruited for the control group, and the latter set, for the treatment group. The inclusion criterion was adult patients with known or suspected cancer. The exclusion criteria were pregnant or nursing patients, patients unwilling or unable to undergo serial imaging studies, and diabetic patients. The performed procedures were in accordance with the World Medical Association Declaration of Helsinki (1975 and subsequent additions). Our research was approved by the ethics committee of the hospital, and informed patient consent was obtained before the PET/CT scans were performed.
PET/CT Protocol
All imaging studies were performed using a PET/CT system (Gemini TF16; Philips) providing an axial field of view of 600 mm and a transaxial slice thickness of 5 mm. CT scans were used for anatomic registration with emission images and for attenuation correction. All PET/CT scans were obtained on the time-of-flight system and were reconstructed with a fully 3-dimensional line-of-response–based iterative algorithm (19).
Patients were instructed to fast for at least 6 h before the injection of 18F-FDG. An intravenous cannula was placed in the arm or the back of the hand, and a blood sample to determine glycemia was drawn before 18F-FDG administration. Images were acquired 60–80 min after injection. Patients were positioned supine with both arms raised.
The height and weight of each patient were recorded, and the metric BMI was calculated (weight in kg/[height in m]2). Each patient was categorized according to the guidelines of the National Institute of Sanitary Management and the World Health Organization as underweight (BMI ≤ 18.49 kg/m2), normal weight (18.5–24.9 kg/m2), overweight (25–29.9 kg/m2), obese (30–39.9 kg/m2), or morbidly obese (≥40 kg/m2). Furthermore, we included both a control group and a treatment group for comparison of diagnostic quality image.
A bolus 18F-FDG injection of 5.55–7.4 MBq/kg was administered to the control group and 6.85–11.1 MBq/BMI to the treatment group (10.22 MBq/BMI for underweight patients, 9.30 MBq/BMI for normal-weight patients, 8.18 MBq/BMI for overweight patients, 7.16 MBq/BMI for obese patients, and 6.55 MBq/BMI for morbidly obese patients).
A low-dose CT scan from the base of the skull through the mid thigh, with the patient supine, was obtained (120 kVp, 90–120 mAs, 0.75-s rotation time, 16 × 1.5 mm collimation, pitch of 0.813, 5.0-mm slice thickness, and 2.5-mm spacing) before the PET scan. The CT image data were then used to automatically position the patient for the PET acquisition. The emission acquisition time was 1 min 30 s per bed position, and the complete patient study involved 7–9 overlapping bed positions.
Images were analyzed on a dedicated workstation (Extended Brilliance Workspace 4.0, with Syntegra software; Phillips).
Pilot Study
In a December 2010 pilot study, 5 doses of 18F-FDG, each lower than the previous, were injected into 5 patients with the same BMI (21.75) before a whole-body PET/CT examination on the Gemini TF16 scanner. We established that 203.5 MBq was the lower limit for obtaining the best diagnostic image quality. The results allowed us to develop a dual-output table entry: the first output being the BMI and the second the dose correction factor, a dosing-based algorithm extracted from the correlation between dose and BMI to create our own unique injection table (Table 1) to be used for the treatment group.
Administered Doses (MBq) of 18F-FDG Adjusted on the Basis of BMI
Main Study
Of the 1,000 patients recruited for the control group and the 800 for the treatment group, only 180 from each group (360 total) were necessary for the final study population. This sample size was calculated with a 95% confidence level (α = 0.05 and z = 1.96). These 360 patients were randomly selected; 66.65% were men (mean age ± SD, 58 ± 15 y; range, 18–87 y) and 33.35% were women (mean age, 59 ± 16 y; range, 20–89 y). All studies were of diagnostic quality, and none had to be repeated. The average blood glucose level was 6.1 (±0.6) mmol/L.
Each subgroup in the control group included approximately the same number of patients as its corresponding subgroup in the treatment group. From the control group we selected 5 underweight patients (2.8%), 73 normal-weight patients (40.6%), 74 overweight patients (41.1%), 26 obese patients (14.4%), and 2 morbidly obese patients (1.1%). From the treatment group we selected 5 underweight patients (2.78%), 75 normal-weight patients (41.67%), 74 overweight patients (41.11%), 25 obese patients (13.89%), and 1 morbidly obese patient (0.56%) (Figs. 1 and 2).

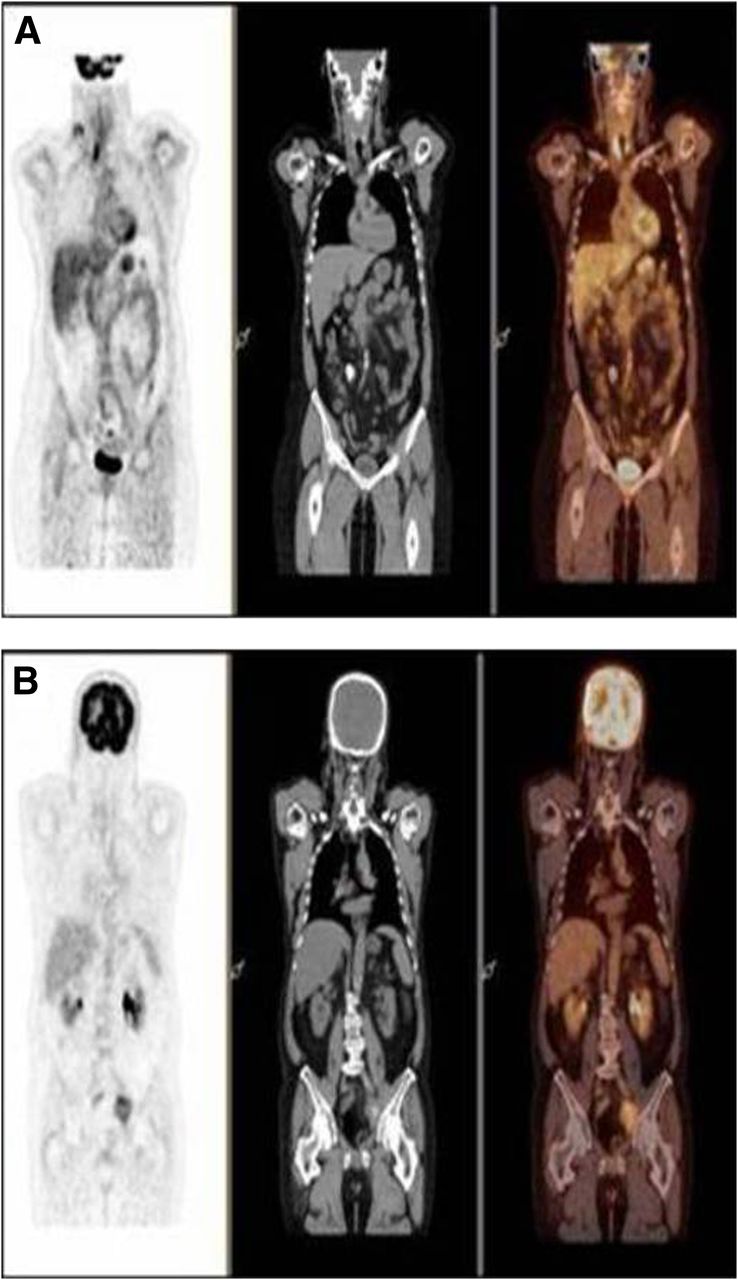
Patients from normal-weight subgroup. (A) Control-group patient 57 kg in weight, 1.69 m in height (BMI, 19.96), and injected with 272.69 MBq of 18F-FDG was scored 1 for image quality control. (B) Treatment-group patient 56 kg in weight, 1.68 m in height (BMI, 19.84), and injected with 190 MBq of 18F-FDG was scored 1 for image quality control.
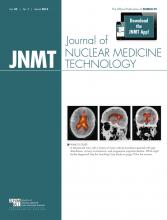
Patients from obese subgroup. (A) Control-group patient 80 kg in weight, 1.59 m in height (BMI, 31.64), and injected with 298.22 MBq of 18F-FDG was scored 3 for image quality control. Activity is seen in soft tissues, and PET image has poor signal-to-noise ratio. (B) Treatment-group patient 82 kg in weight, 1.63 m in height (BMI, 30.86), and injected with 223.11 MBq of 18F-FDG was scored 1 for image quality control. Neither patient was diabetic.
The scans were shown to 2 nuclear medicine physicians for an independent visual scoring in accordance with qualitative image criteria. A score of 1 indicated excellent diagnostic quality; 2, normal quality; and 3, the poorest quality. To avoid bias in the results, the physicians never knew to which group each patient had been assigned.
These data were analyzed by SigmaPlot software for Windows (Microsoft). The interobserver correlation coefficient and the 95% confidence interval were used to evaluate the reproducibility of the measurements. A level of statistical significance of 5% was adopted.
Dosimetry Control
The second part of this project was to statistically demonstrate a reduction in the external radiation emission from each patient. We used a large-volume ionization chamber (RAM ION; Rotem Industries Ltd.) for this measurement. The device is highly stable and accurate in the measurement of dose rates (1 μSv/h to 500 mSv/h) and, according to our radiologic protection service, was the most appropriate radiation detector that we had for this task.
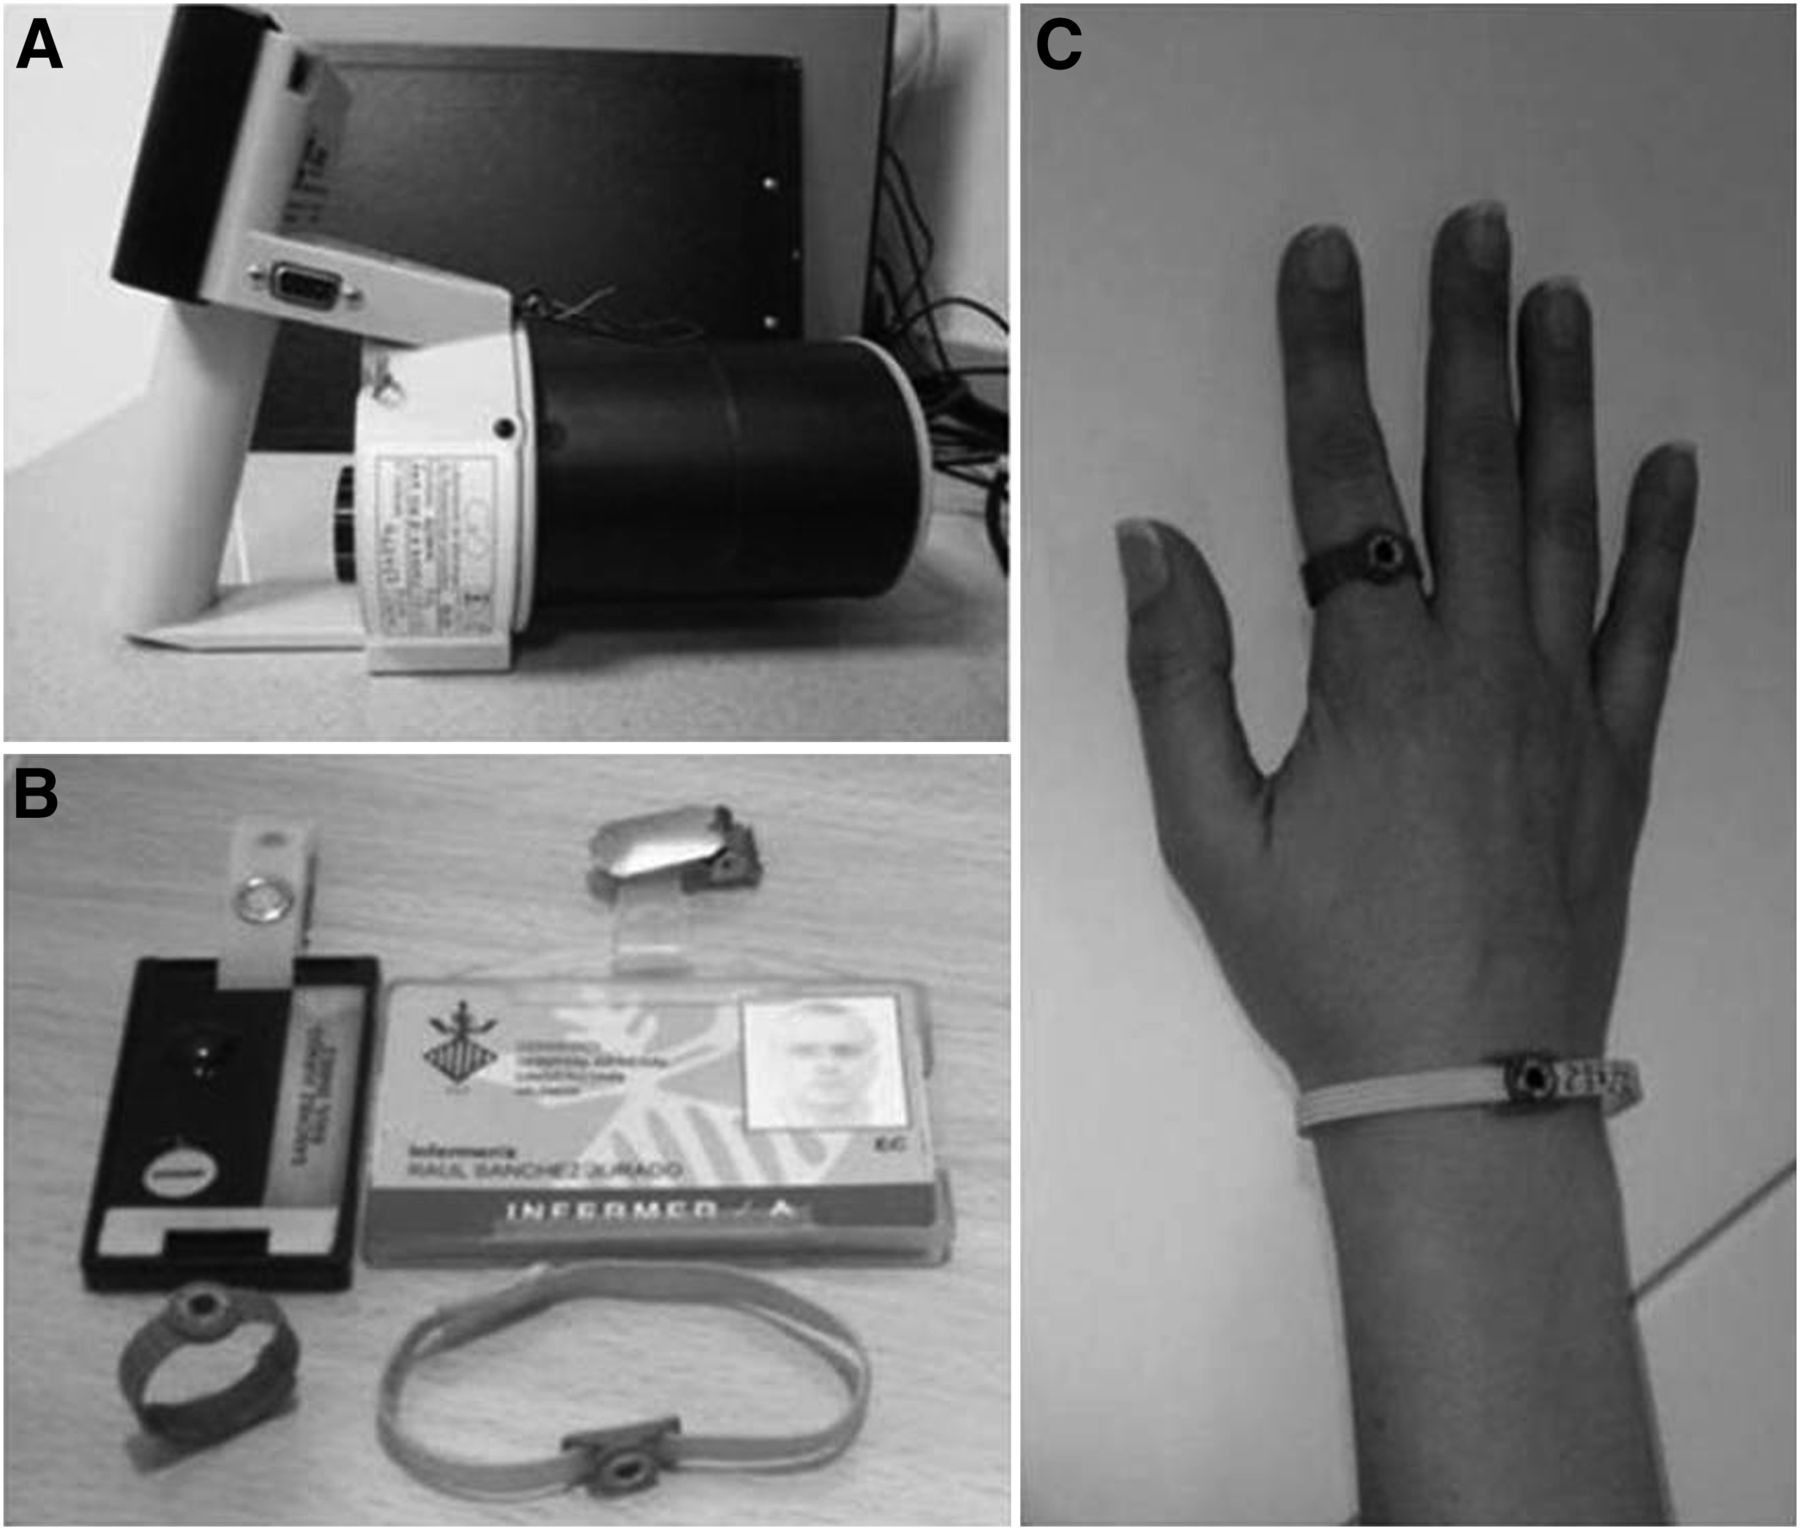
Immediately after administration of the tracer, qualified personnel took measurements at the surface of the patient’s skin and at distances of 0.5 and 1 m and entered the measurements into a database. Occupational exposure of the staff that prepared and injected 18F-FDG doses was also monitored. Personal whole-body, wrist, and ring dosimeters were worn by the staff and sent monthly to a dosimetric control center to determine the accumulated effective doses during such tasks as managing the dose, injecting the tracer, accompanying the patient, and positioning the patient for the examination (Fig. 3).

(A) Volume ionization chamber (RAM ION) used in this project. (B) Identification tag and personal whole-body, wrist, and ring dosimeters assigned to department personnel to measure accumulated effective dose. (C) Proper positioning of wrist and ring dosimeters.
RESULTS
The average body weight–derived doses administered to the control group were 313 MBq for morbidly obese patients, 294 MBq for obese patients, 286 MBq for overweight patients, 275 MBq for normal-weight patients, and 245 MBq for underweight patients (Table 2). The average BMI–derived doses administered to the treatment group were 284 MBq for morbidly obese patients, 240 MBq for obese patients, 224 MBq for overweight patients, 215 MBq for normal-weight patients, and 194 MBq for underweight patients. The respective dose savings were 9.27%, 18.37%, 21.68%, 21.82%, and 20.82% for the treatment group with respect to the control group. The presumed overall average dose reduction was 18.39% (±5.28).
Results for Administered 18F-FDG by Group and Image Quality Scoring
The scoring results for the scans were clearly superior in the treatment group (Table 2). An image quality score of 1 (Fig. 1) occurred in the treatment group at approximately double the rate in the control group (117 vs. 67), and a score of 3, the poorest quality, occurred 3 times less often in the treatment group than in the control group (16 vs. 52) (Fig. 2). The interobserver correlation coefficient showed excellent reproducibility, with coefficients that were always above 0.95 (Table 3).
Interobserver Correlation Coefficient (ICC), 95% Confidence Interval (CI), and Level of Significance
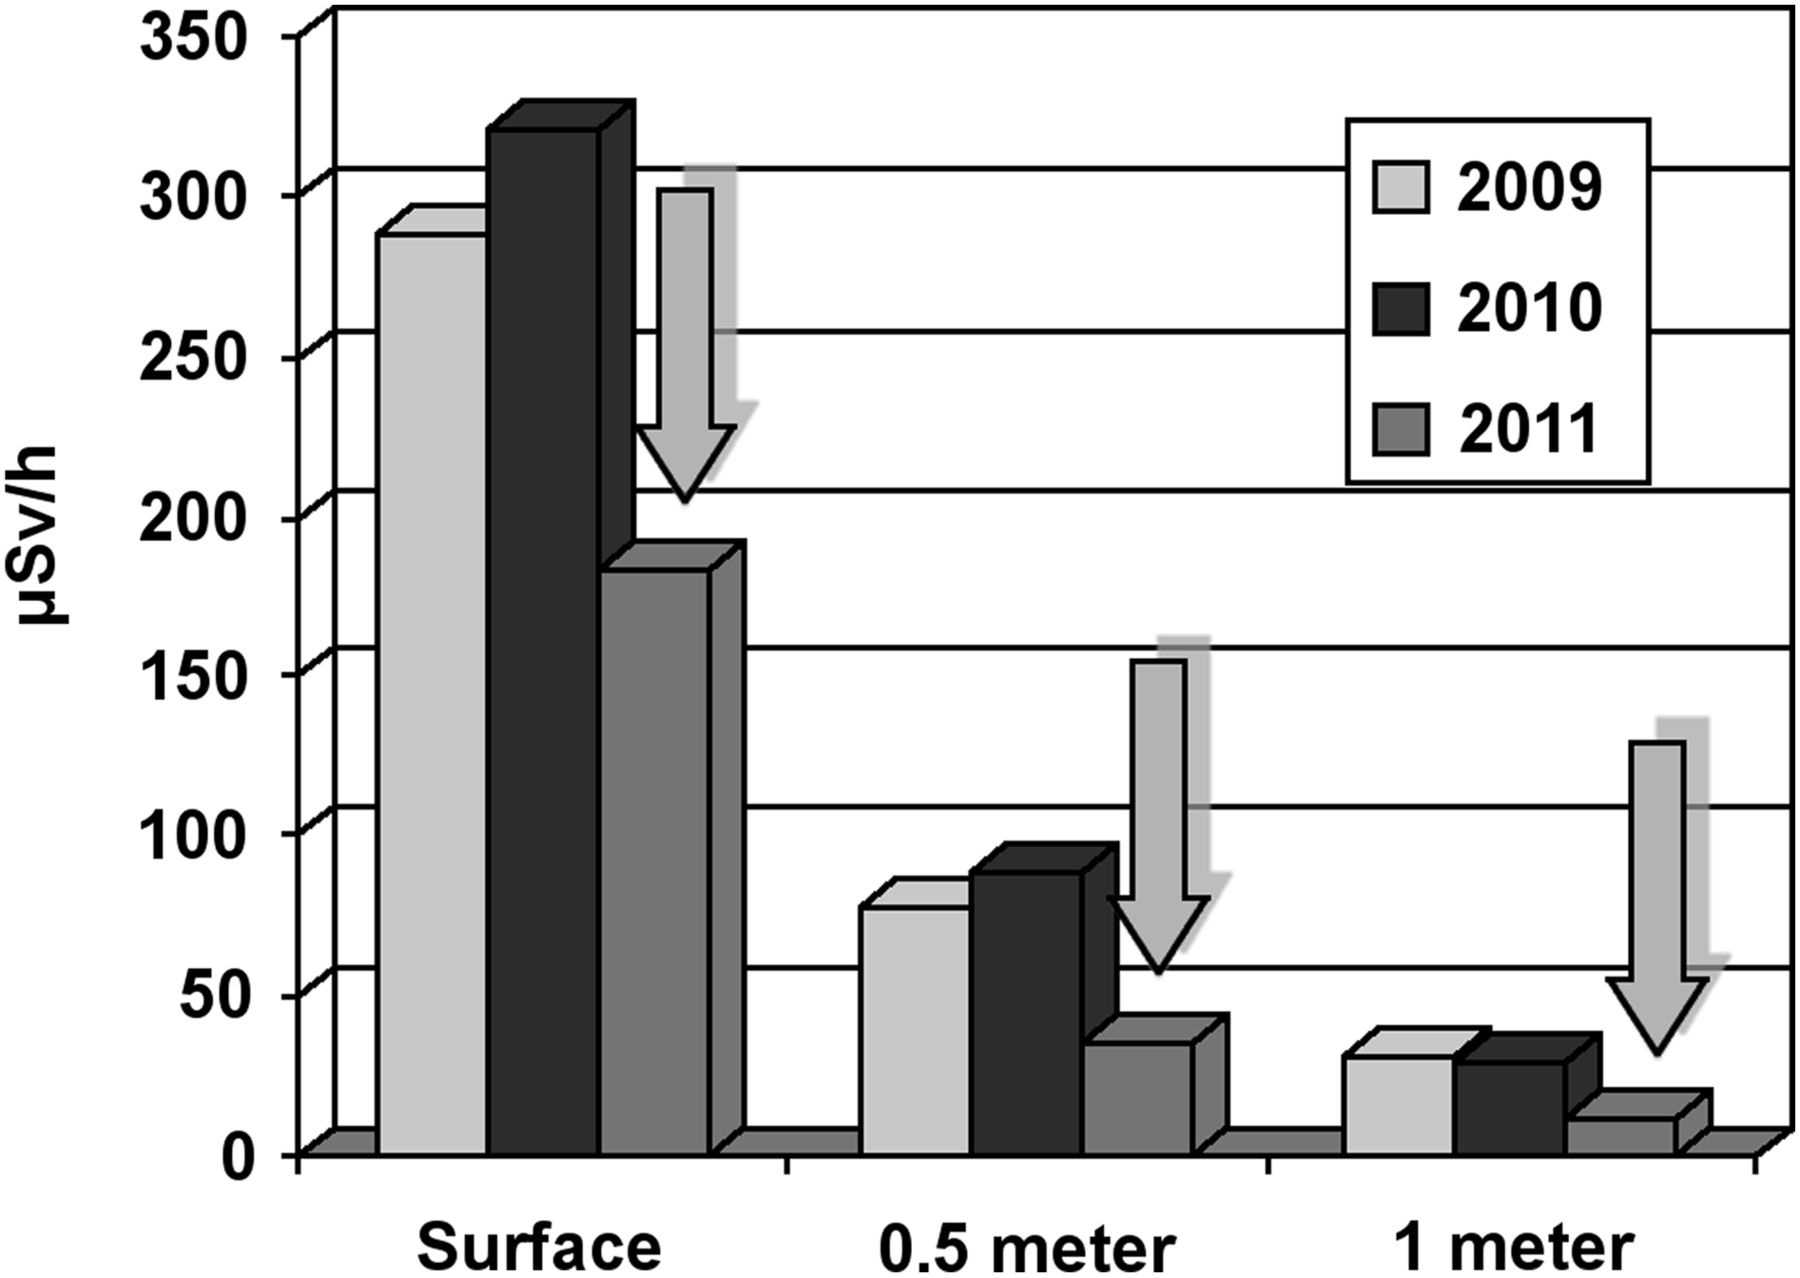
The average external radiation emission of the control group was 300 (±10) μSv/h at the surface, 80 (±5) μSv/h at 0.5 m away, and 30 (±5) μSv/h at 1 m away. For the treatment group, the respective values were 180 (±5), 30 (±5), and 10 (±5) μSv/h. These data represent a 56.36% (±10) decrease in the radiation emitted per patient (Fig. 4).

Summary of dose rate emitted by patients after 18F-FDG injection. Arrows show decreased dose rate in treatment group when doses were administered according to BMI.
The average occupational exposure incurred by the staff from the control group was 1.0 (±0.7) μSv/h at the surface and 0.8 (±0.4) μSv/h at greater depths. Exposure from the treatment group was 0.91 (±0.4) μSv/h at the surface and 0.8 (±0.2) μSv/h at greater depths. These data represent an effective dose reduction of 12.5% at the surface and 3.61% at greater depths.
DISCUSSION
In time-of-flight technology, the faster the detectors are, the better is their ability to measure the difference in the arrival time of the two 511-keV γ rays coming from opposite directions, and thus the better is the estimated position of the positron annihilation along the path. This added position information enables the reconstruction algorithm to arrive at an image with fewer iterations and less image noise, improving contrast by up to 30% as compared with non–time-of-flight technology (3-dimensional row-action maximum-likelihood algorithm) and reducing PET acquisition time by at least 35%–40% after the same administered dose of 18F-FDG (16). It would be wise to ascertain whether it is possible to use this technology to reduce the doses administered to patients by increasing the time of image acquisition on the Gemini TF16, but all papers published by Philips on this matter involved measurements performed on National Electrical Manufacturers Association phantoms rather than on patients (16,17,19). However, relying on BMI-derived measurements, we decreased the 18F-FDG dose per patient as well as the time per bed position. Hence, the total PET/CT acquisition time was approximately 12–18 min in routine studies while not compromising—and better still, even improving—their diagnostic capability.
Regarding the use, handling, precautions, and injected dose of the 18F-FDG tracer, it was essential to follow the recommendations of the Spanish agency for medicines and medical devices, attached to the Ministry of Health, and the guidelines of national and international groups (Spanish Society of Nuclear Medicine, European Association of Nuclear Medicine, United Nations Scientific Committee on the Effects of Atomic Radiation, and International Commission on Radiological Protection) (12–13). In any case, the recommended minimum dose is 200 MBq per patient (360-MBq standard dose) depending on the patient’s body weight and the model of PET/CT scanner, and the dose can reach up to 800 MBq in cases of morbid obesity. Application criteria are different (7–8) in each service or country: some people always inject the same amount (360 MBq) regardless of weight, and others adjust to weight with the largest margins. We have been working with smaller margins; however, we have noted a considerable reduction in administered doses with this BMI-based management system. In our research, we have reduced these doses to 160–280 MBq of 18F-FDG for a whole-body PET/CT scan, including one for morbidly obese patients (Fig. 5). These doses represent an overall average dose reduction of between 20% and 50% (or even more) with the use of the smallest and largest margins, respectively.

Comparative curves of administered doses of 18F-FDG (MBq) related to BMI in control group (dashed line) and treatment group (□), as well as in theoretic control group (♦) in which highest margins were applied in compliance with international guidelines.
When we compared the scoring results by subgroup, we obtained the same image-quality results in underweight and morbidly obese patients but better results in normal-weight, overweight, and obese patients. The reflected equality in the underweight and morbidly obese subgroups is probably due to the smaller sample size (5 underweight patients and 3 morbidly obese patients). The higher number of images that were scored 1 for quality in the normal-weight, overweight, and obese subgroups allows us to infer that the BMI method works better than the body weight–derived method. Future research may indicate that the BMI method should be set as the standard for whole-body 18F-FDG PET/CT scans. There were no statistically significant differences in interobserver coincidence between the readings by the 2 evaluators. The treatment group was clearly rated better than the control group.
According to the guidelines of the World Health Organization (20) and the National Institute of Sanitary Management (21), our patient sample was representative of the actual Spanish population: despite the Mediterranean diet, an estimated 16% of Spanish adults are obese and 50% are overweight. A recent publication using an age-adjusted Poisson regression model demonstrated that the prevalence of morbid obesity in Spain is increasing and had reached 6.1 per thousand at the last time it was determined, in 2010 (22).
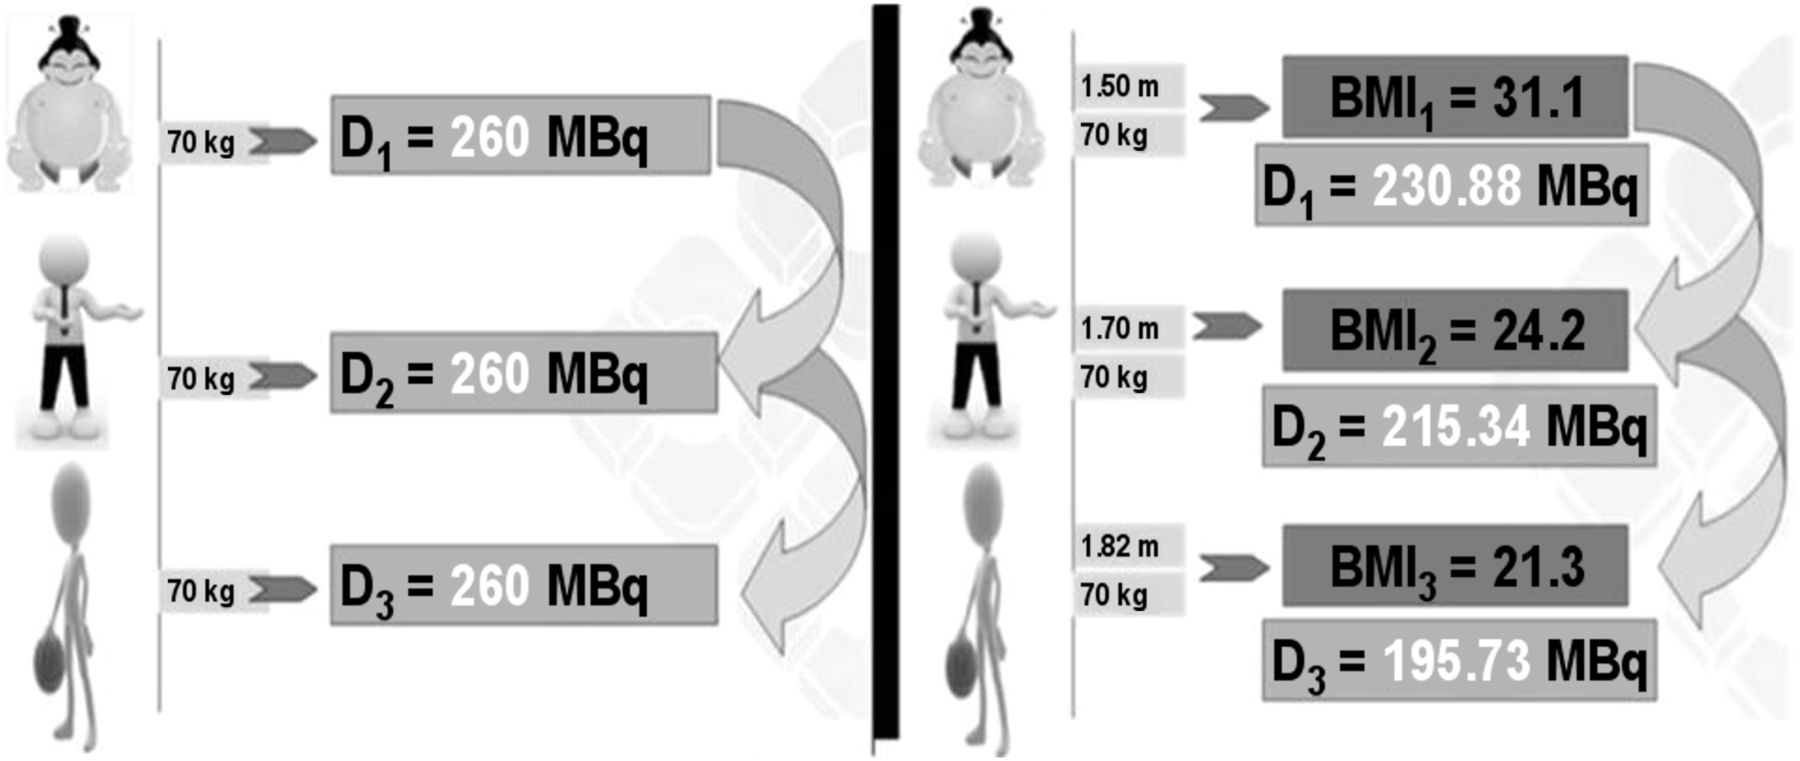
Concerning the standard dose of 360 MBq, at a rate of 5.5–7.4 MBq/kg, a 1.70-m, 70-kg patient would require a 260-MBq dose of 18F-FDG, but the same dose would also be used in a 1.82-m, 70-kg patient. If we instead use the BMI method for these 2 patients, at a rate of 6.9–11.1 MBq/BMI, only a 215.3-MBq dose would be necessary for the first patient and only 195.7 MBq for the second. This would allow us to inject another patient with similar characteristics in both cases, maintaining the same uptake period before PET/CT acquisition (Fig. 6). On a typical day, we have 2 patients requiring a 370-MBq dose of 18F-FDG for whole-body PET/CT, 3 or 4 patients requiring 740 MBq, 5 patients requiring 1,110 MBq, and up to 6 or 7 patients requiring 1,480 MBq. To optimize the 18F-FDG dose injections, it would be necessary to group the patients in a particular way—according to their BMI. The reduction of radiation dose to patients and staff would be significant, and economic savings would also result. Therefore, we have been using this dose adjustment method in our department since June 2011, with excellent results.

(Left) 18F-FDG doses administered to 3 patients with same weight according to current international guidelines. (Right) 18F-FDG doses adjusted on the basis of BMI (Table 1).
There may be other elements that could help us adjust the patient’s dose even further, such as the age of patient or the patient’s specific condition (e.g., the type and stage of cancer, the last administered treatment, and the blood creatinine level), but this possibility has not yet been investigated in depth (23–25).
CONCLUSION
Minimizing the radiation exposure of patients is a desirable goal. We must safeguard patients from receiving unnecessarily high doses of radiation in 18F-FDG whole-body PET/CT studies, while maintaining or even improving diagnostic quality. Our study has shown that such a goal is achievable when BMI is used as the limiting factor for dose adjustment. This method leads to significant reductions in radiation dose, not only for patients (56.4% reduction, by administered dose) but also for the PET staff who prepare the radiopharmaceutical doses and perform the studies (12.5% reduction at the surface and 3.6% at greater depths, according to whole-body dosimetry), as well as probable economic savings. BMI has become an important tool in 18F-FDG whole-body PET/CT studies in our department and could become so in all departments where implemented.
DISCLOSURE
No potential conflict of interest relevant to this article was reported.
Acknowledgments
We thank the ERESA Medical Group for allowing us to use its facilities and equipment to perform this research and for believing in our project.
Footnotes
Published online Feb. 6, 2014.
REFERENCES
- Received for publication August 8, 2013.
- Accepted for publication November 27, 2013.


Jump to section
Related Articles
Cited By...
- No citing articles found.