


Abstract
Our purpose was to compare the performance of an initial ventilation–perfusion (V/Q) scan protocol with that of a data-driven modified protocol to improve diagnostic quality without increasing radiation dose to the patient. Methods: The initial V/Q scan protocol consisted of a ventilation scan after inhalation of 99mTc-diethylenetriaminepentaacetic acid (DTPA) aerosol for 5 min followed by a 99mTc-macroaggregated albumin perfusion scan. Interim analysis after 34 scans under an initial protocol included calculations of ventilation efficiency, perfusion efficiency, and perfusion-to-ventilation counting rate ratio (Q:V). Ventilation efficiency was defined as ventilation counting rate divided by ventilation dose, perfusion efficiency as perfusion counting rate divided by perfusion dose, and Q:V as perfusion counting rate divided by ventilation counting rate. From these data, the protocol was modified to improve the Q:V ratio and was applied to 60 patients. Results from the 94 scans were tabulated, and a comparison of ventilation efficiency, perfusion efficiency, and Q:V between the 2 protocols was statistically analyzed. Results: The initial protocol returned a mean ventilation efficiency of 7.8% (SD, 4.6%; range, 1.4%–19%), mean perfusion efficiency of 100% (SD, 31%; range, 39%–160%), and mean Q:V of 2.4 (SD, 1.9; range, 0.51–9.0). All 3 parameters displayed a wide range. Fifty-four percent of these cases demonstrated an unacceptable Q:V (≤2) indicating that the perfusion dose did not overwhelm the ventilation dose. To improve Q:V, options included decreasing ventilation dose, increasing perfusion dose, or performing the ventilation scan with a much higher dose after the perfusion scan. To minimize radiation, the protocol was modified to decrease the ventilation from 5 min to 2.5 min. The modified protocol yielded a mean ventilation efficiency of 5.1% (SD, 1.8; range, 2.0–11), mean perfusion efficiency of 120% (SD, 27%; range, 65%–170%), and mean Q:V of 3.6 (SD, 1.7; range, 1.2–12). Differences between protocols were statistically significant for ventilation efficiency, perfusion efficiency, and Q:V (P < 0.02). Less than 8% of cases under the modified protocol exhibited an unacceptable Q:V. Conclusion: The initial V/Q scan protocol was successfully modified to improve image quality with less radiation. By decreasing the ventilation time by half, the percentage of studies with an unacceptable Q:V decreased from 54% to 8%. This analysis may help others to optimize their V/Q protocols.
Ventilation-perfusion (V/Q) lung scanning has been a popular diagnostic test for evaluation of pulmonary embolus (PE) for almost 40 y. However, with the advent of multislice CT scanners, the V/Q scan has been partially replaced by CT angiography (CTA) of the thorax for diagnosing PE. The high sensitivity, specificity, speed, and availability of CTA has increasingly made it the noninvasive diagnostic test of choice for PE despite its drawbacks such as high radiation exposure and use of iodinated intravenous contrast material (1,2).
The V/Q scan still has many benefits compared with CT and thus remains an important diagnostic tool for evaluation of PE. For patients with contraindications to iodinated intravenous contrast material such as a history of reaction or impaired renal function, the V/Q scan may be a better alternative to CTA to diagnose PE. The V/Q scan also typically exposes patients to less radiation than CTA of the thorax (3,4).
The objective of this study was to modify our existing V/Q scan protocol to optimize image quality and lower radiation exposure for the patients. We focused on a method of optimization that is practical and can be performed by any nuclear medicine laboratory. With the proposed method, we were able to improve image quality by increasing perfusion-to-ventilation signal ratio while lowering radiation exposure to the patients.
We use the intravenous injection of 99mTc linked to macroaggregated albumin for the perfusion phase of the V/Q scan. For the ventilation phase, we use inhaled 99mTc-diethylenetriaminepentaacetic acid (DTPA) aerosol. We had used 133Xe in the past, but our patient population poorly tolerated xenon gas technique, resulting in numerous nondiagnostic ventilation scans.
Because both ventilation and perfusion phases use the same radioisotope, we aim for a perfusion counting rate that is at least double the ventilation counting rate. This overwhelming of the ventilation count by the perfusion count provides the contrast critical to the diagnostic accuracy of a V/Q scan.
Technologists play an important role in creating this contrast between the 2 phases. Technologists routinely make adjustments to ventilation time, ventilation dose, and perfusion dose to ensure the relative overwhelming of counting rate by the latter phase. This case-by-case adjustment is necessary because the amount of radioisotope that deposits in each patient’s airways during the ventilation phase depends on many variables and patient factors such as ventilation time, ventilation effort, ventilation capacity, and fraction of radioisotope that deposits distal to central airways. Dosing for the perfusion phase is more straightforward. Technologists may make small dose changes based on body size, but other than a few unusual exceptions such as significant residual in the syringe or infiltration of the intravenous access, the entire dose of the injected radioisotope is deposited in the pulmonary capillaries.
Because of the unpredictable patient factors in the ventilation phase, we perform ventilation scans before perfusion scans. If patients must ventilate to triple the counting rate of the perfusion phase, patients with pulmonary morbidities may have great difficulty inhaling enough aerosol to achieve such a ratio. Additionally, patients can also deposit a large amount of aerosol in the central airways and thus provide a false impression that the counting rate in the lung parenchyma is truly tripled. There is software available to exclude the central airways from the ventilation counting rate, but in typical practice this is impractical. Therefore, performing the ventilation scan after the perfusion scan has the disadvantage of more radiation, longer examination time, and potentially suboptimal quality. Performing the perfusion phase first does have one clear advantage: if the perfusion scan has normal results, the ventilation scan does not need to be conducted.
MATERIALS AND METHODS
Original Protocol
We first needed to understand the case-by-case adjustments done by the technologists before we could optimize our V/Q scan protocol. We surveyed the technologists regarding their techniques for administering radioisotope. We found that technologists’ subjective assessments of the patients’ ventilation capacities played a main role in aerosol dose adjustment. Availability of 99mTc-DTPA also played a role, especially at the end of the day. Generally, for the average patient a dose of 1.48 GBq of 99mTc-DTPA would be loaded into the machine, and the patient would be ventilated for 5 min.
We sought to standardize the protocol. After a discussion with our technologists, a standard time of 5 min for the ventilation phase was agreed on for the initial trial. Given the reality of very infirm patients having limited ventilation capacity, we agreed that technologists could still adjust the dose loaded into the aerosol machine according to their subjective assessment. With this initial standardized protocol with a 5-min ventilation time, 34 consecutive V/Q scans were performed. There were no inclusion or exclusion criteria. Scans were not selected with any bias. Patients were instructed to breathe 99mTc-DTPA aerosol for 5 min. The ventilation-phase scan was then acquired. This was followed by perfusion of 99mTc-macroaggregated albumin followed by the perfusion-phase scan.
Modified Protocol
On the basis of an analysis of the first 34 scans, the protocol was modified by decreasing ventilation time from 5 min to 2.5 min without making any further changes. The second group of scans (n = 60) was acquired consecutively using the modified protocol. Results from both groups (n = 94) were tabulated and statistically compared.
Ventilation and Perfusion Efficiencies
Because an adjustable ventilation and perfusion dose was our standard of care, we had to calculate ventilation efficiency and perfusion efficiency in order to compensate for the subjective dose adjustments made by our technologists. Ventilation efficiency was calculated as a ratio of ventilation counting rate divided by dose loaded into the aerosol machine. Perfusion efficiency was calculated as a ratio of perfusion counting rate divided by 99mTc dose given via the patient’s intravenous line.
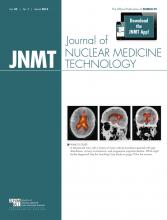
Perfusion efficiency was then compared with the perfusion dose to assess the ability of the technologists to gauge the patient’s body size (Fig. 1A). Ventilation efficiency was compared with the ventilation dose to assess the ability of the technologists to gauge the patients’ breathing (Fig. 1B).

Varying perfusion (A) or ventilation (B) dose did not result in predictable change in either perfusion efficiency or ventilation efficiency, respectively. perf = perfusion; vent = ventilation.
The 2 graphs in Figure 1 demonstrate wide variation in perfusion and ventilation efficiency and lack of correlation between loaded or injected dose and its corresponding efficiencies. The lack of correlation indicates that modification of loaded or injected dose does not lead to a predictable change in perfusion or ventilation efficiency and thus cannot be used to optimize perfusion-to-ventilation (Q:V) ratio. This left us with ventilation time as the remaining variable we can modify to optimize Q:V ratio.
Q:V
Q:V is the key indicator that reflects the degree of contrast between the 2 phases. Alarmingly, 54% of the 34 cases under the initial unmodified protocol had an unacceptably low Q:V (≤2) (Fig. 2).
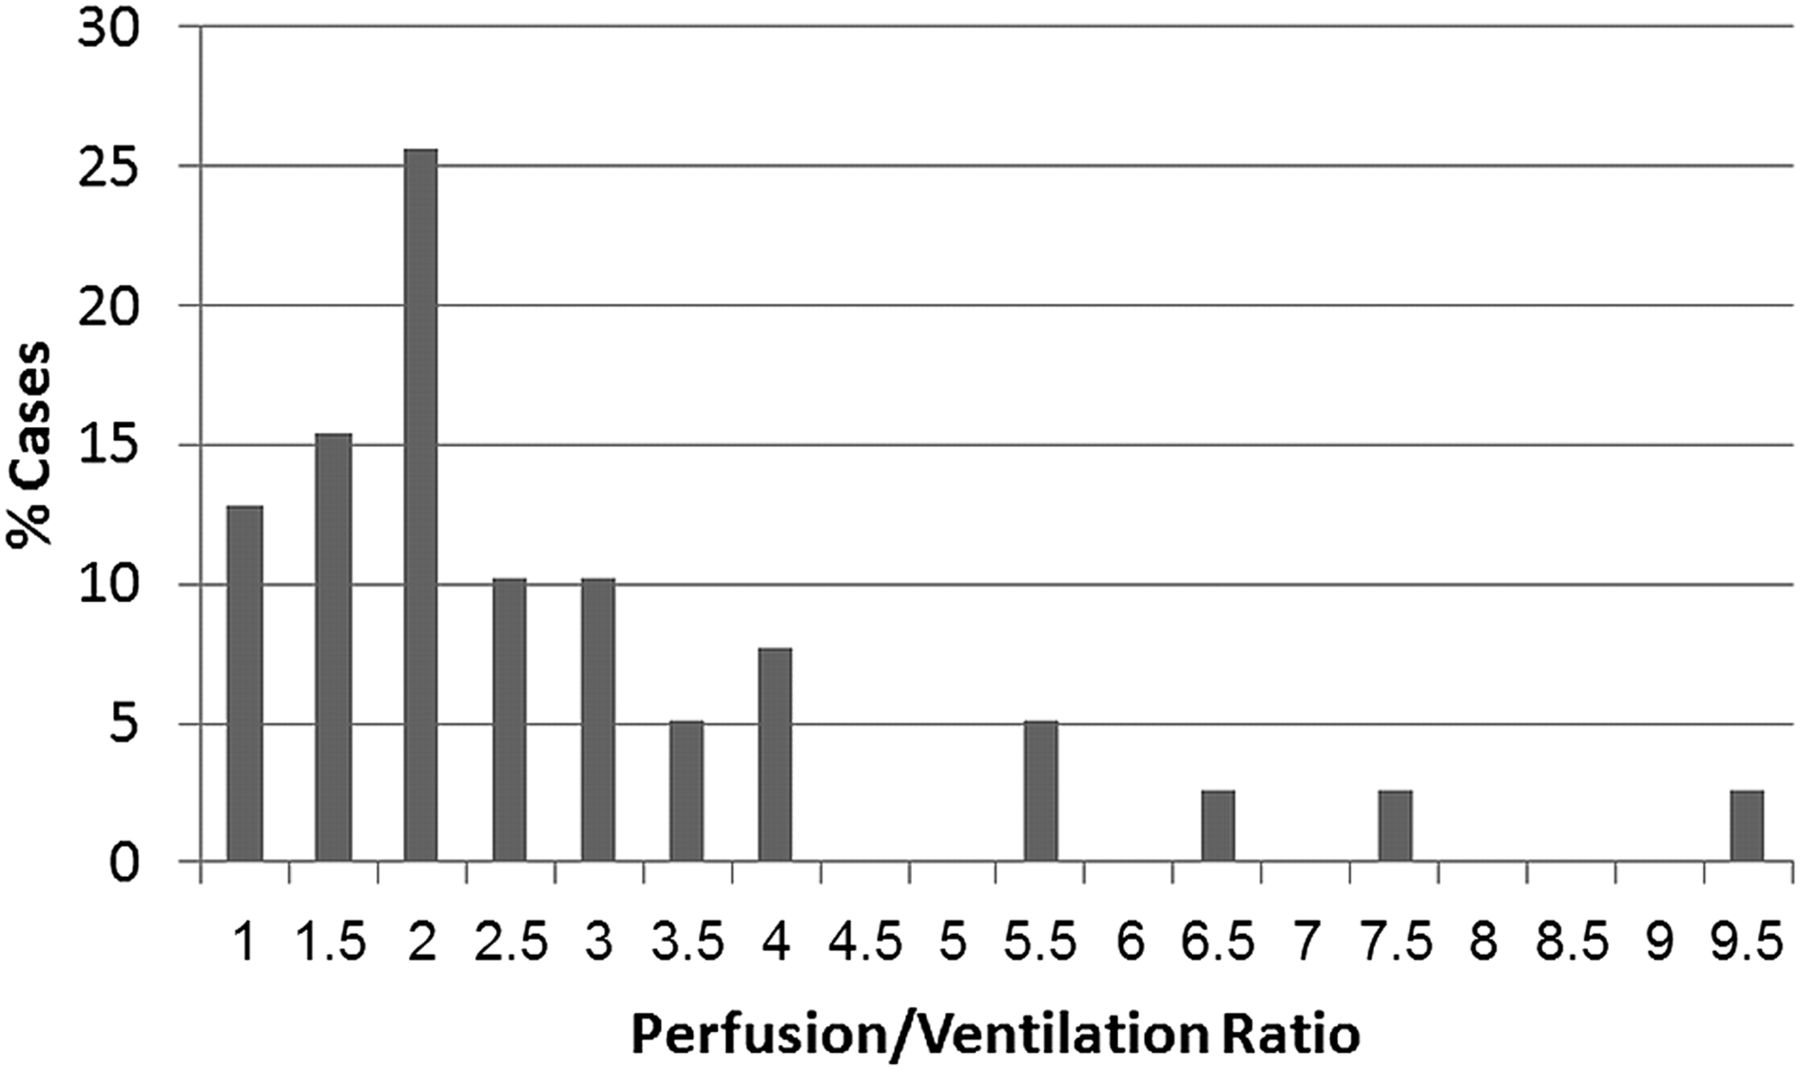
Distribution of cases (%) at 5 min of ventilation time with given Q:V. Graph shows that both median and mean Q:V are less than 2, which is unacceptably low.
Modification options to increase Q:V included increasing perfusion dose, lowering ventilation dose, and lowering ventilation time. We did not increase perfusion dose or decrease ventilation dose because previous analysis with perfusion and ventilation efficiency showed that changes in given doses do not correlate with a predictable change in efficiency and, thus, cannot be used to optimize Q:V ratio (Fig. 1). We also were already at the upper end of the recommended perfusion dose range and did not want to increase radiation exposure.
The remaining variable we could use to increase Q:V ratio was ventilation time. We decreased ventilation time from 5 min to 2.5 min for the second group in a bid to increase Q:V ratio reliably at a decreased radiation exposure to the patients and decreased examination time.
RESULTS
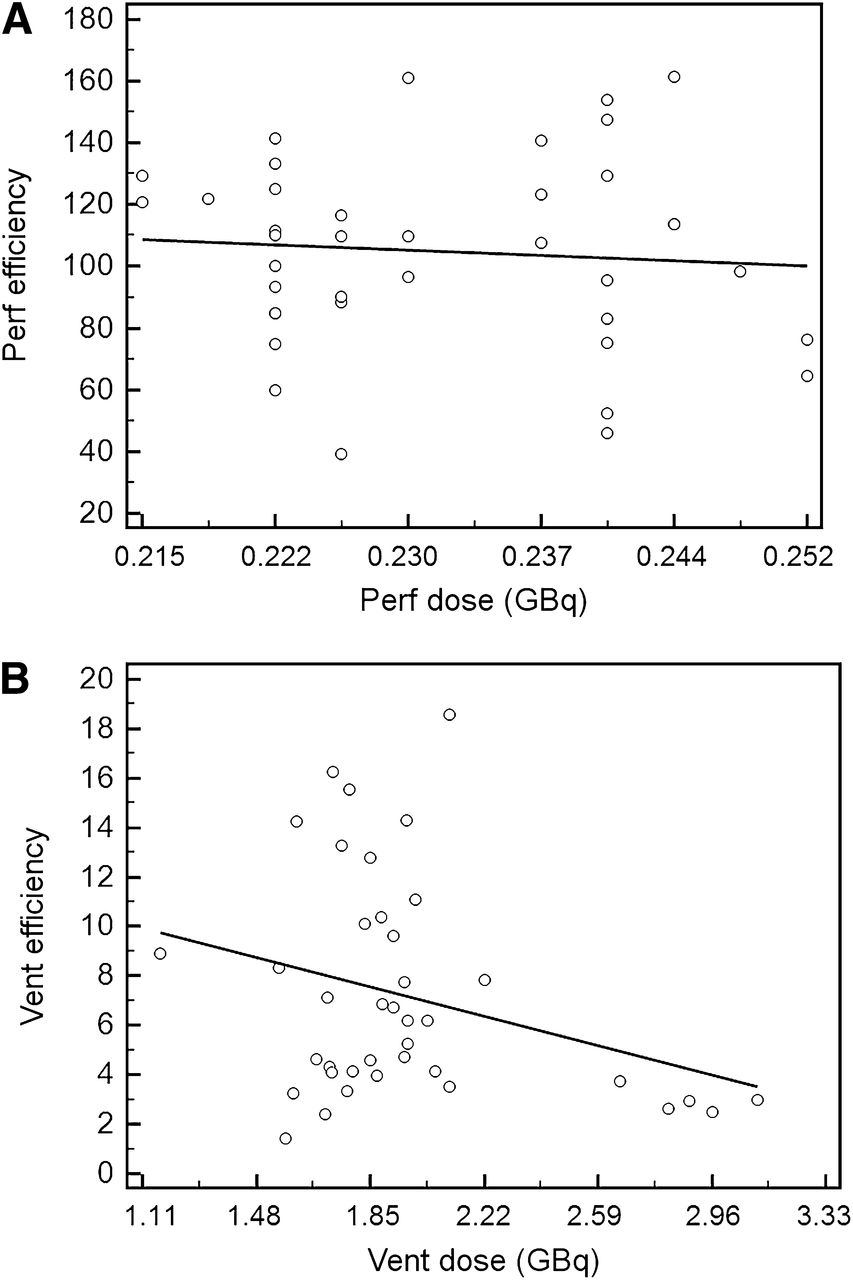
The first group consisted of 34 consecutive scans after 5 min of ventilation time, and the second group consisted of 60 consecutive scans after 2.5 min of ventilation time. Mean ventilation efficiency at 5 min was 7.82% (SD, 4.56%; range, 1.41%–18.60%; median, 6.79%). Mean ventilation efficiency at 2.5 min was 5.11% (SD, 1.79%; range, 1.97%–10.51%; median, 4.95%). When tested with an unpaired t test, the difference was statistically significant (t = 4.158, P < 0.0001) (Fig. 3). Figure 3 demonstrates that ventilation time can be decreased to decrease ventilation efficiency predictably and to optimize Q:V ratio.

Ventilation dose and perfusion dose efficiencies at 5 min and 2.5 min.
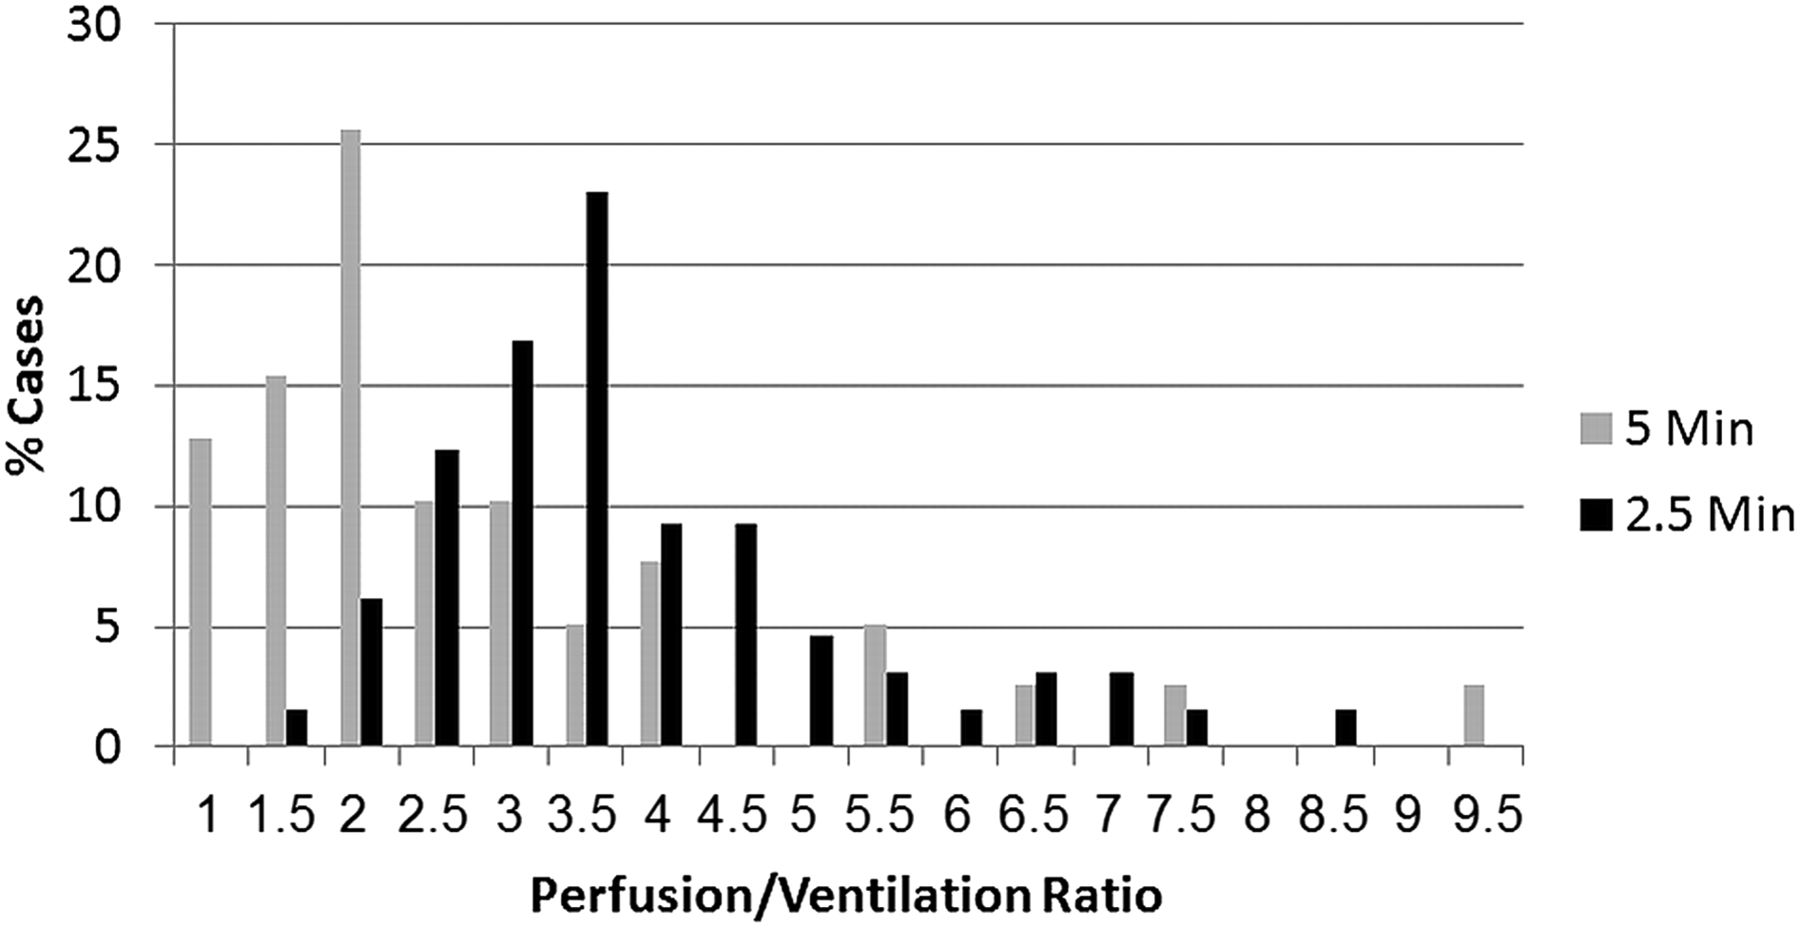
We then compared Q:V ratio at 5 and 2.5 min of ventilation time. The average Q:V after 5 min of ventilation time was 2.39 (SD, 1.90; range, 0.51–9.0; median, 1.70); and the average Q:V after 2.5 min of ventilation time was 3.56 (SD, 1.70; range, 1.15–11.50; median, 3.12) (Fig. 4). When tested with an unpaired t test, this increase in Q:V ratio with decreased ventilation time was statistically significant (t = 3.085, P = 0.0027). Additionally, after 2.5 min of ventilation time, the percentage of cases with an unacceptable Q:V (<2) also decreased to less than 8%, down from 54% (Fig. 4).

Distribution of cases (%) with given Q:V ratio.
DISCUSSION
The genesis of this study was in the reading room. The nuclear medicine physician noted V/Q scans in which the perfusion scan appeared scarcely different from the ventilation scan. This raised the concern that the dose of 99mTc-macroaggregated albumin was not adequately overcoming the 99mTc-DTPA aerosol dose administered first. This concern was also quantitatively proven: 54% of the 34 cases using the initial protocol had an unacceptable Q:V (Fig. 2).
This finding was alarming because the V/Q scan loses its utility when the Q:V ratio is low. Relatively high background ventilation counts compared with perfusion counts may obscure perfusion anomalies. Hypothetically, a perfusion defect may appear smaller or not at all and therefore incorrectly assign a lower probability to a V/Q scan. For example, if a V/Q scan had a single mismatched perfusion defect that was actually moderate in size but appeared small because of high background ventilation counts, the probability would be erroneously changed from intermediate to low. This change in probability could affect patient management for anticoagulation or placement of an inferior vena cava filter.
When deciding how to change the protocol, we considered the multiple ways to increase the Q:V ratio. In addition to decreasing ventilation time, possible modifications included increasing the perfusion dose, decreasing the ventilation dose, or performing the ventilation scan after the perfusion scan. Our analysis showed that increasing perfusion dose or decreasing ventilation dose would not predictably change the perfusion efficiency or ventilation efficiency, respectively, and thus would not reliably improve Q:V ratio. Increasing perfusion dose would expose the patients to more radiation as well. Decreasing ventilation time was the remaining choice. Decreased ventilation time was sufficient to decrease ventilation efficiency for a given ventilation dose (Fig. 3A) and increase Q:V ratio (Fig. 4), besides having the advantage of decreasing radiation exposure.
Another option would have been to switch to 133Xe gas for ventilation. Our institution used 133Xe many years ago but then switched to 99mTc-DTPA aerosol. The technologists found that our patient population tolerated the aerosol study better, leading to fewer nondiagnostic ventilation scans with aerosol.
There are alternatives to CTA other than the V/Q scan to diagnose PE. For patients with contrast allergies, pulmonary MR angiography is becoming a viable alternative despite its high cost, the usual MR contraindications, cardiac motion artifacts, relatively slow speed, and limited availability (5–7). V/Q SPECT may also become a promising alternative to diagnose PE in people who are allergic to intravenous contrast material.
CONCLUSION
The proposed data-driven analysis and optimization of V/Q scans can readily be performed. Nuclear medicine laboratories should consider quantitatively evaluating their Q:V ratio using perfusion and ventilation counting rates. If one is using 99mTc-DTPA aerosol and performing a perfusion scan after a ventilation scan, we have found that decreasing the ventilation time is a viable way to optimize Q:V ratio while decreasing radiation exposure to patients. Decreasing ventilation time improved mean Q:V ratio from 2.4 to 3.6 (P < 0.02) and increased the percentage of V/Q scans with an unacceptable Q:V from 46% to 92%. Optimized Q:V may increase our chance of visualizing perfusion defects and may lead to higher diagnostic accuracy. Further study may be warranted to determine whether optimization of Q:V ratio translates to improved accuracy in the detection of PE.
DISCLOSURE
No potential conflict of interest relevant to this article was reported.
Footnotes
Published online Jan. 30, 2014.
REFERENCES
- Received for publication July 13, 2013.
- Accepted for publication December 2, 2013.


