

FIGURE 12.


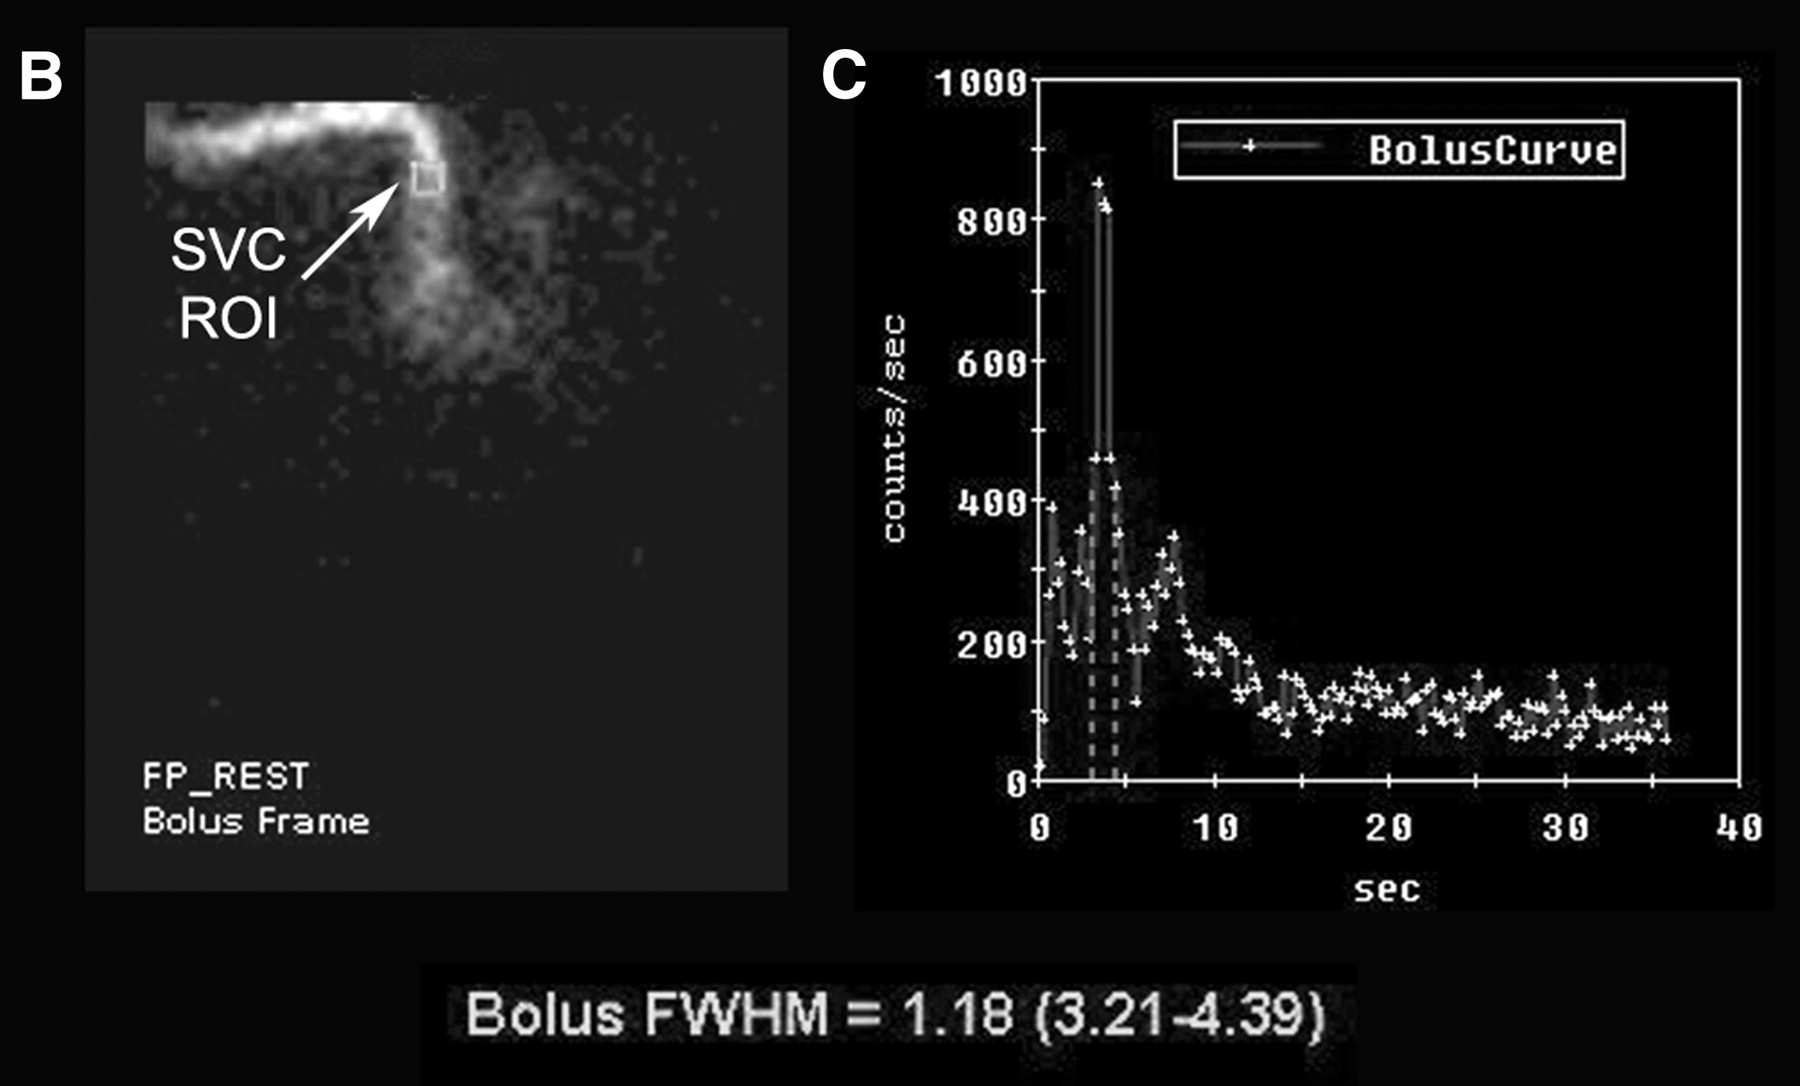
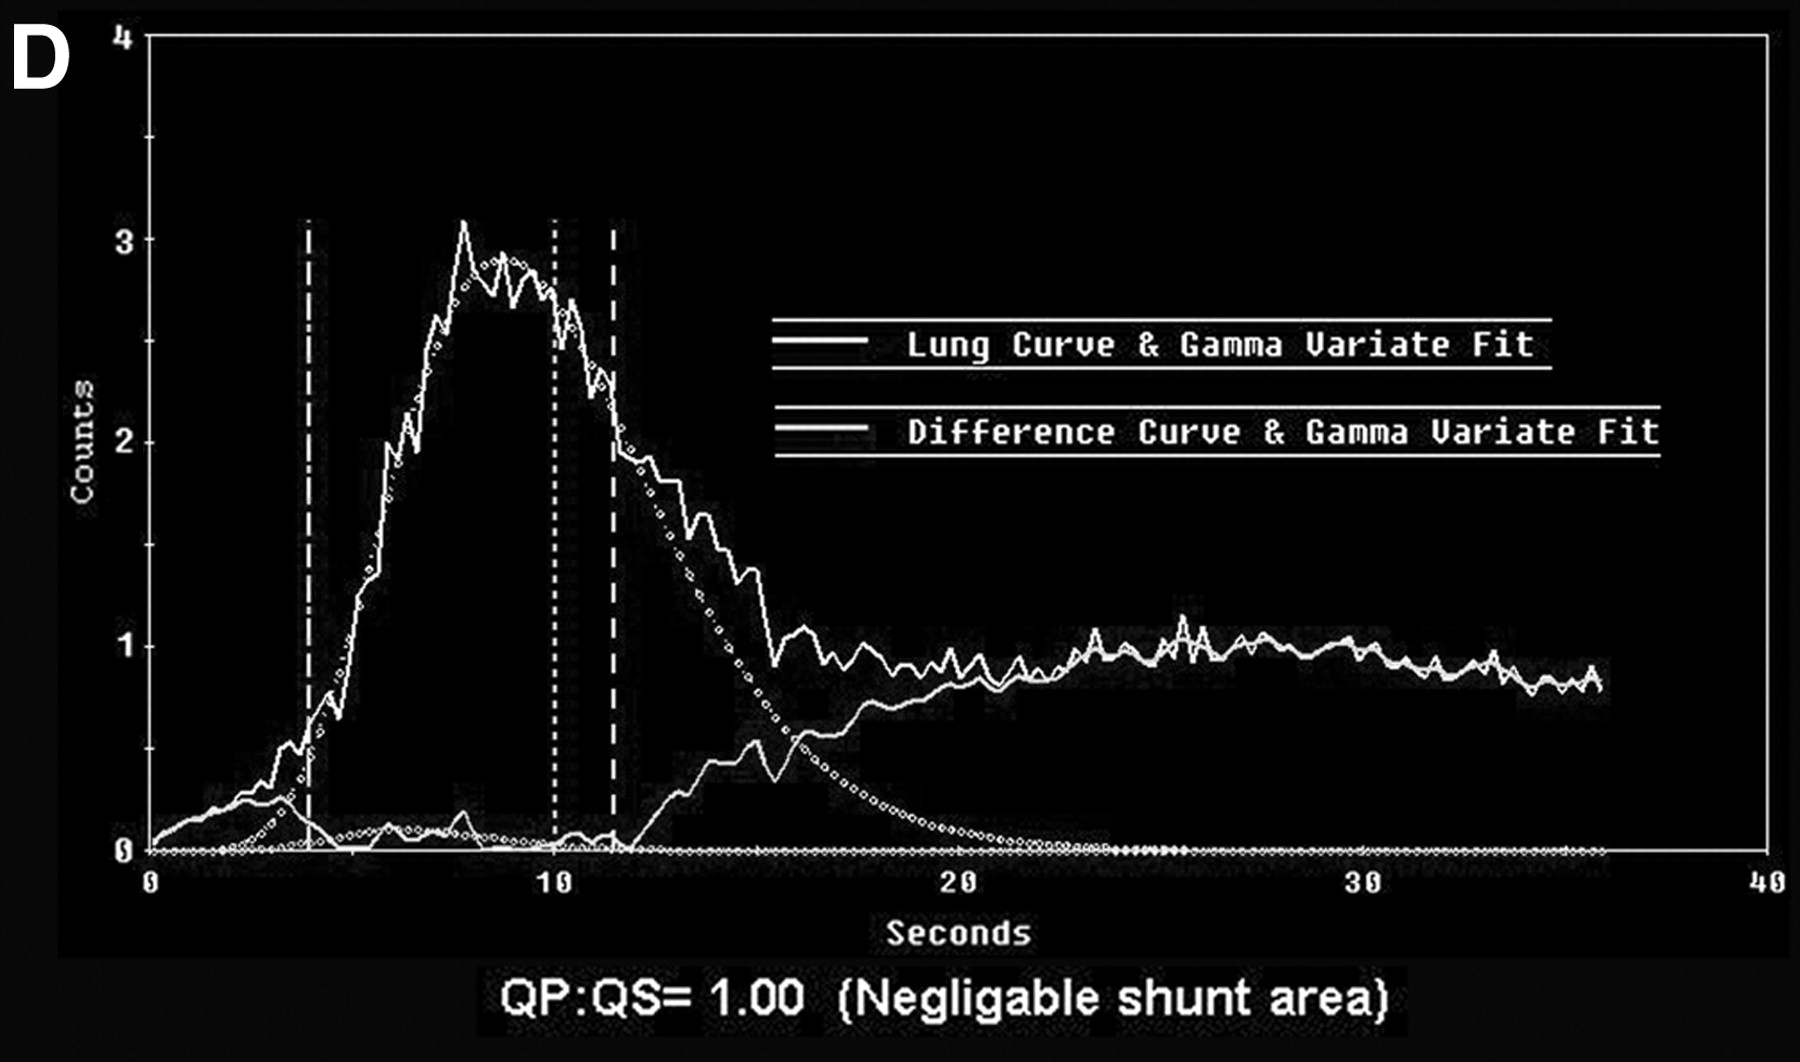
Normal first-pass L-R shunt study in same patient as in Figure 11. (A) Dynamic images demonstrate sequential arrival of activity in SVC, right side of heart, pulmonary arteries, lungs, pulmonary veins, and left side of heart. (B) Assessment of adequacy of bolus. ROI has been placed over SVC (square), allowing input activity to be plotted (C). FWHM is 1.18, indicating good tight bolus has been attained. (D) Time–activity curve over lungs. Total activity is demonstrated by solid line. γ-variate analysis has separated out lung curve (broken curve). Difference (curve) between total activity curve and lung curve is consistent with recirculation after first pass through body. There is no additional curve early after lung curve to suggest premature recirculation from L-R shunt. This is reflected in analysis, which indicates normal Qp/Qs of 1.00. Consequently VSD is currently not physiologically significant.


