


Article Figures & Data
Figures
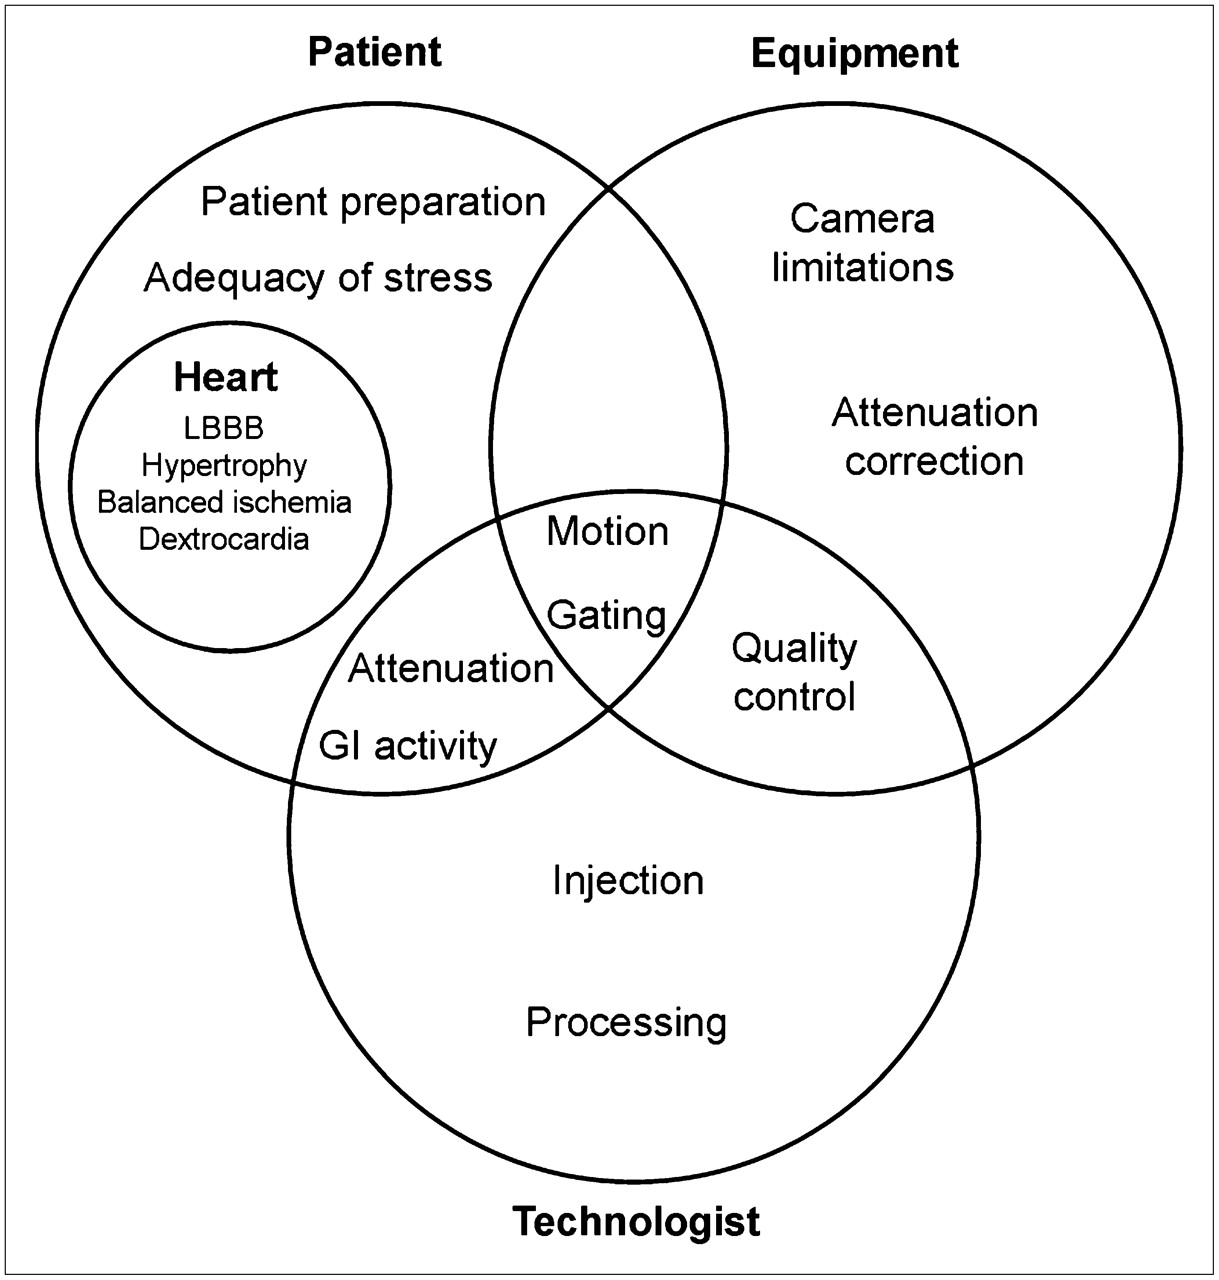
- FIGURE 1.
Causes of, and potential corrections for, MPI artifacts and pitfalls may be related to the patient, the equipment, or the technologist, often with overlap among these categories. LBBB = left bundle branch block; GI = gastrointestinal.
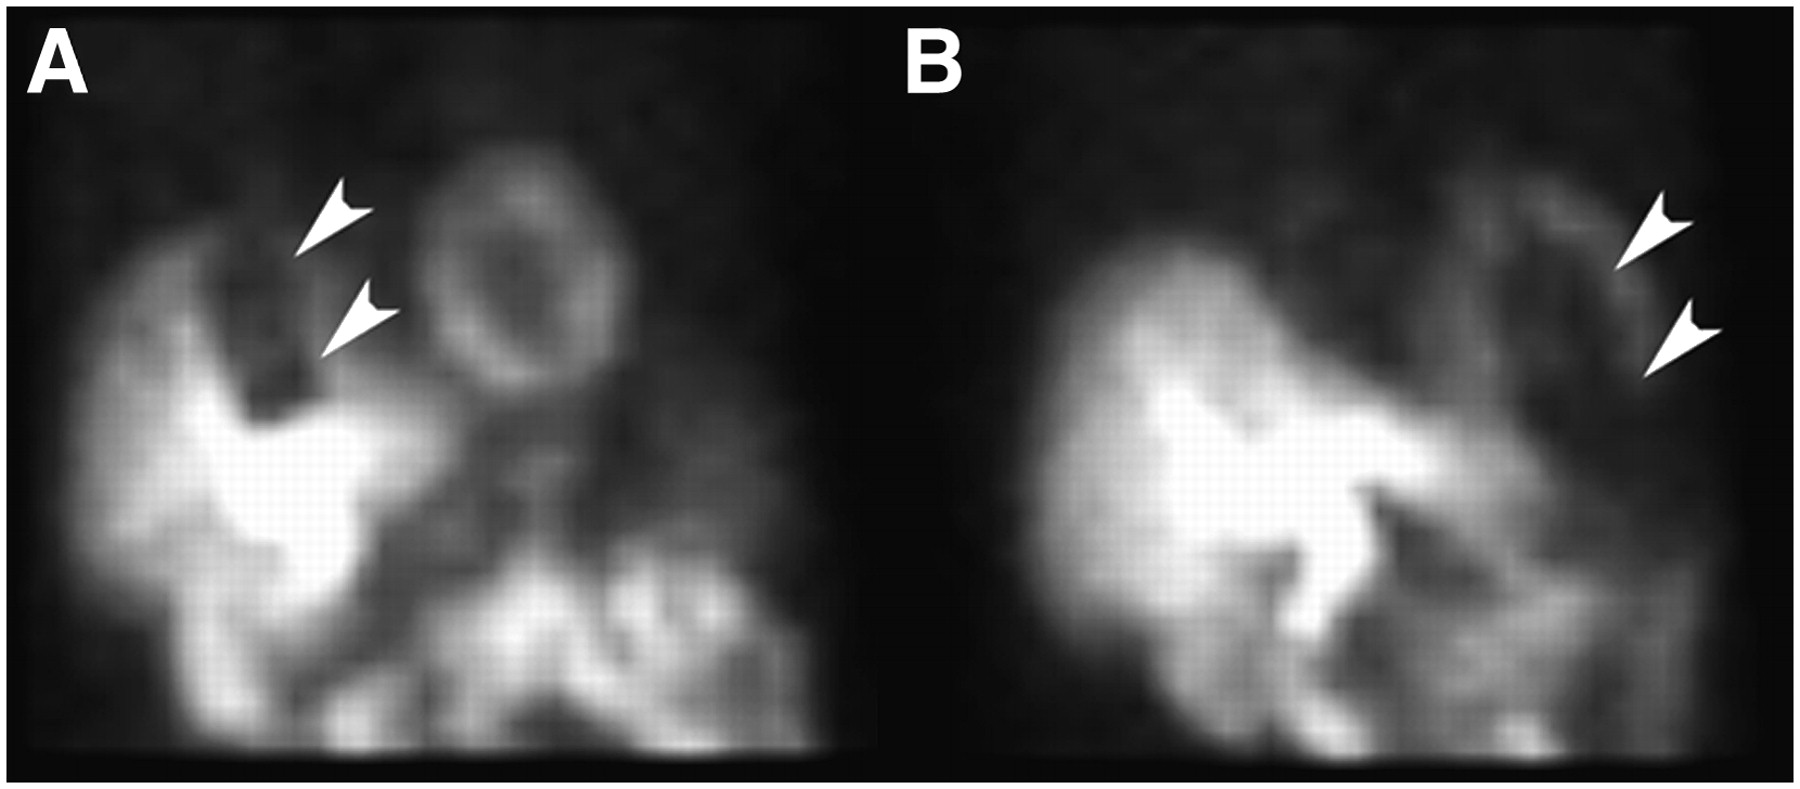
- FIGURE 2.
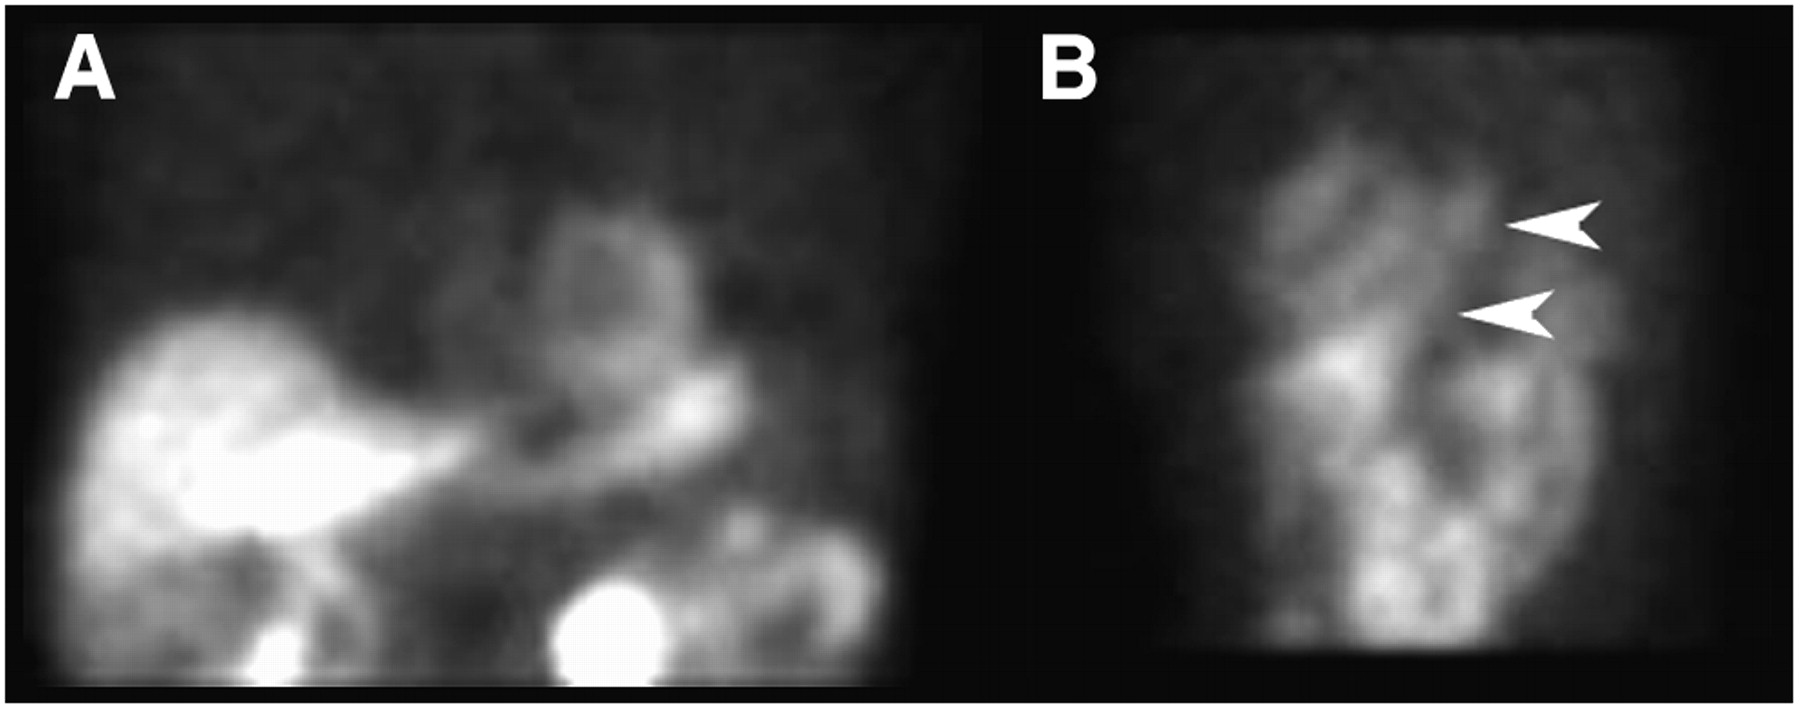
(A and B) Two different views from raw data of a MPI study reveal focal attenuation (arrowheads) from an unrecognized telemetry monitor on the patient's chest.
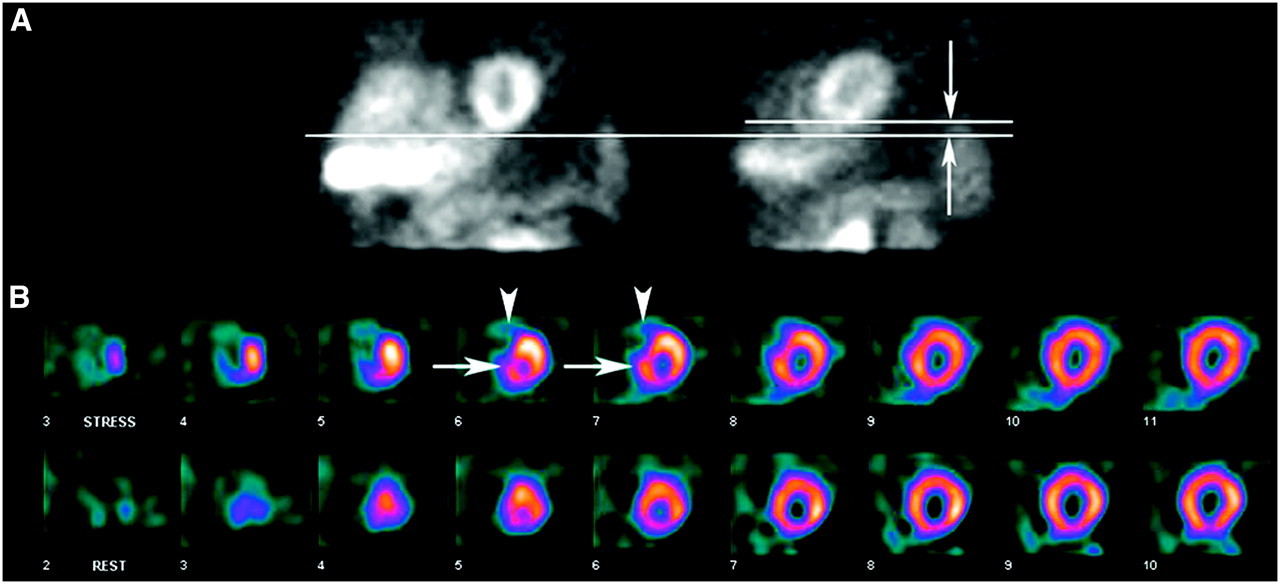
- FIGURE 3.
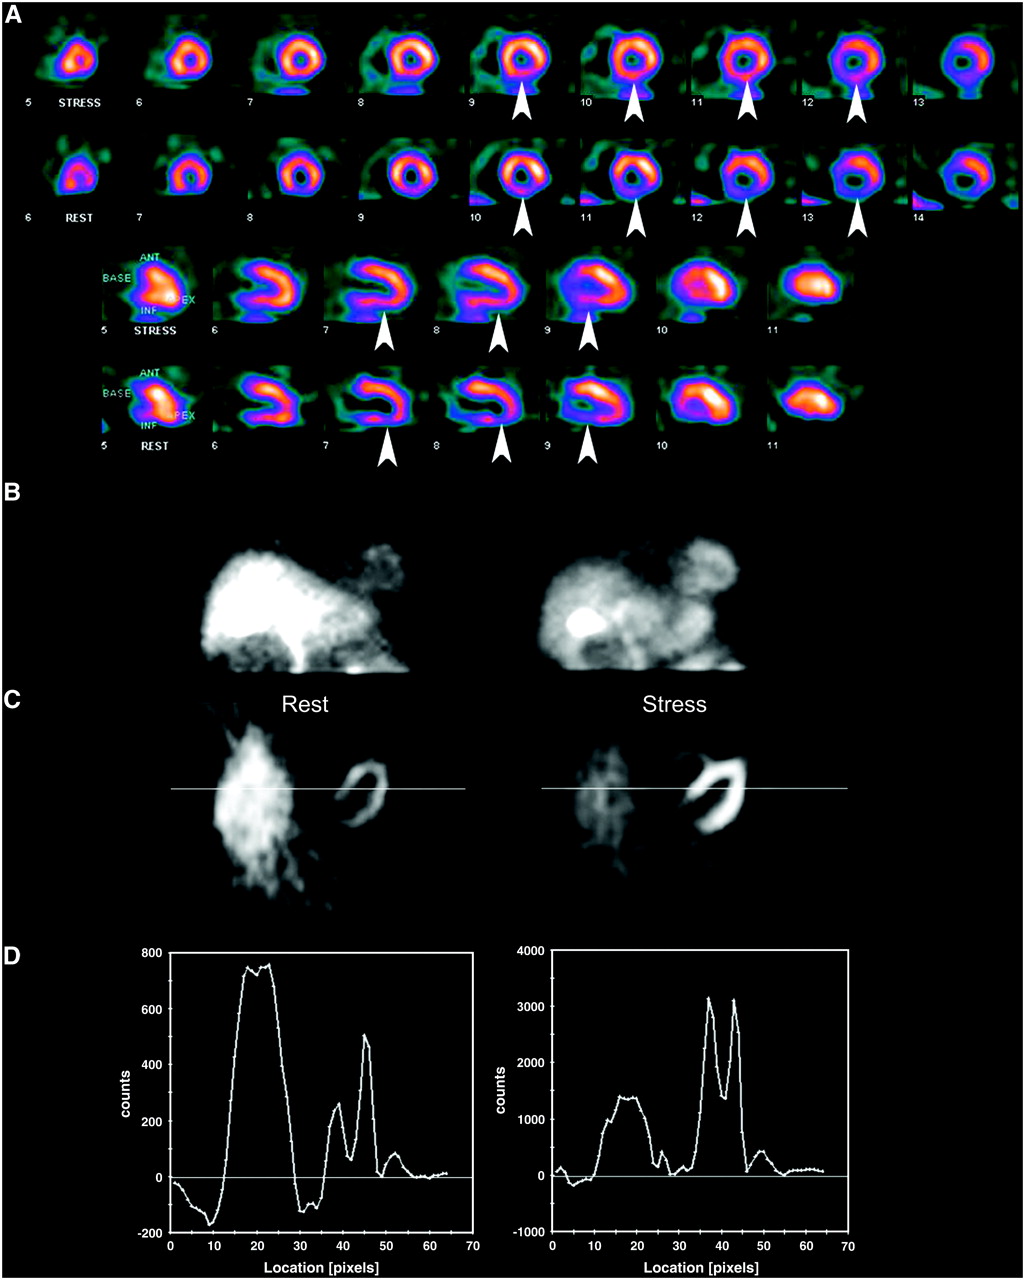
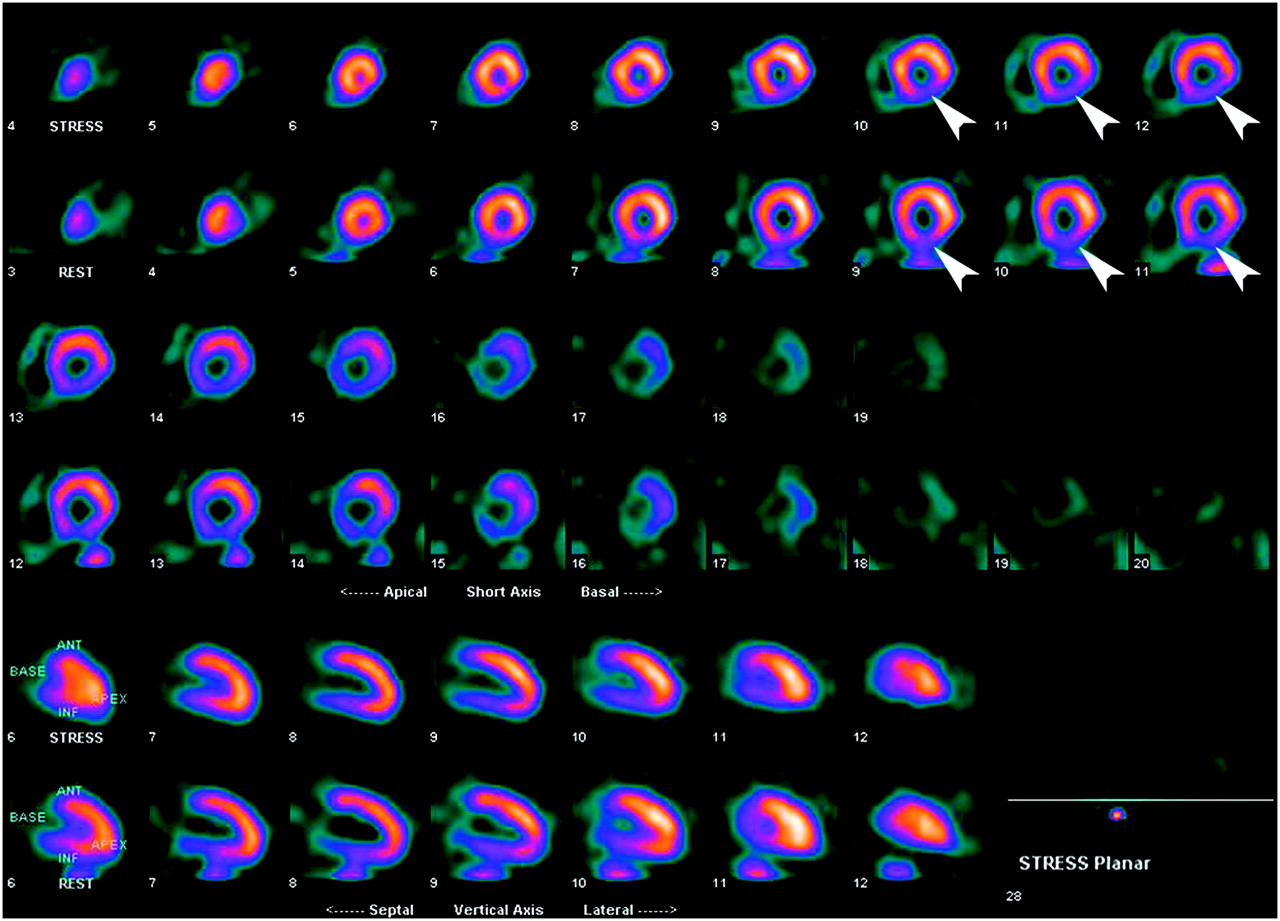
(A) Raw data images from same-day rest and stress images demonstrate low counts in stress image, similar to low-dose rest image, resulting from an infiltrated injection during stress study. Raw data from a repeat-stress study (right panel) on the following day demonstrate expected better counts from high-dose stress study. (B) Static image of injection site in right arm confirms infiltrated injection. (C) Short-axis views from infiltrated stress study (top row) and repeat-stress study (bottom row). Repeat-stress study demonstrates a stress-induced defect in anteroseptum (arrowheads) not present on the study with infiltrated injection.
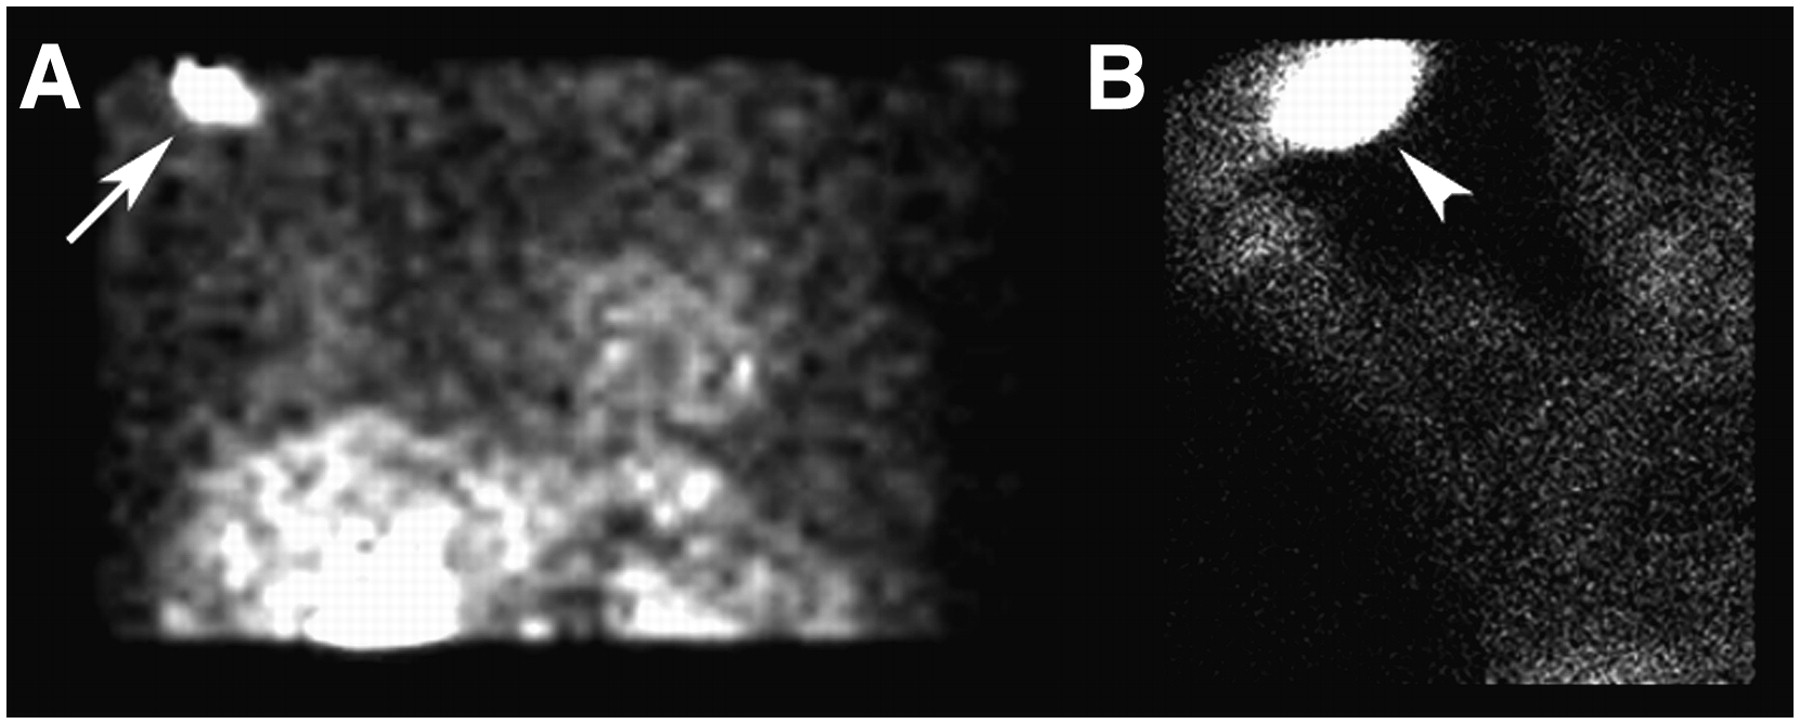
- FIGURE 4.
(A) Anterior frame from MPI raw data reveals a focus of intense uptake in the right axilla (arrow) that could be mistaken for metastatic lymph node involvement. (B) Static image of the injection site confirms an interstitial injection (arrowhead), which has resulted in lymphatic uptake of the radiopharmaceutical and deposition in axillary nodes.
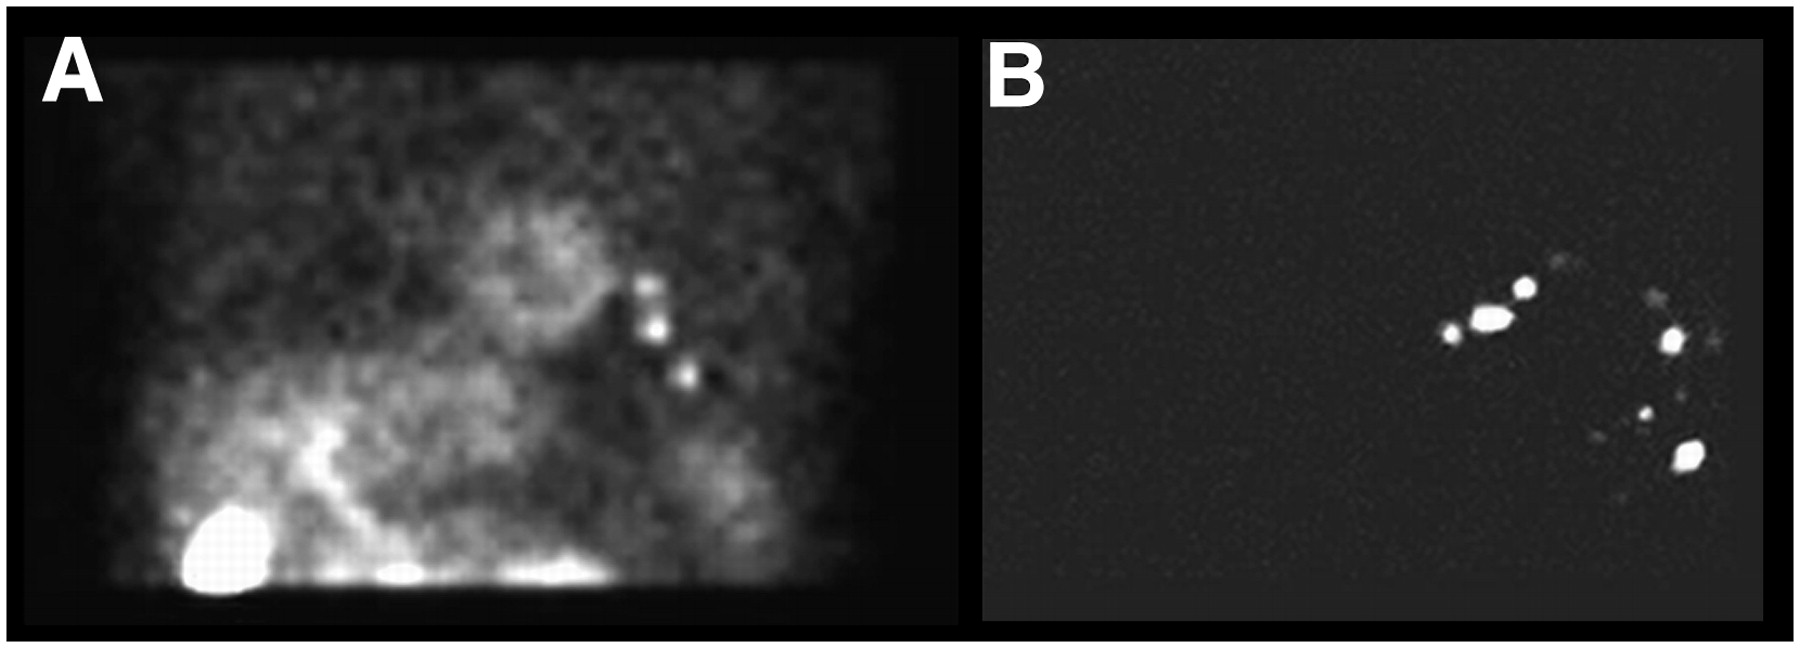
- FIGURE 5.
(A) Raw data frame demonstrates 3 foci of activity projecting over the thorax on the left, which could be mistaken for a neoplastic process. (B) Static image of the patient's shirt confirms contamination, responsible for the activity on raw data images.
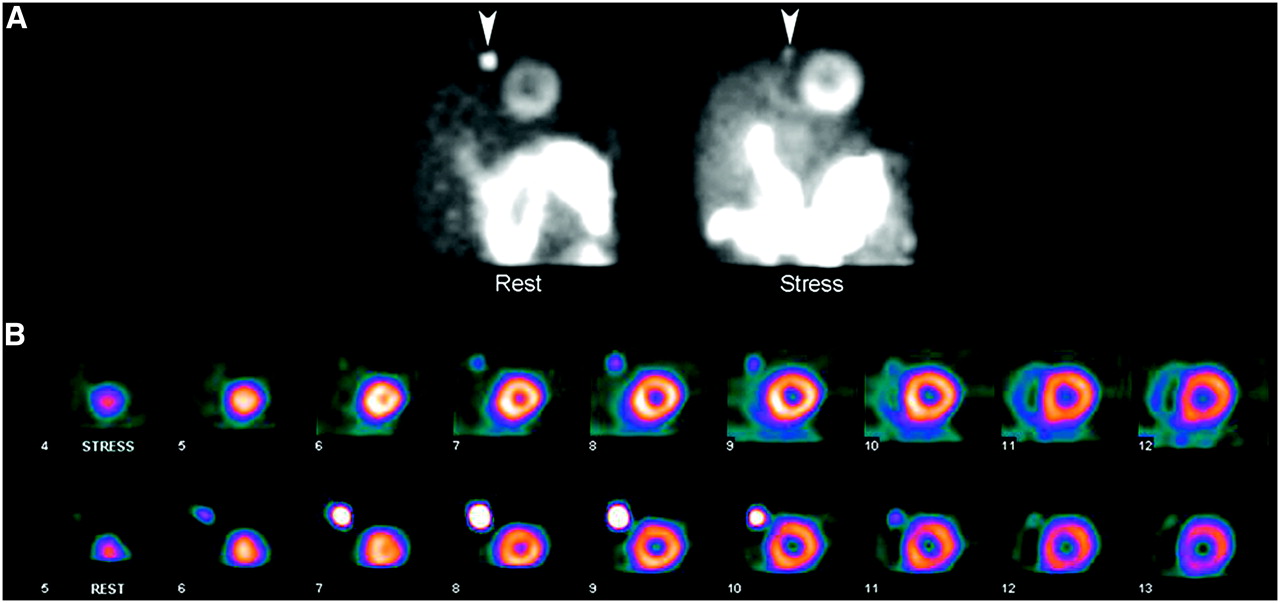
- FIGURE 6.
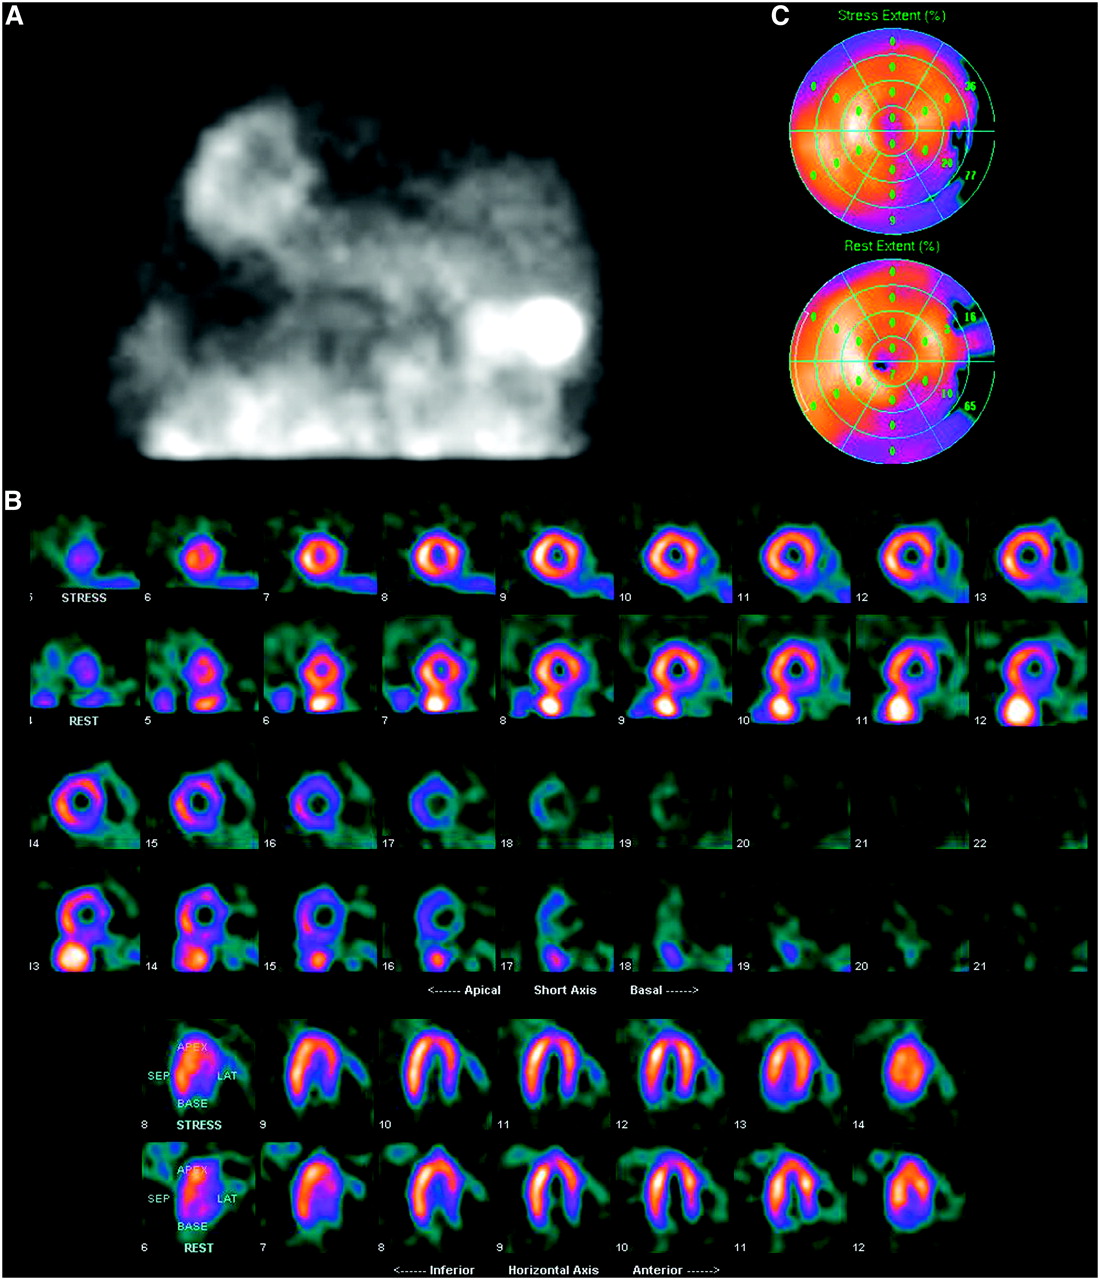
(A) Raw data images demonstrate a focus of uptake adjacent to the heart (arrowheads) resulting from retention of radiopharmaceutical within the patient's chest port, more intense on rest images. (B) Short-axis perfusion images reveal intense focal chest port activity, which could conceivably compromise evaluation of perfusion in adjacent LV.
- FIGURE 7.
(A) Two frames from MPI raw data demonstrate offset of the LV between frames, indicative of patient motion. (B) Resultant perfusion images demonstrate a defect in apical septum and slight relative offset of lateral and septal aspects of the LV (arrows), along with a “tail” of activity extending from the LV (arrowheads), as a result of the patient motion.
- FIGURE 8.
Raw data image demonstrates flickering artifact (numerous scattered bright pixels), indicative of a gating problem.
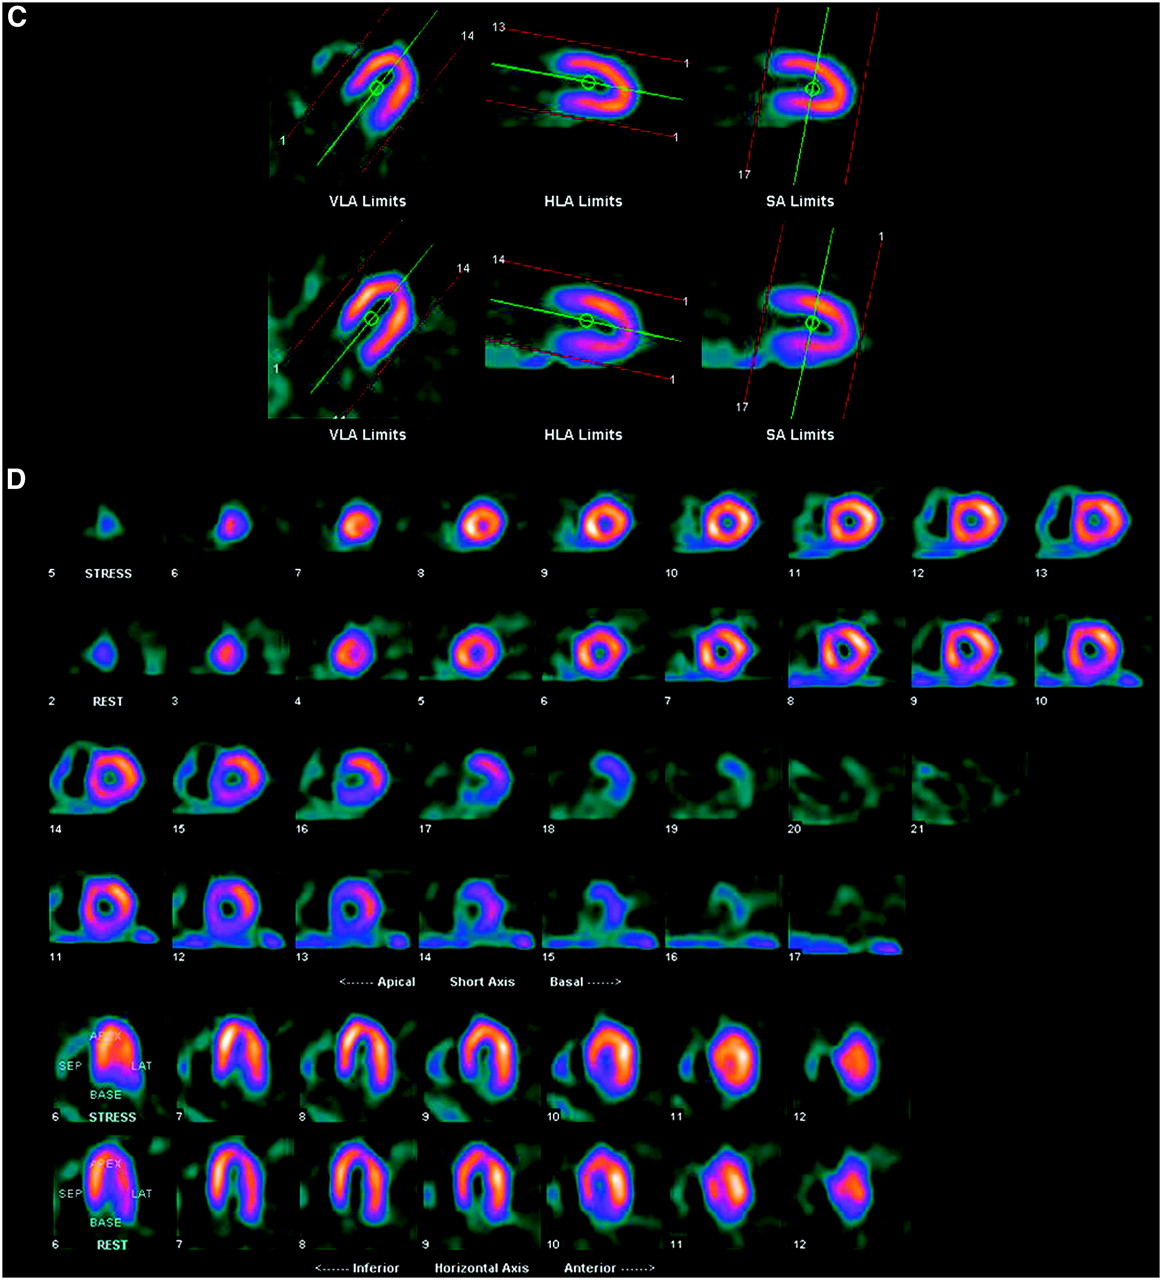
- FIGURE 9.
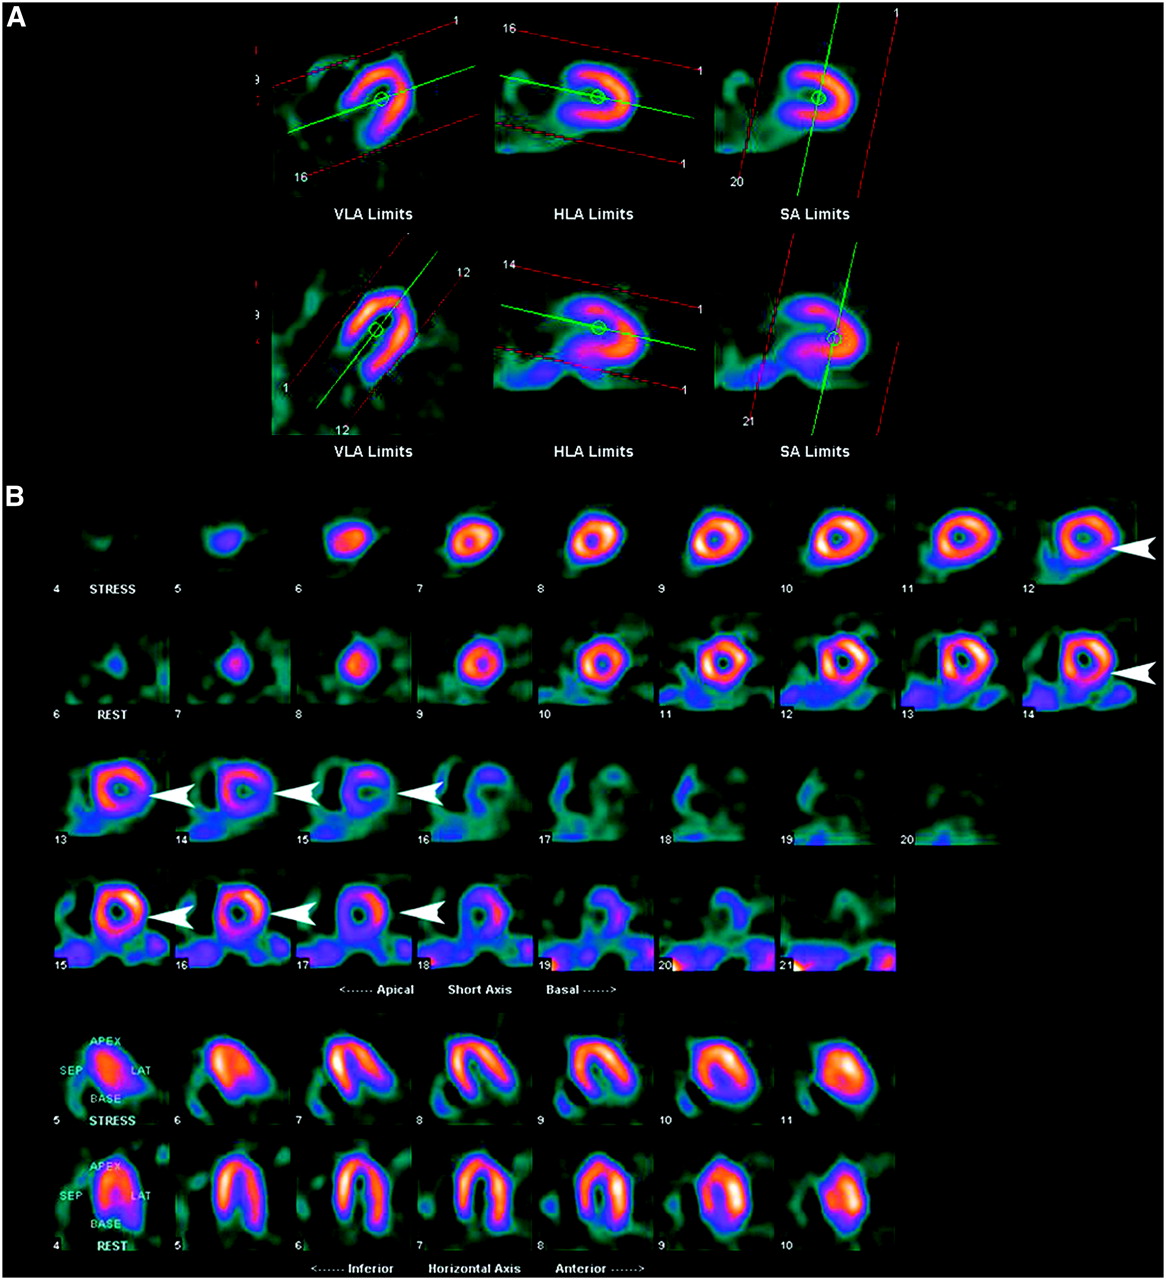
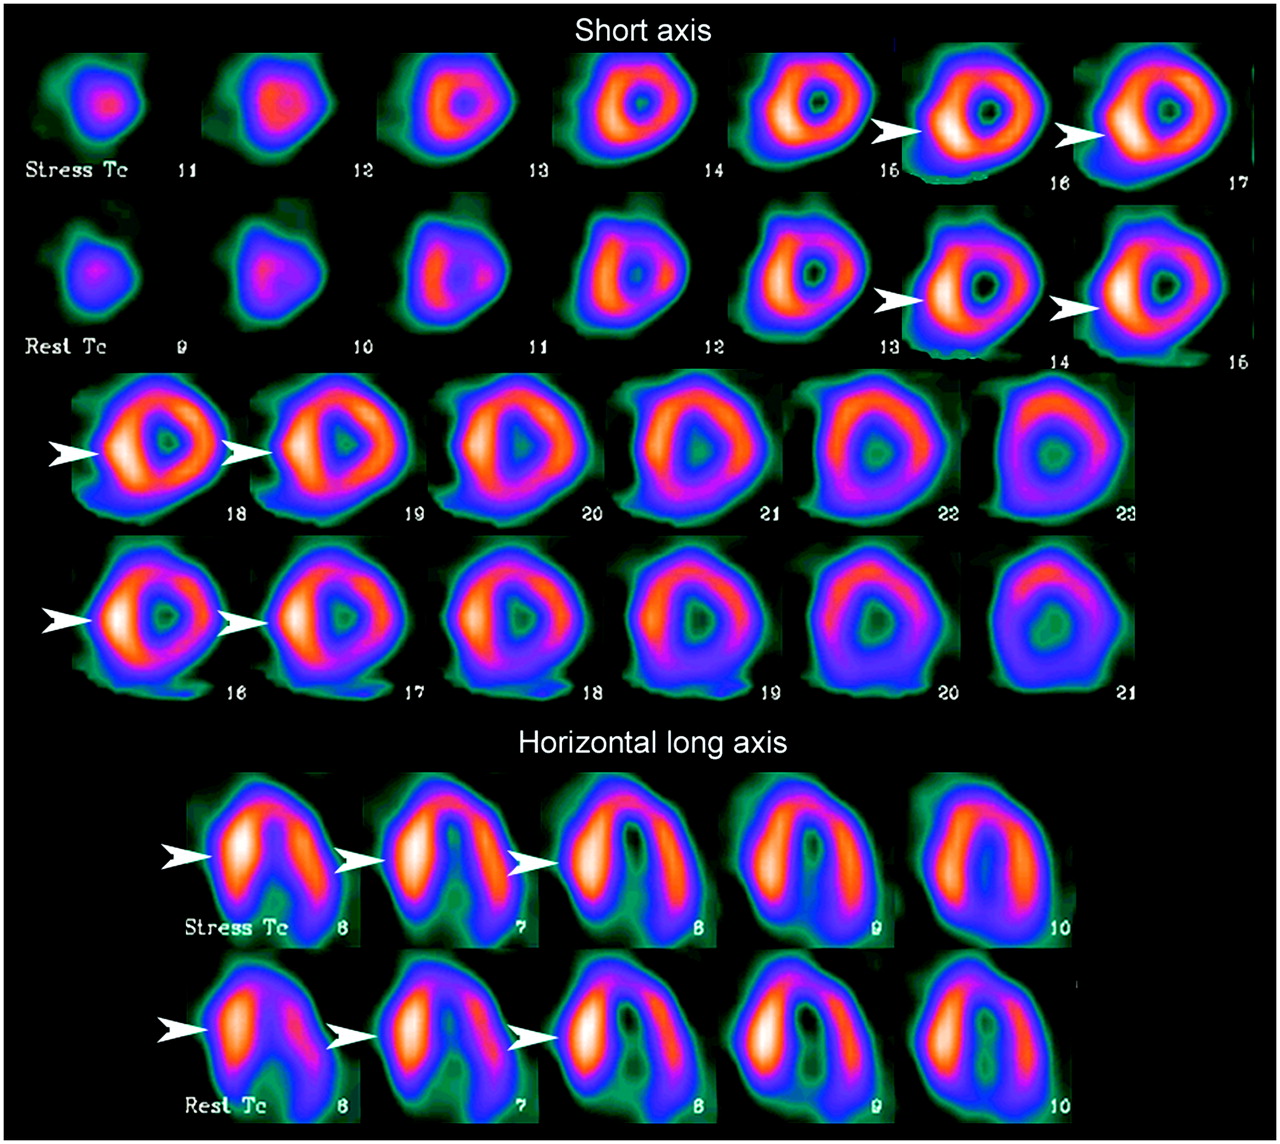
(A) Processing images demonstrate incorrect axis alignment in the horizontal long-axis (HLA) plane on the stress study. Proper alignment is present on the rest study. (B) Incorrect alignment results in an artifactual reversible defect in lateral wall on perfusion images (arrowheads). (C and D) Processing images (C) and perfusion images (D) from the same study, now with proper axis selection. Artifactual defect is no longer present. VLA = vertical long-axis; SA = short-axis.
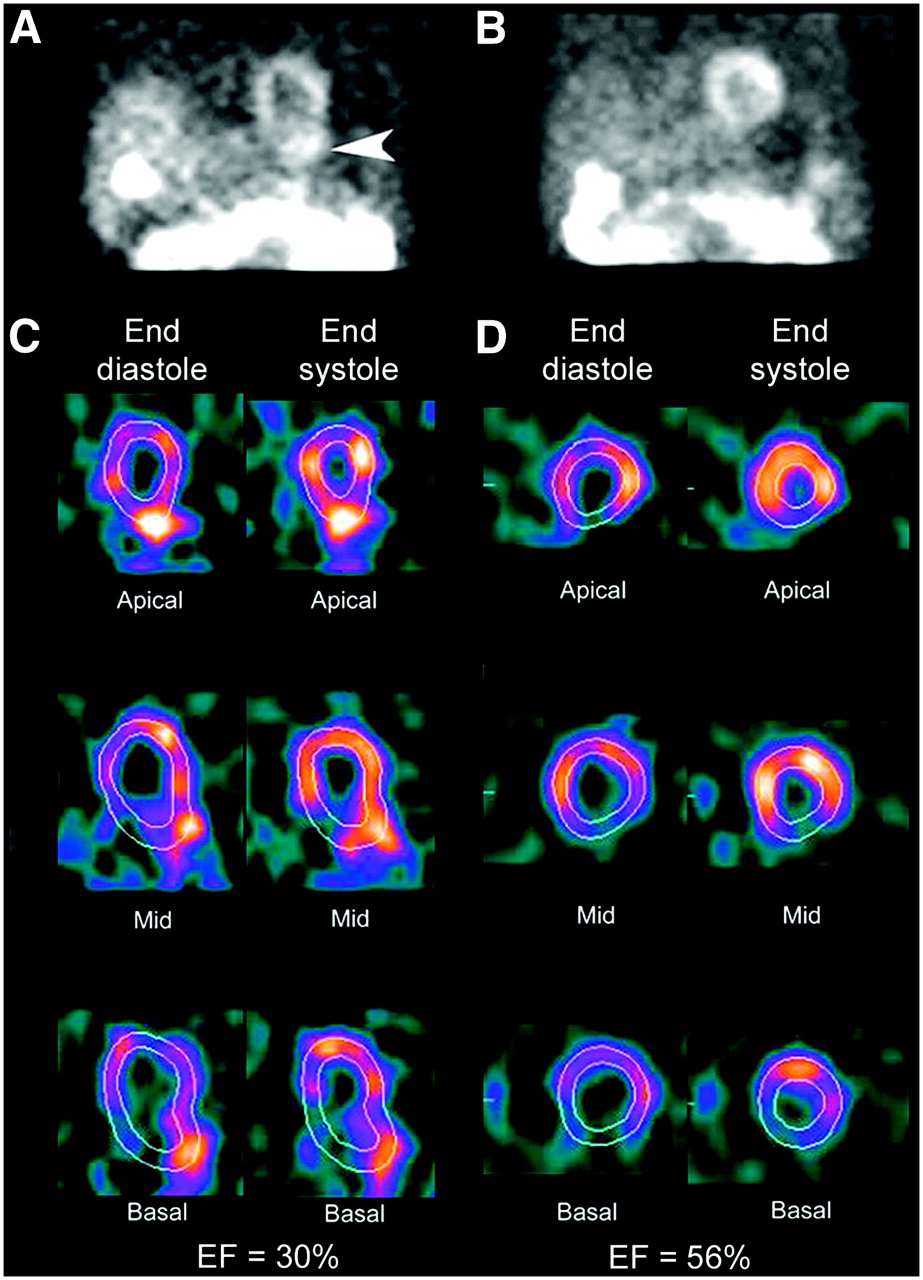
- FIGURE 10.
(A) Raw data frame from rest MPI study demonstrates prominent activity in stomach adjacent to LV inferior wall (arrowhead). (B) Raw data from delayed study after gastric activity had cleared. (C) Three short-axis views (apical, midventricle, and basal) during end diastole and end systole from gated study in A demonstrate the inability of the program to track LV wall motion as a result of intense gastric activity. This results in an erroneously low LVEF of 30%. (D) Corresponding views from gated study in B demonstrate proper tracking of LV wall motion and correct calculation of EF at 56%.
- FIGURE 11.
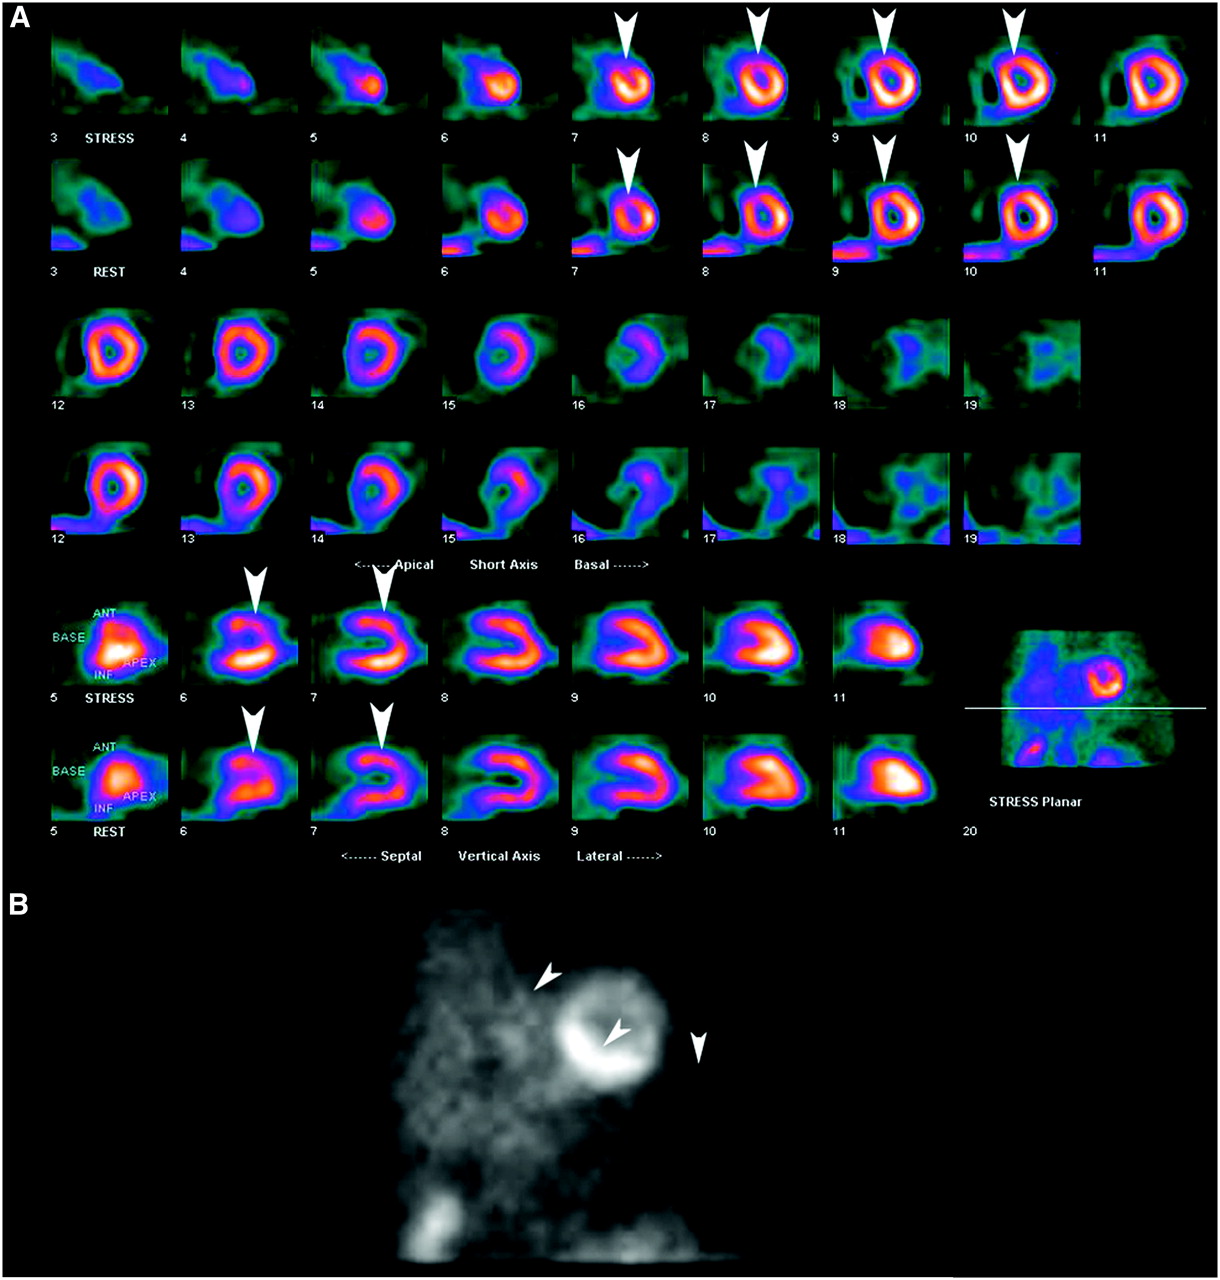
(A) Myocardial perfusion scan reveals a fixed defect in the anterior wall (arrowheads). (B) Frame from raw data demonstrates marked attenuation by left breast (arrowheads), which is causing the apparent perfusion defect.
- FIGURE 12.
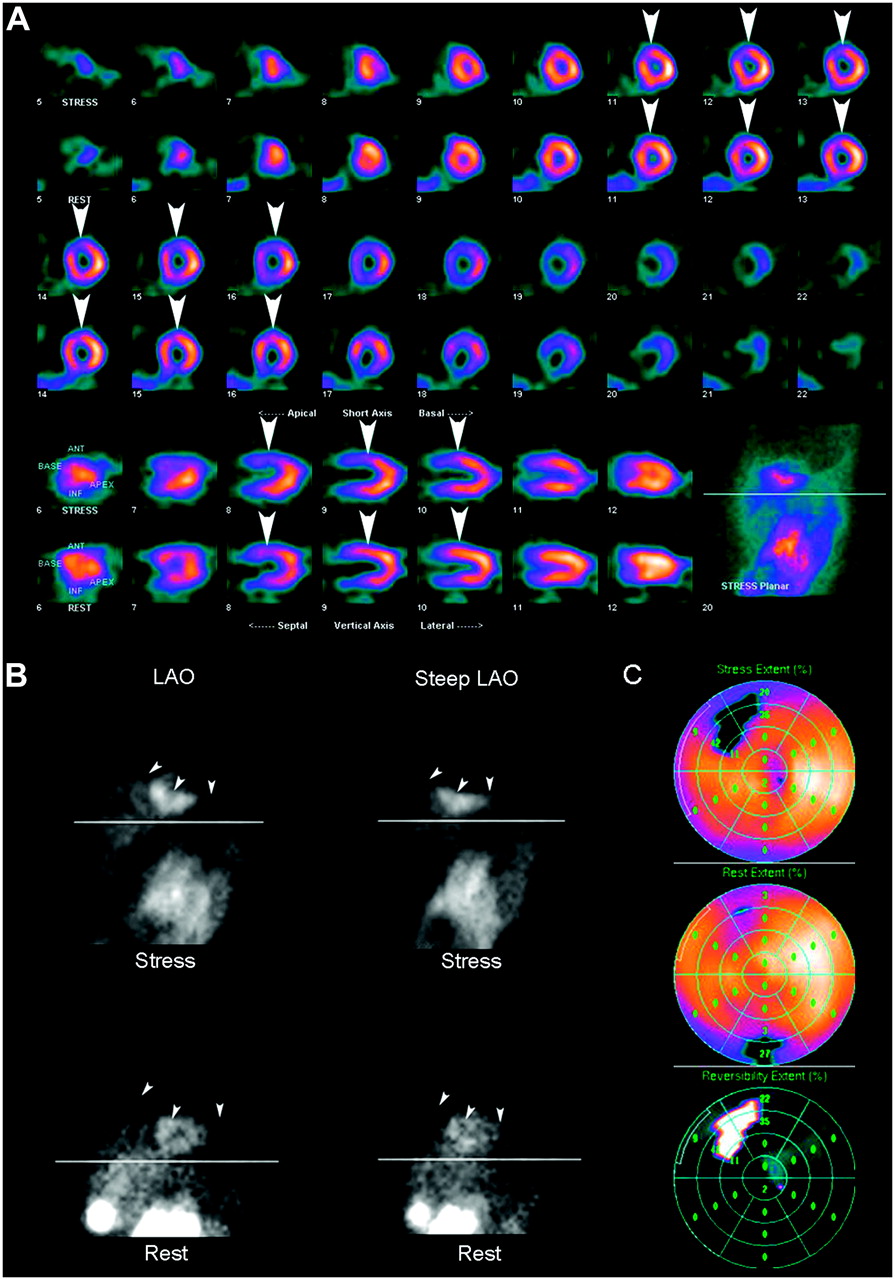
(A) Myocardial perfusion scan reveals a reversible defect in anterior wall (arrowheads). However, frames from raw data (B) indicate that left breast (arrowheads) was in a different position for the 2 acquisitions, possibly resulting in the apparent reversible defect. (C) Quantitative analysis reiterates apparent reversibility of the defect. LAO = left anterior oblique.
- FIGURE 13.
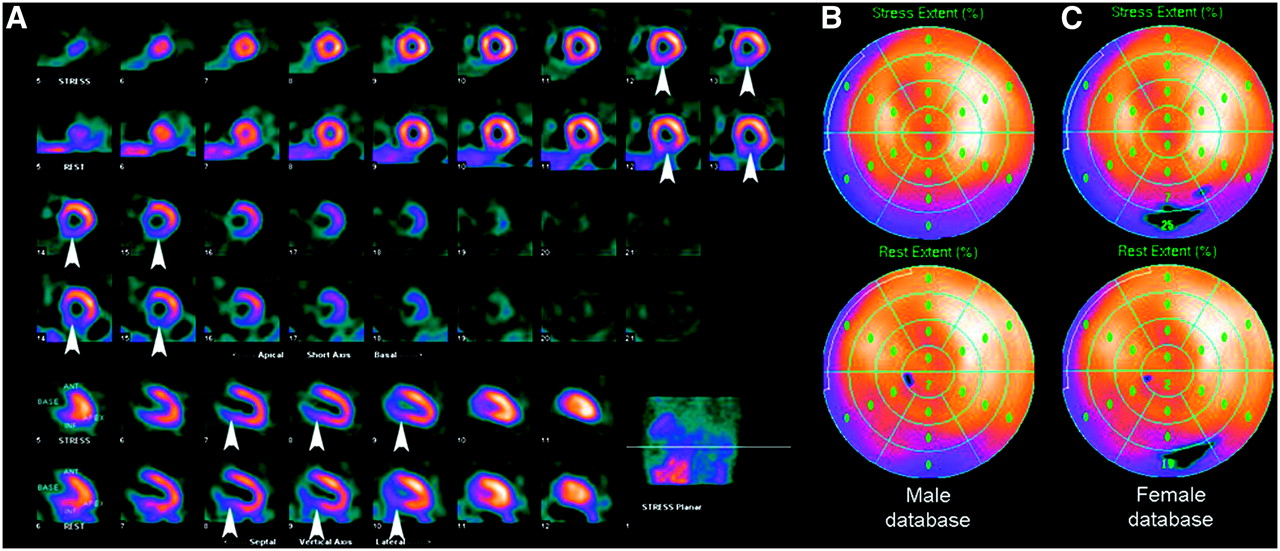
(A) Myocardial perfusion scan demonstrates typical mild fixed inferior wall perfusion abnormality (arrowheads) in male patient resulting from diaphragmatic attenuation. (B) Quantitative analysis using appropriate male database indicates no significant abnormality. (C) When incorrectly reprocessed comparing with female normal database, this male patient appears to have a significant fixed defect in inferior wall, as indicated by the blackout areas.
- FIGURE 14.
(A) Anterior raw data frame from a 99mTc-sestamibi study demonstrates activity in various subdiaphragmatic organs that can interfere with evaluation of perfusion of inferior wall. (B) Left anterior oblique raw data frame from patient with hiatal hernia and prominent gastric uptake (arrowheads), which can interfere with evaluation of lateral wall.
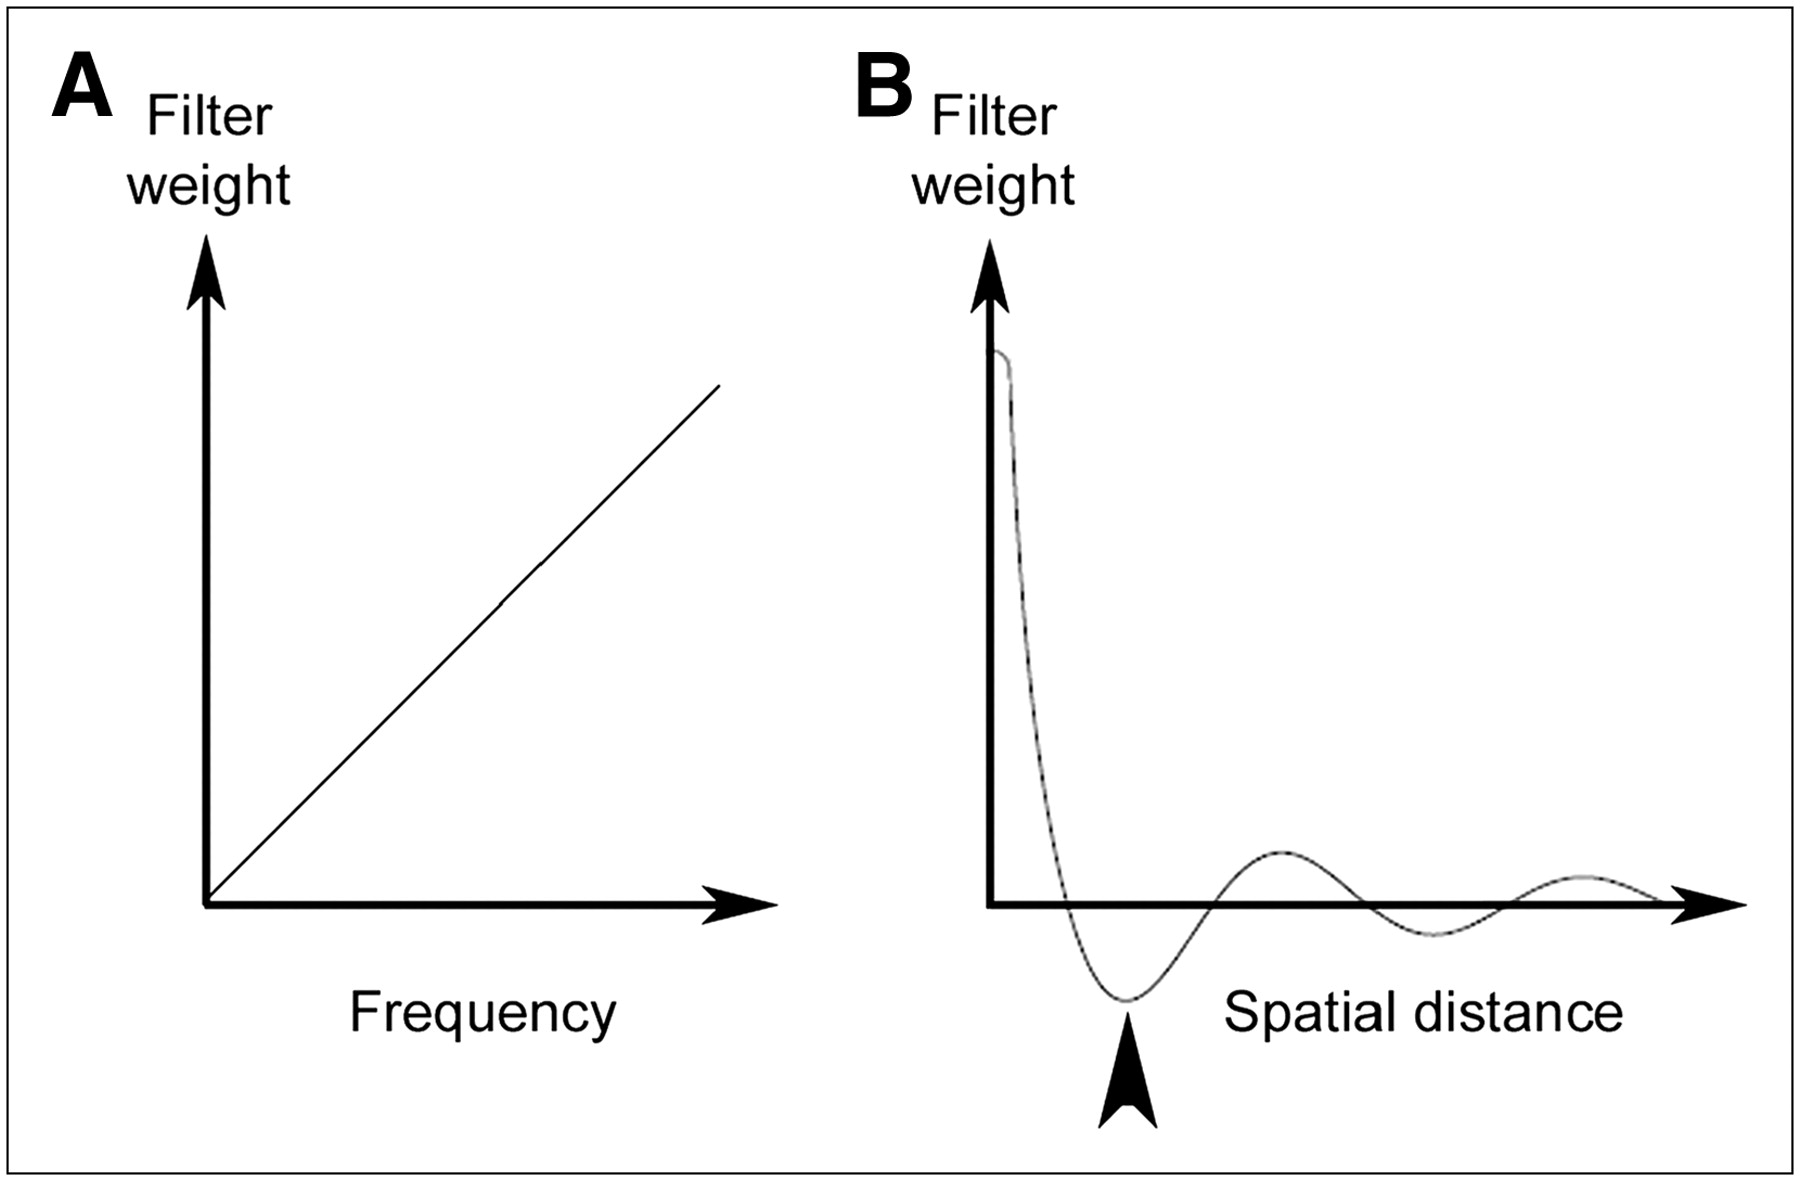
- FIGURE 15.
Ramp filter weighting factor in frequency domain (A) and spatial domain (B). Note negative side lobes (arrowhead) in spatial domain, which result in reduction in activity adjacent to a hot object, such as liver.
- FIGURE 16.
(A) Perfusion images demonstrate apparent perfusion defect in inferior wall that is much worse at rest than during stress (arrowheads). (B) Anterior frames from raw data reveal liver activity to be much greater than cardiac activity at rest (left frame), which is not the case on the stress study (right frame). (C and D) Transaxial slices at level of liver and heart (C) and count profiles across the images (D) (left frames rest, right frames stress). Note negative counts adjacent to intense liver activity on rest study, which results in artifactual reduction in counts in adjacent myocardium.
- FIGURE 17.
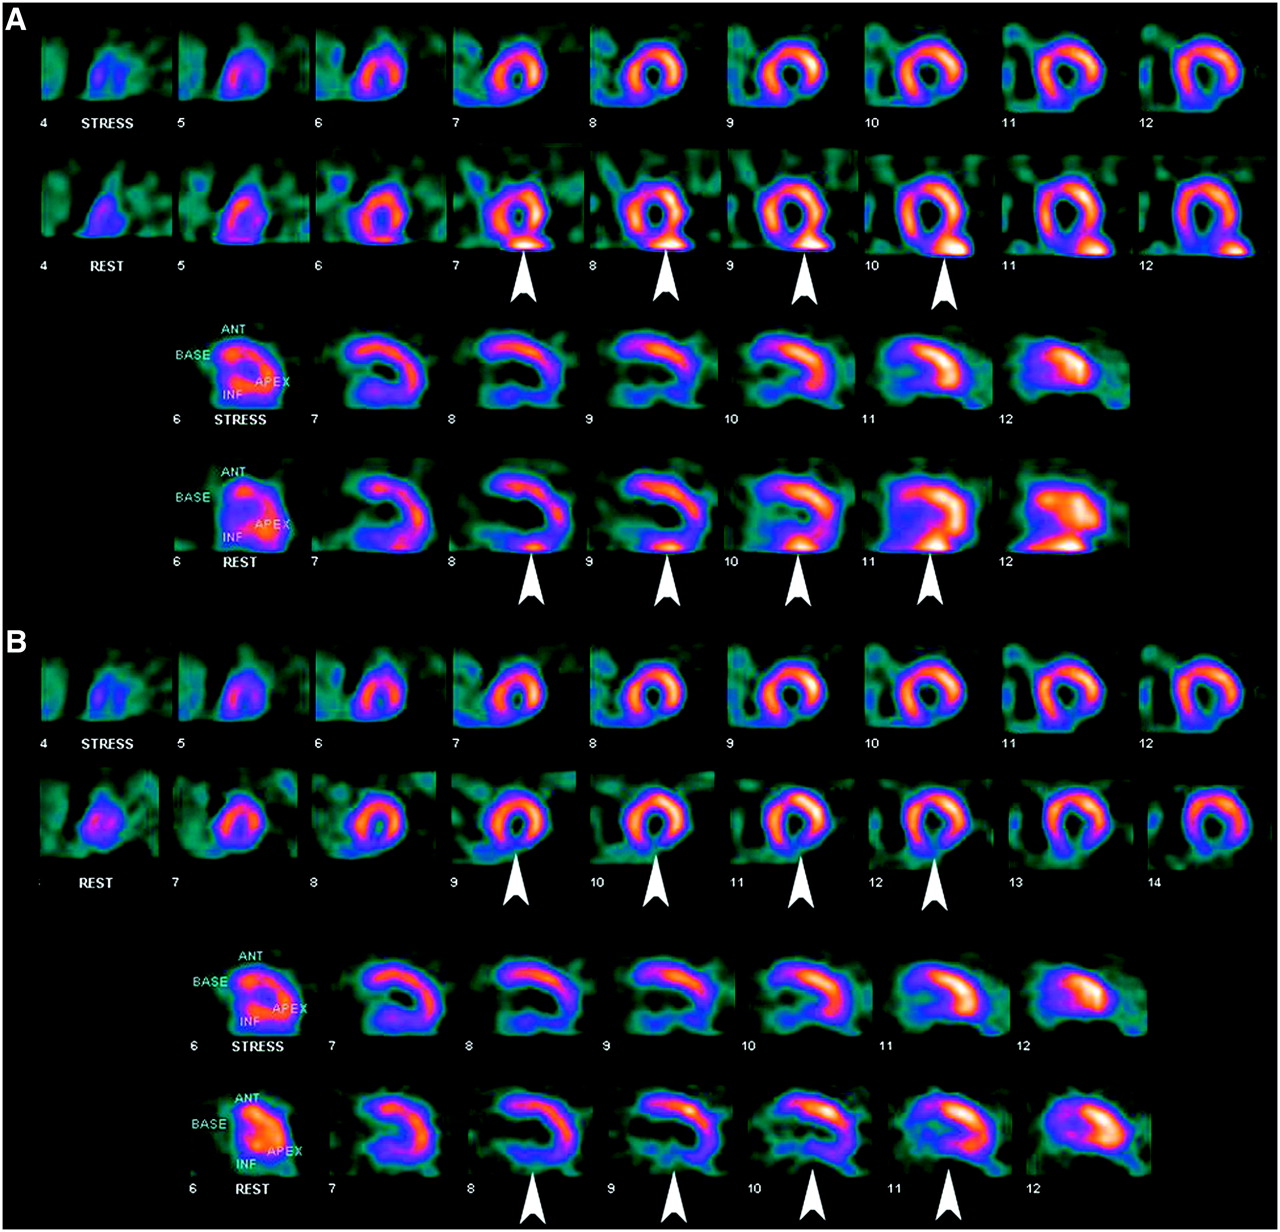
(A) Prominent liver activity adjacent to inferior wall defect on rest images renders it impossible to tell if there is any reversibility present. (B) Rest study was repeated with longer delay between injection and imaging, resulting in no confounding liver activity and, thus, a diagnostic scan. The same stress study is presented in both scenarios.
- FIGURE 18.
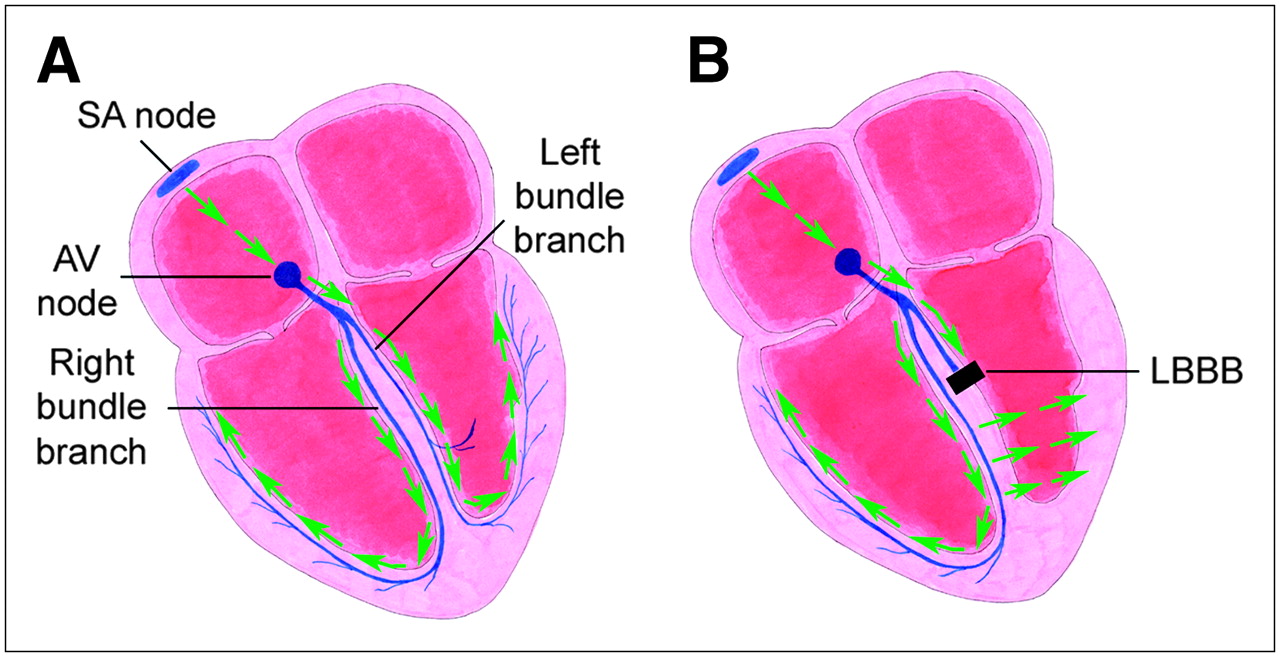
(A) Normal heart conduction system. (B) Heart conduction system in LBBB. Block results in delay in conduction to LV, as signal has to take a circuitous route via the right ventricle. SA = sinoatrial; AV = atrioventricular.
- FIGURE 19.
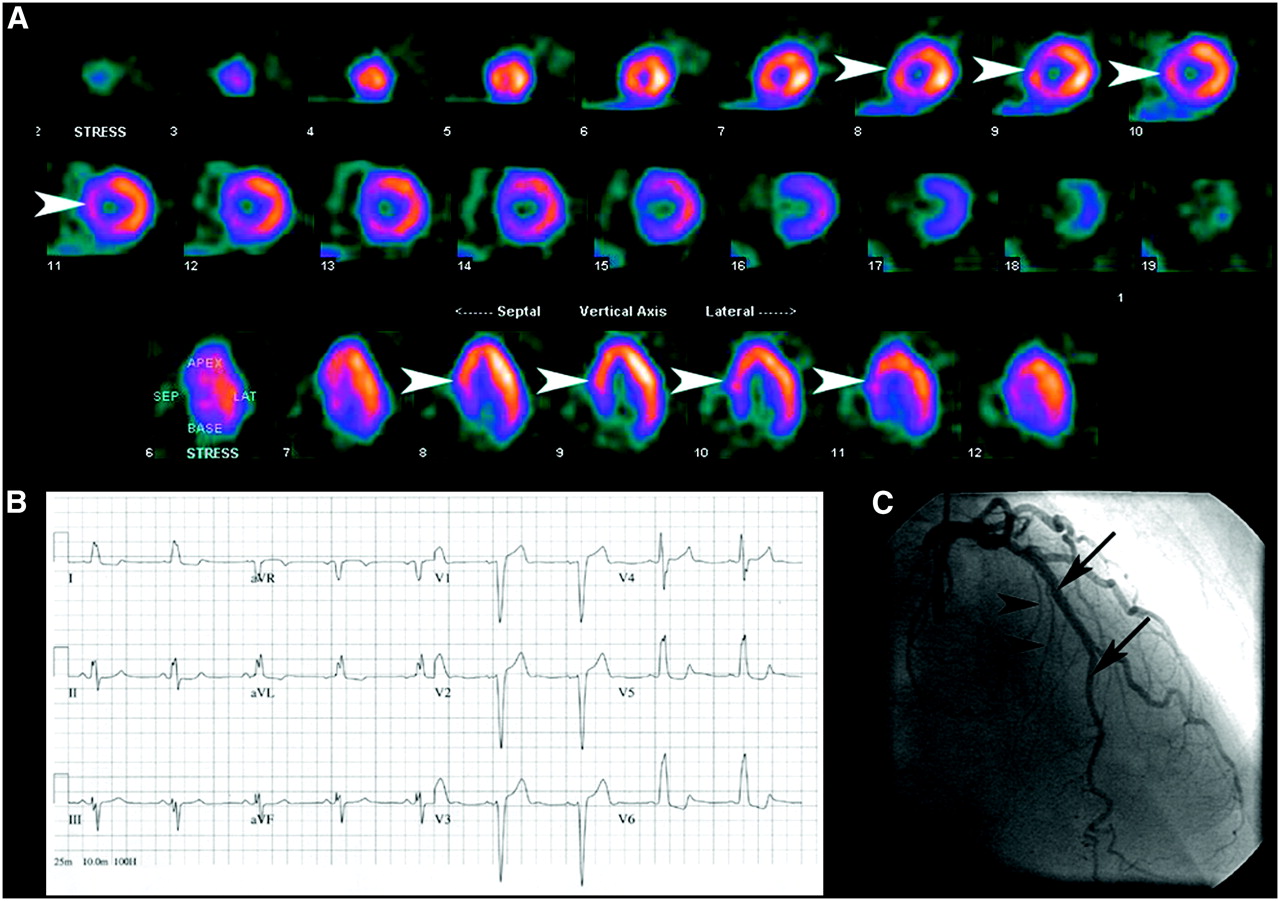
(A) Myocardial perfusion scan obtained after injection of 99mTc-sestamibi during episode of pain shows septal defect (arrowheads). (B) Patient's ECG reveals presence of LBBB. (C) Patient's coronary angiogram reveals normal vessels supplying the septum, including left anterior descending artery (arrows) and septal perforators (arrowheads), indicating that septal defect was secondary to LBBB.
- FIGURE 20.
Myocardial perfusion scan in patient with hypertrophic cardiomyopathy. There is marked increased uptake in septum (arrowheads), which leads to the erroneous appearance of decreased perfusion to remaining walls.
- FIGURE 21.
Myocardial perfusion scan reveals inferior and inferolateral defect (arrowheads) with only mild reversibility. However, patient had critical 3-vessel disease not evident on myocardial perfusion scan, likely a result of “balanced ischemia”.
- FIGURE 22.
(A) Anterior frame from raw data in patient with dextrocardia. His abdominal organs are also reversed left to right (situs inversus). (B and C) Myocardial perfusion scan (B) and quantitative analysis (C) from the same patient. A defect is erroneously identified in what is usually the lateral wall, as this is actually the interventricular septum in this patient. There are no true perfusion defects on this study.


