


Article Figures & Data
Figures
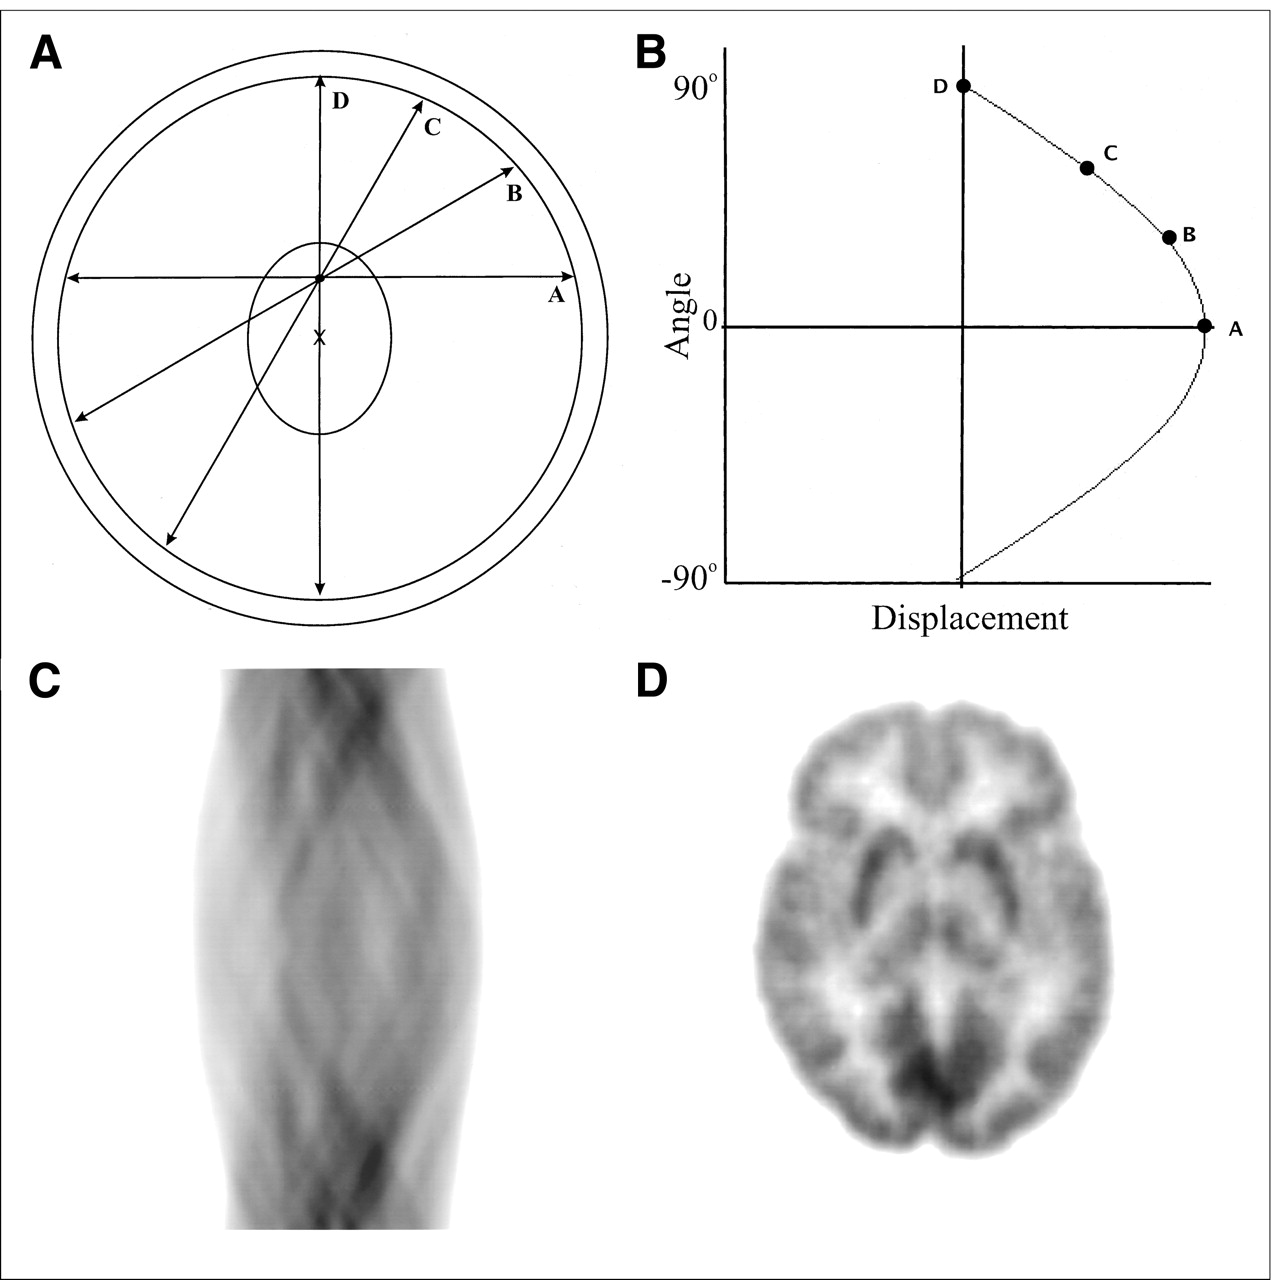
- FIGURE 1.
Sinogram formation. Coincidence events in PET scanner are categorized by plotting each LOR as function of its angular orientation versus its displacement from center of gantry. (A) Center of gantry is noted by cross (X), and locus of interest (e.g., tumor) is noted by ellipse. Four LORs passing through locus of interest are labeled A, B, C, and D. (B) These 4 LORs are plotted on this sinogram where angular orientation is on y-axis and displacement from center of gantry is on x-axis. If all possible LORs that pass through this point are plotted, it maps out half of sine wave turned on its side as shown here. (C) Sinograms of more complicated objects, such as sinogram of brain scan shown, are composed of many overlapping sine waves. (D) Reconstructed brain image corresponding to sinogram in (C) is shown.
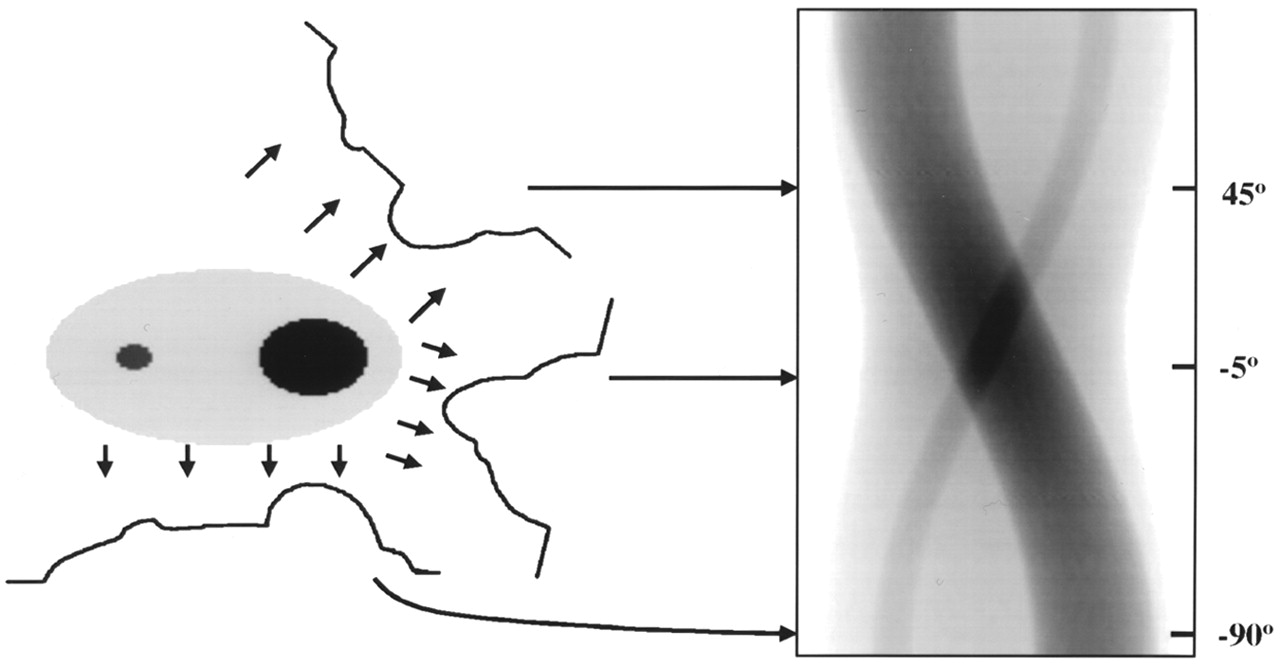
- FIGURE 2.
Sinograms and projections. Plot of LOR sums from series of parallel LORs at particular angle is referred to as “projection.” Figure shows projections through object at 3 different angles (−90o, −5o, and 45o). Each row in sinogram is projection through object at that angle. For example, row through sinogram at –5o is composed of projection through object at –5o.
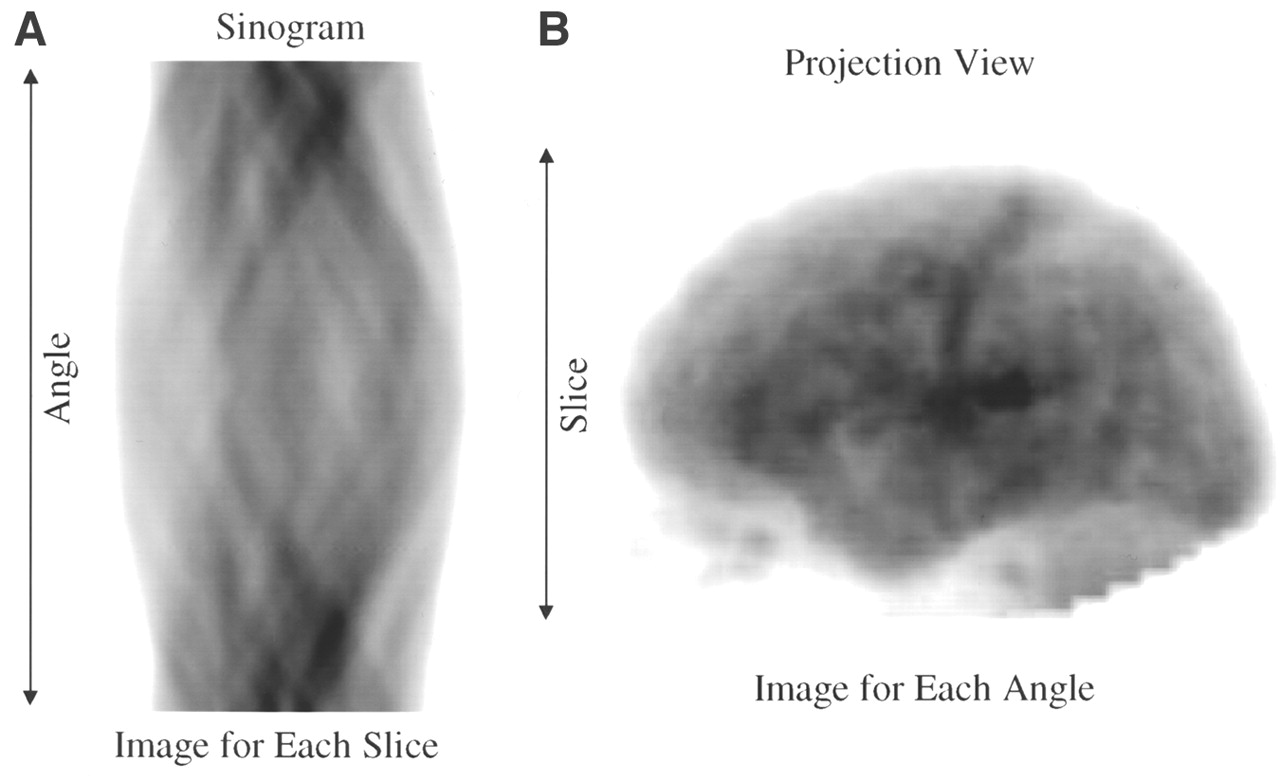
- FIGURE 3.
Sinograms and views. Two alternative methods of displaying raw PET data are sinograms and projection views. (A) Sinogram displays all angles for particular slice with separate sinogram for each slice. (B) Alternatively, each projection view displays all slices at particular projection angle with separate view for each angle. Complete set of sinogram data can be easily reconfigured and displayed as projection views and vice versa.
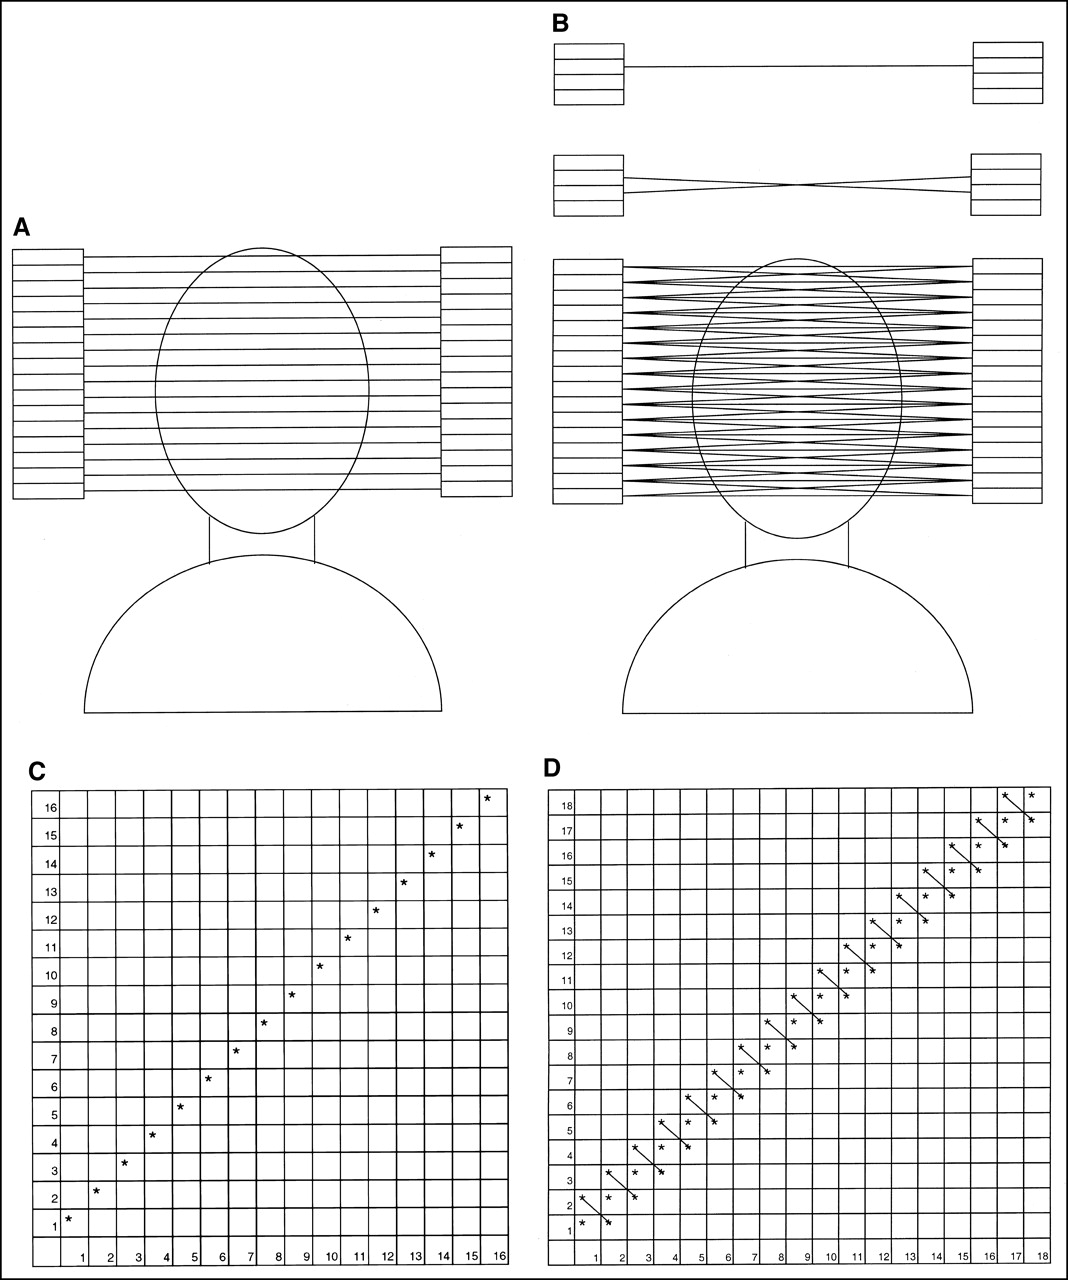
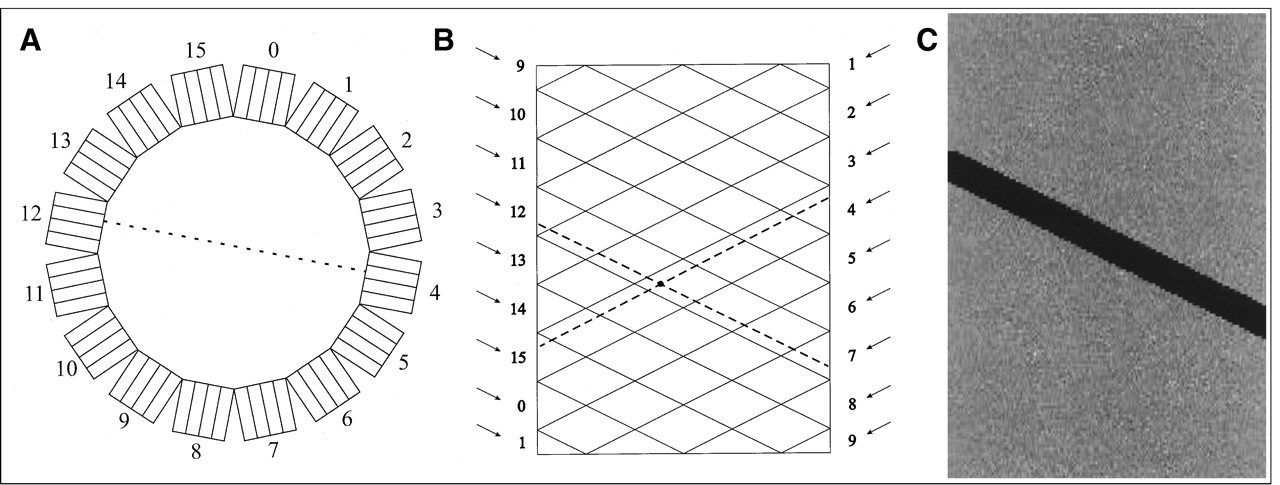
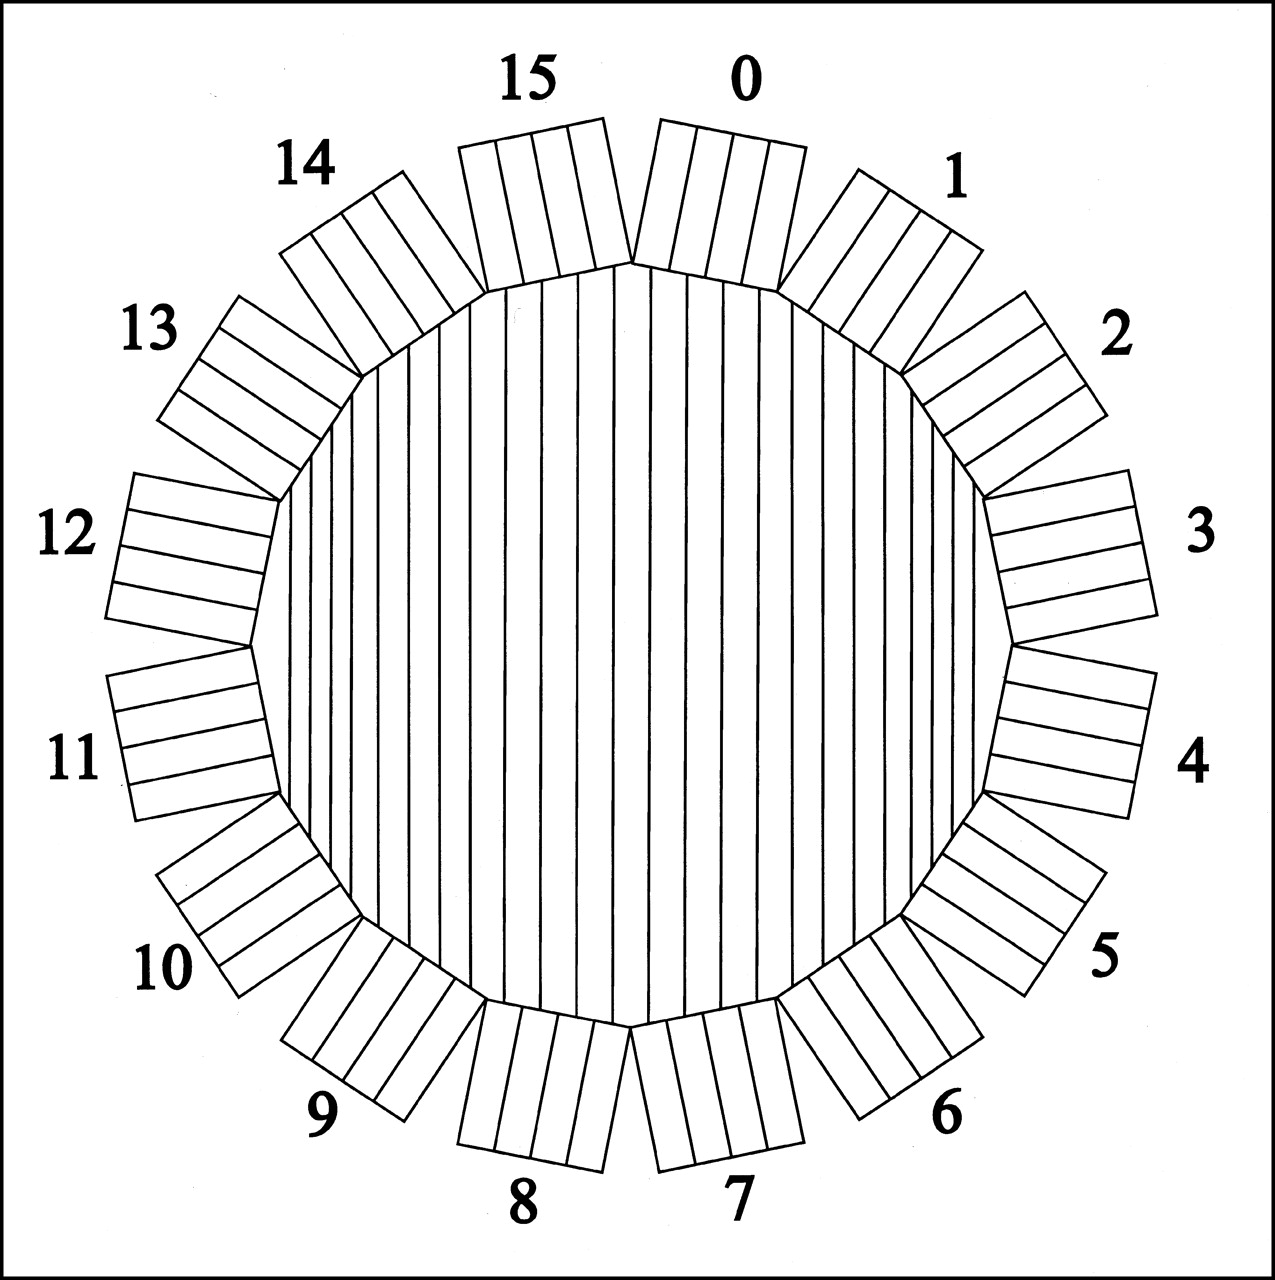
- FIGURE 4.
Sinograms and ring gantry. (A) Ring gantry is shown with 16 detector blocks. (B) In sinogram, events involving Block 12 are displayed along diagonal as shown. All blocks in coincidence with Block 12 (Blocks 1−7) are also displayed along diagonals, but slanting in opposite direction. LOR shown in (A) as dashed line is represented in sinogram in (B) as intersection of dashed lines from Block 12 and Block 4, respectively. (C) If particular block in scanner is malfunctioning, it will lead to diagonal streak in sinogram as shown here. This fact is used in routine PET quality control to determine which blocks may need to be serviced.
- FIGURE 5.
Arc correction. Figure shows all parallel LORs at 90o. Due to curved nature of gantry, LORs toward periphery are more closely spaced than those toward center. Correction is applied before reconstruction to address this differential spacing known as “arc correction.” Note that arc correction is more prominent for either large objects (part of object imaged far from gantry center) or small gantries.
- FIGURE 7.
Axial sampling of 2D PET and Michelograms. Figure shows multiring PET scanner with 16 rings in axial direction. (A) Coincidence events involving detectors within same ring (e.g., detectors in Ring 3 in coincidence with detectors on opposite side of Ring 3) are referred to as “direct” coincidences. In this figure there are 16 “direct” planes. (B) In many PET scanners, inclusion of “cross” coincidences (e.g., events in Ring 2 allowed to be in coincidence with detectors in Ring 3 and vice versa) improves axial sampling since these cross coincidence planes are considered to be between 2 planes involved. Top of figure shows both direct and cross plane. Bottom of figure shows all of resulting LORs. (C) Michelogram plots those detectors on one side of gantry that are allowed to be in coincidence with detectors on other side of gantry. In this Michelogram, asterisks (*) only along diagonal imply that only direct coincidences are allowed. This leads to 16 planes being acquired. (D) In Michelogram for direct and cross coincidences 2 cells representing Ring 2 in coincidence with Ring 3, and Ring 3 in coincidence with Ring 2 are connected by straight line indicating that data from both of these cells are combined. If scanner is irradiated by uniform source, there will be twice as many counts in cross planes as in direct planes. In this configuration, there will be 16 direct planes and 15 cross planes for total of 31 planes. Thus, inclusion of cross planes increases axial sampling by factor of 2.
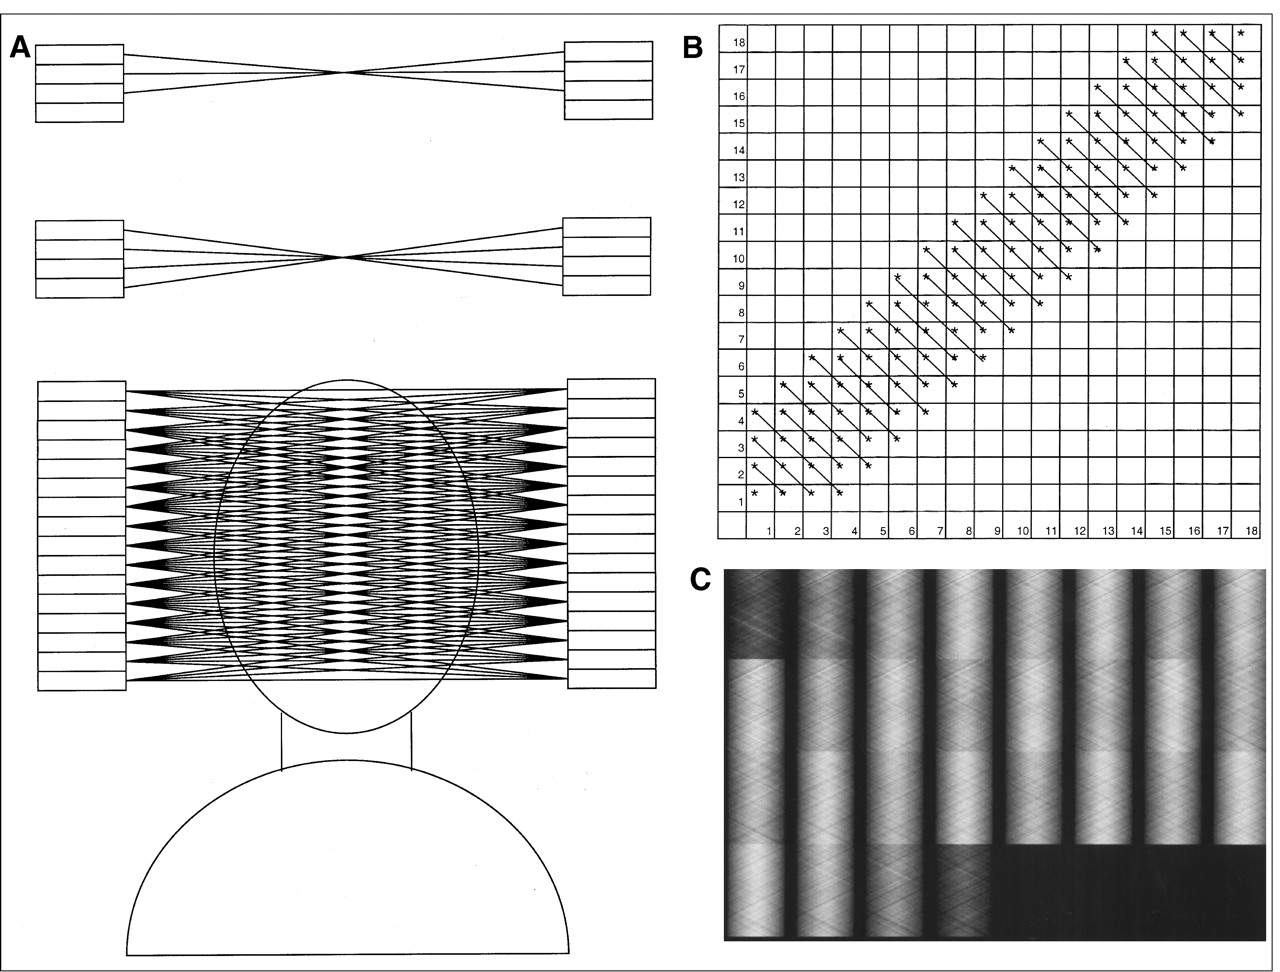
- FIGURE 7.
2D PET with span of 7. (A) Top of figure shows configuration for odd-numbered slices. Not only is direct LOR used but also 2 cross LORs on either side of it. For example, Ring 2 in coincidence with Ring 2, Ring 3 with Ring 1 and Ring 1 with Ring 3. For even-numbered slices, 2 sets of cross LORs are used (e.g., Ring 2 to Ring 3, Ring 3 to Ring 2, as well as Ring 1 to Ring 4, and Ring 4 to Ring 1). Since odd-numbered planes contain 3 LORs and even ones contain 4, this is referred to as span of 7. (B) Michelogram for 16-ring scanner using span of 7. (C) Set of sinograms corresponding to Michelogram in (B) that have not been corrected for detector sensitivity or plane efficiency is shown. Note that first and last 2 sinograms have substantially fewer counts than others and that even-numbered sinograms have slightly more counts than odd-numbered ones.
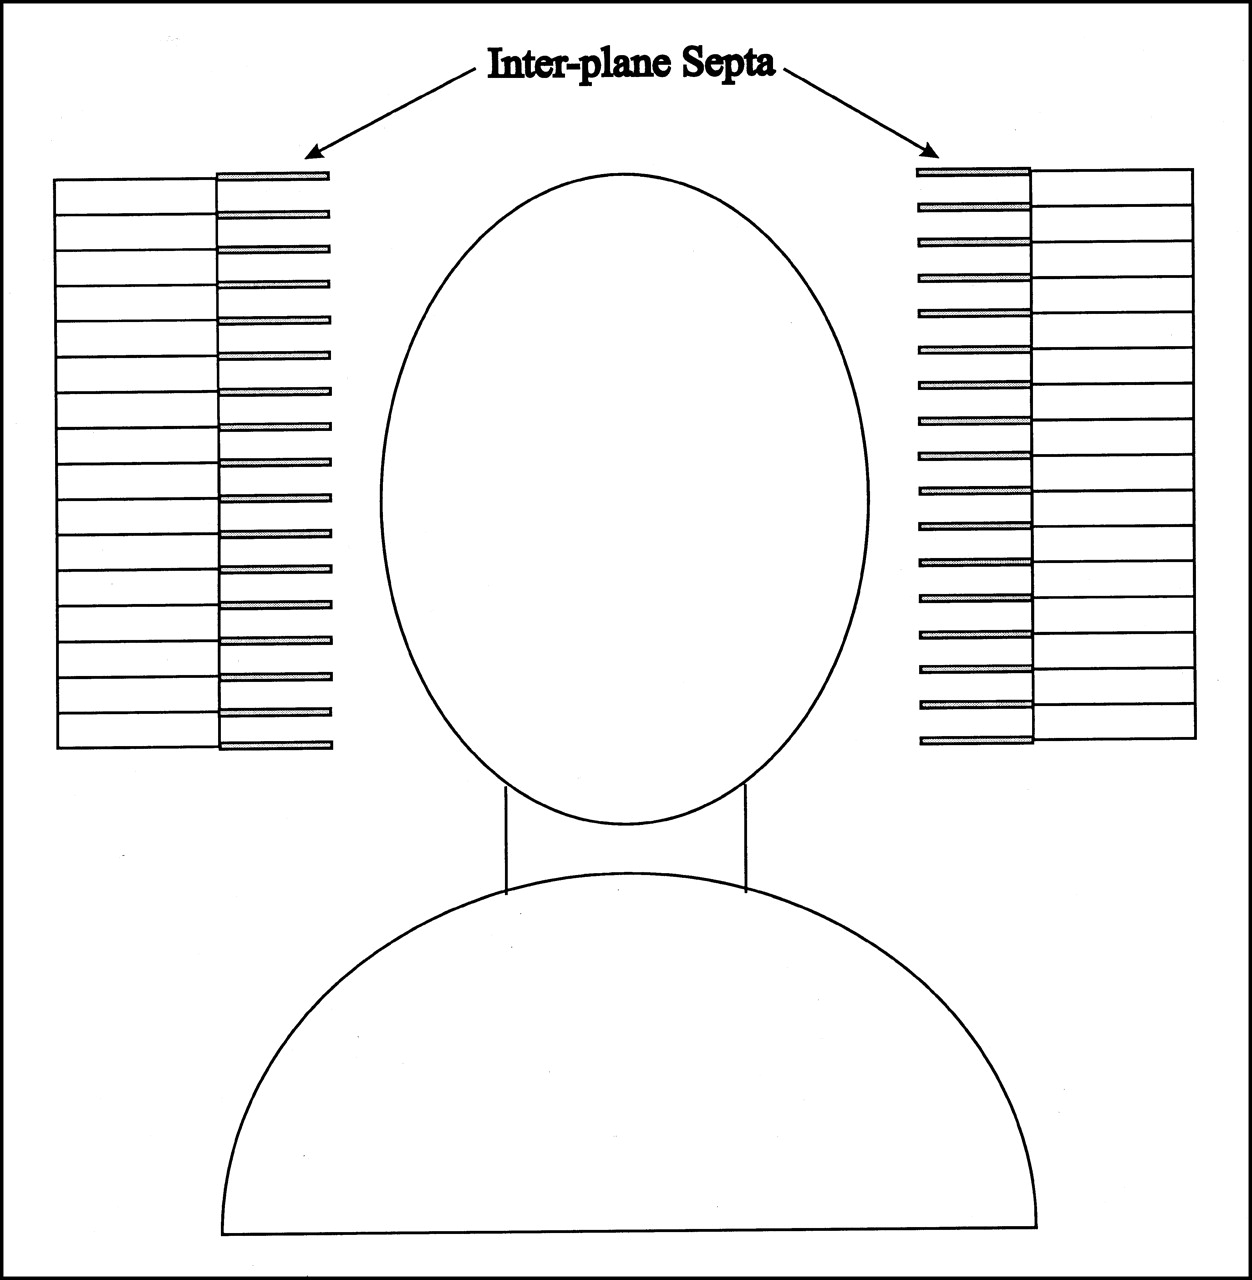
- FIGURE 8.
Interplane septa. In many 2D-PET scanners, septa are placed between detector rings to reduce amount of interplane scatter. In modern scanners, one can mechanically retract septa so that scanner can be operated in either 2D or 3D mode.
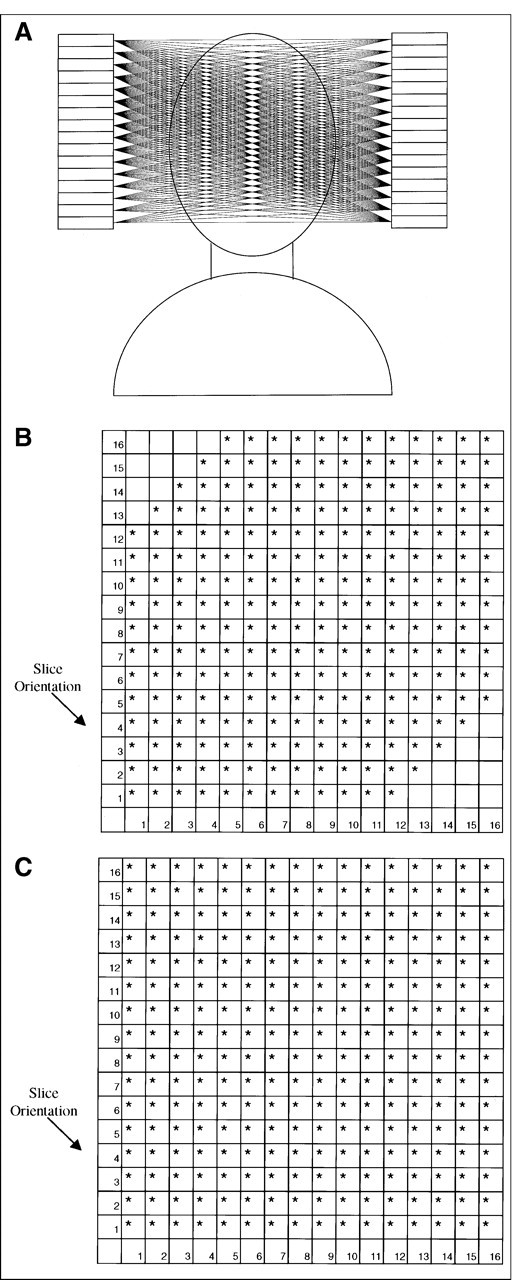
- FIGURE 9.
3D PET. In 2D PET, data are organized in individual planes that can be reconstructed independently with 2D algorithm. In modern scanners, one can retract septa, allowing many more LORs to be acquired. Some scanners do not have septa and thereby acquire in 3D mode at all times. In 3D PET, one can define “maximum ring difference” (RD) that is allowed. If RD = 11, then Ring 1 is allowed to be in coincidence with Rings 1−12. (A) Acceptable LORs for RD = 11 are shown. (B) Michelogram for 3D acquisition with RD = 11 is shown. Reconstructed planes would be parallel and oriented as shown. (C) Michelogram for 3D acquisition with RD = 15.
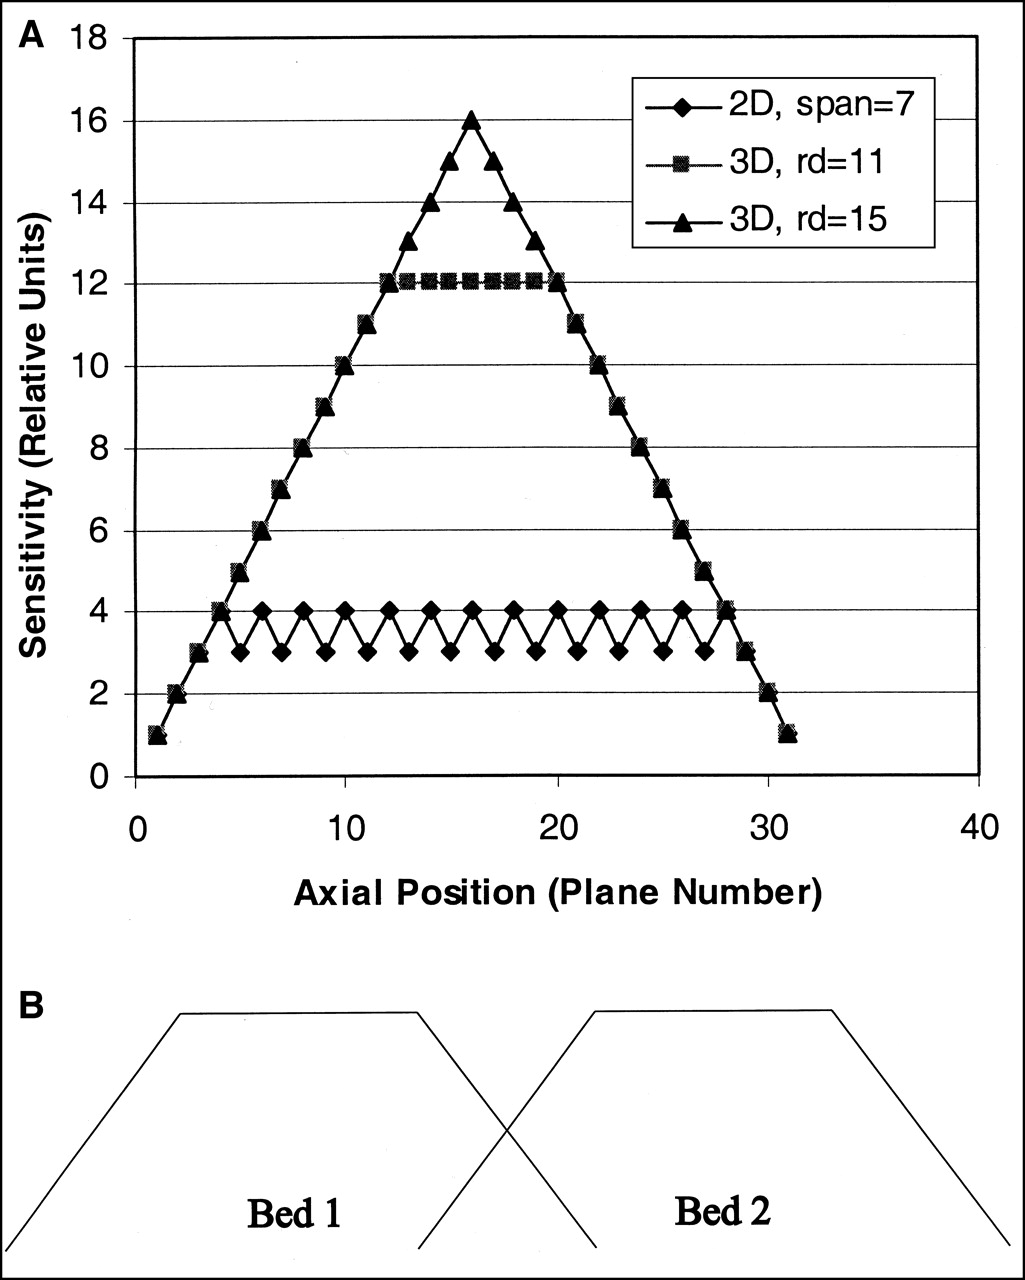
- FIGURE 10.
Sensitivity and axial position. (A) Figure shows sensitivity for 16-ring scanner with 3 different data acquisitions: 2D with span of 7, 3D with RD = 11, and 3D with RD = 15. As one moves in from edge of scanner, sensitivity increases to maximum. For RD = 15, it peaks in middle, forming triangular function. For RD = 11, there is central plateau of maximum sensitivity. Note that all 3 acquisitions yield similar sensitivity at edges of axial field of view. (B) If multibed study using 3D, scans should be overlapped as shown here to yield relatively constant sensitivity over extended field of view.
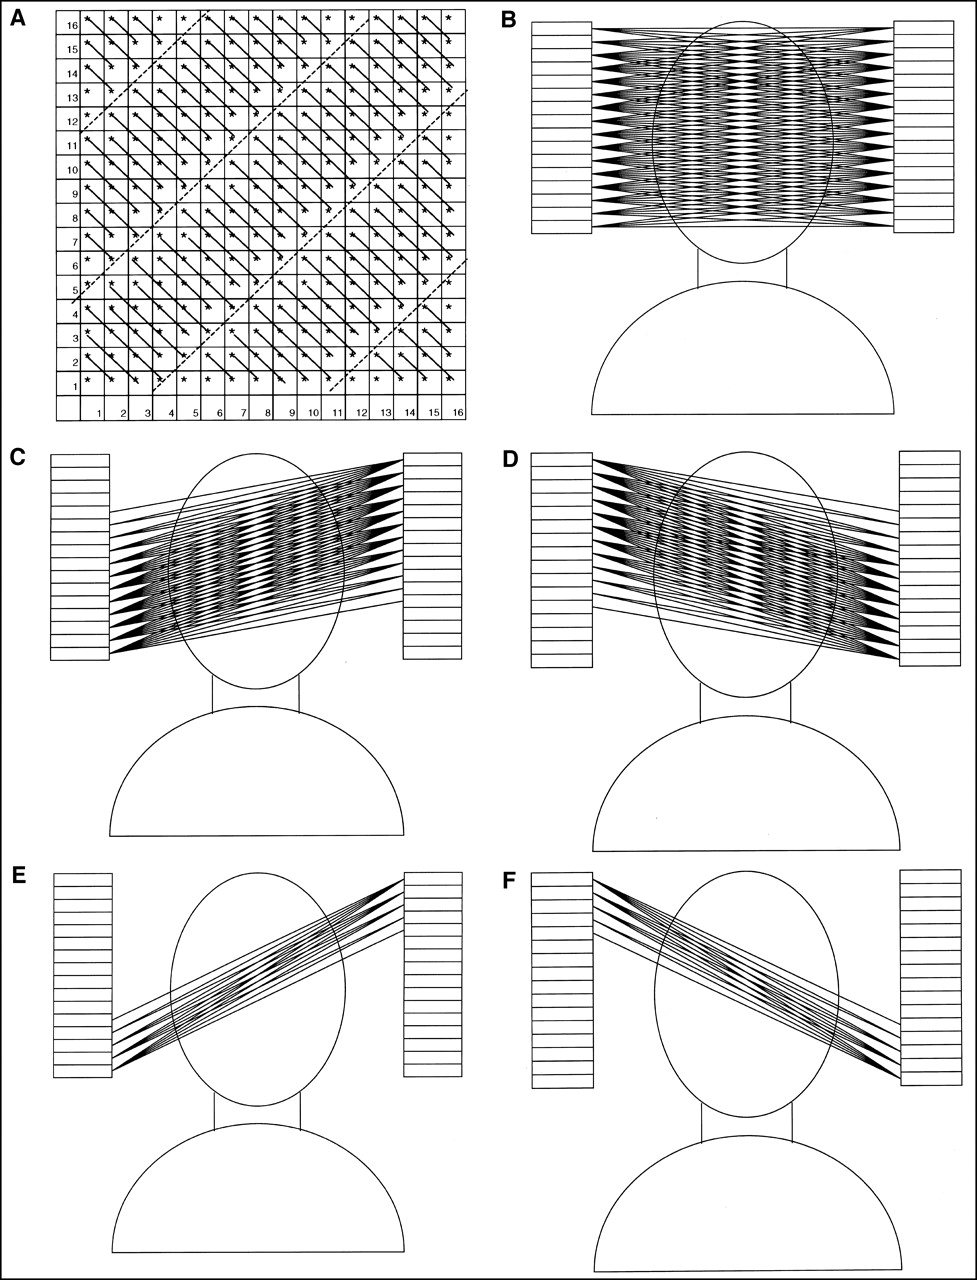
- FIGURE 11.
3D acquisition. (A) Michelogram for 3D acquisition with 16-ring scanner using RD = 15 and span of 7. Note that Michelogram is organized into 5 segments. (B−F) LORs are shown for segments 1−5, respectively. Note that axially angled segments yield truncated view of object.


