


Abstract
Objective: We sought to determine the best parameters for rapid performance of daily quality control testing of intrinsic uniformity and relative sensitivity for the single-head gamma- camera system in our nuclear medicine department. Methods: The effects of the following parameters on intrinsic uniformity were studied: gamma source activity, number of acquired counts for the flood image, source-to-camera distance, image matrix size, and source volume. The dead time of the system was determined experimentally using the two-source method for accurate calculation of relative sensitivity. Results: A set of parameters for rapid performance of daily gamma-camera intrinsic uniformity and relative sensitivity was determined. The dead time of our gamma-camera system was found to be 4.5 ± 0.2 μs. Conclusion: With our recommended parameters, the intrinsic uniformity and relative sensitivity quality control testing can be performed in 5–6 min. The dead time of each gamma- camera system must be determined experimentally in each nuclear medicine department.
The daily evaluation and comparison of intrinsic flood-field uniformity (IU) and relative sensitivity (RS) makes it possible to correct many gamma-camera problems as soon as they appear. The quality control (QC) tests for IU, performed with the collimator removed, and RS are usually performed by exposing the gamma camera's crystal to a uniform flux of gamma radiation from a 99mTc point source.
Daily evaluation and comparison of flood-field uniformity is required before using the gamma camera for patient testing. Any nonuniformity must be eliminated before patient testing to eliminate artifacts and false-positive or false-negative patient results. We prefer intrinsic uniformity testing because a 99mTc point source is readily available.
The relative sensitivity of the gamma-camera system is the parameter that characterizes the stability of its response to gamma radiation. It is the system counting rate per unit source activity and is usually expressed in cpm/μCi. Variations in the RS of the system are mainly due to electronic instability (improper discriminator window setting, deviation of photomultiplier tubes' high voltage and/or gain, decreased energy resolution, etc.) or yellowing of the gamma-camera NaI(Tl) crystal. The QC test of RS is performed simultaneously with the IU test by noting the elapsed time required to acquire the flood image.
MATERIALS AND METHODS
The following procedure was used to measure the system IU and RS. Gamma source activity, the number of acquired counts for the flood image, source-to-camera distance, image matrix size, and source volume were each evaluated to determine the ideal procedure for our department.
The collimator was removed from the camera.
The camera was set with its face perpendicular to the floor.
The room background was carefully measured using the NaI crystal of the gamma camera. We made every attempt to keep the background as low as possible (< 200 cps) by removing all the radioactive sources from the room. Any radioactive source or minor contamination would increase the background and could degrade the uniformity of the flood image.
The activity of a 99mTc point source in a syringe was measured in the dose calibrator after replacing the needle. The linearity of the dose calibrator in the range of 0.1–50 mCi was < 5%. We varied the source activity between 0. 1 mCi and 6.0 mCi to determine the effect of source activity on IU. The volume of 2.0–2.2 mCi point sources was varied (increased) by adding 0.9% sodium chloride to the syringe to determine the effect of point source volume on IU.
The point source was carefully aligned with the center of the camera. The distance between the point source and the crystal face was varied between 5–10 ft to determine the effect of source distance on IU.
The 99mTc gamma spectrum was acquired and a 20% window around the 140-keV photopeak was set.
The intrinsic flood-field image was obtained. We initially followed the manufacturer's instructions, using a 512 × 512 × 16 computer matrix size using the full field-of-view detector mask. We acquired data between 1 M and 60 M counts to determine the minimum number of counts required. The remaining data were acquired at 15 M, 30 M, or 60 M counts. We also experimentally altered to the image matrix size to assess the impact on IU.
Immediately after acquiring the flood image, the activity of the point source was again measured in the dose calibrator. Decay correction of the gamma source activity during the time (Δt) required to acquire the flood image was required for accurate determination of RS. This was achieved in our laboratory using the dose calibrator to measure the source activity just before and immediately after acquiring the flood image, and the two activities were averaged to get the corrected source activity (this correction is valid because Δt < T, where T is the 99mTc half-life). Dead time (τ) correction also is required for accurate RS calculation.
IU =
 × 100.
The dead time (τ) of our system is not specified by the manufacturer, but may be estimated using the provided maximum counting rate R0max = 135 kcps to be τ ≈ 2.4 μs (1). Using this value for τ to correct the counting rate in our daily QC test, we noticed that the system RS decreased as source activity increased (and accordingly the counting rate). This indicated that the estimated value of the system dead time was low and had to be determined experimentally for our geometry and scatter conditions, which affect the value of R0max (accordingly τ) as indicated by Early and Sodee (2).

RESULTS
Intrinsic Uniformity Versus Source Activity
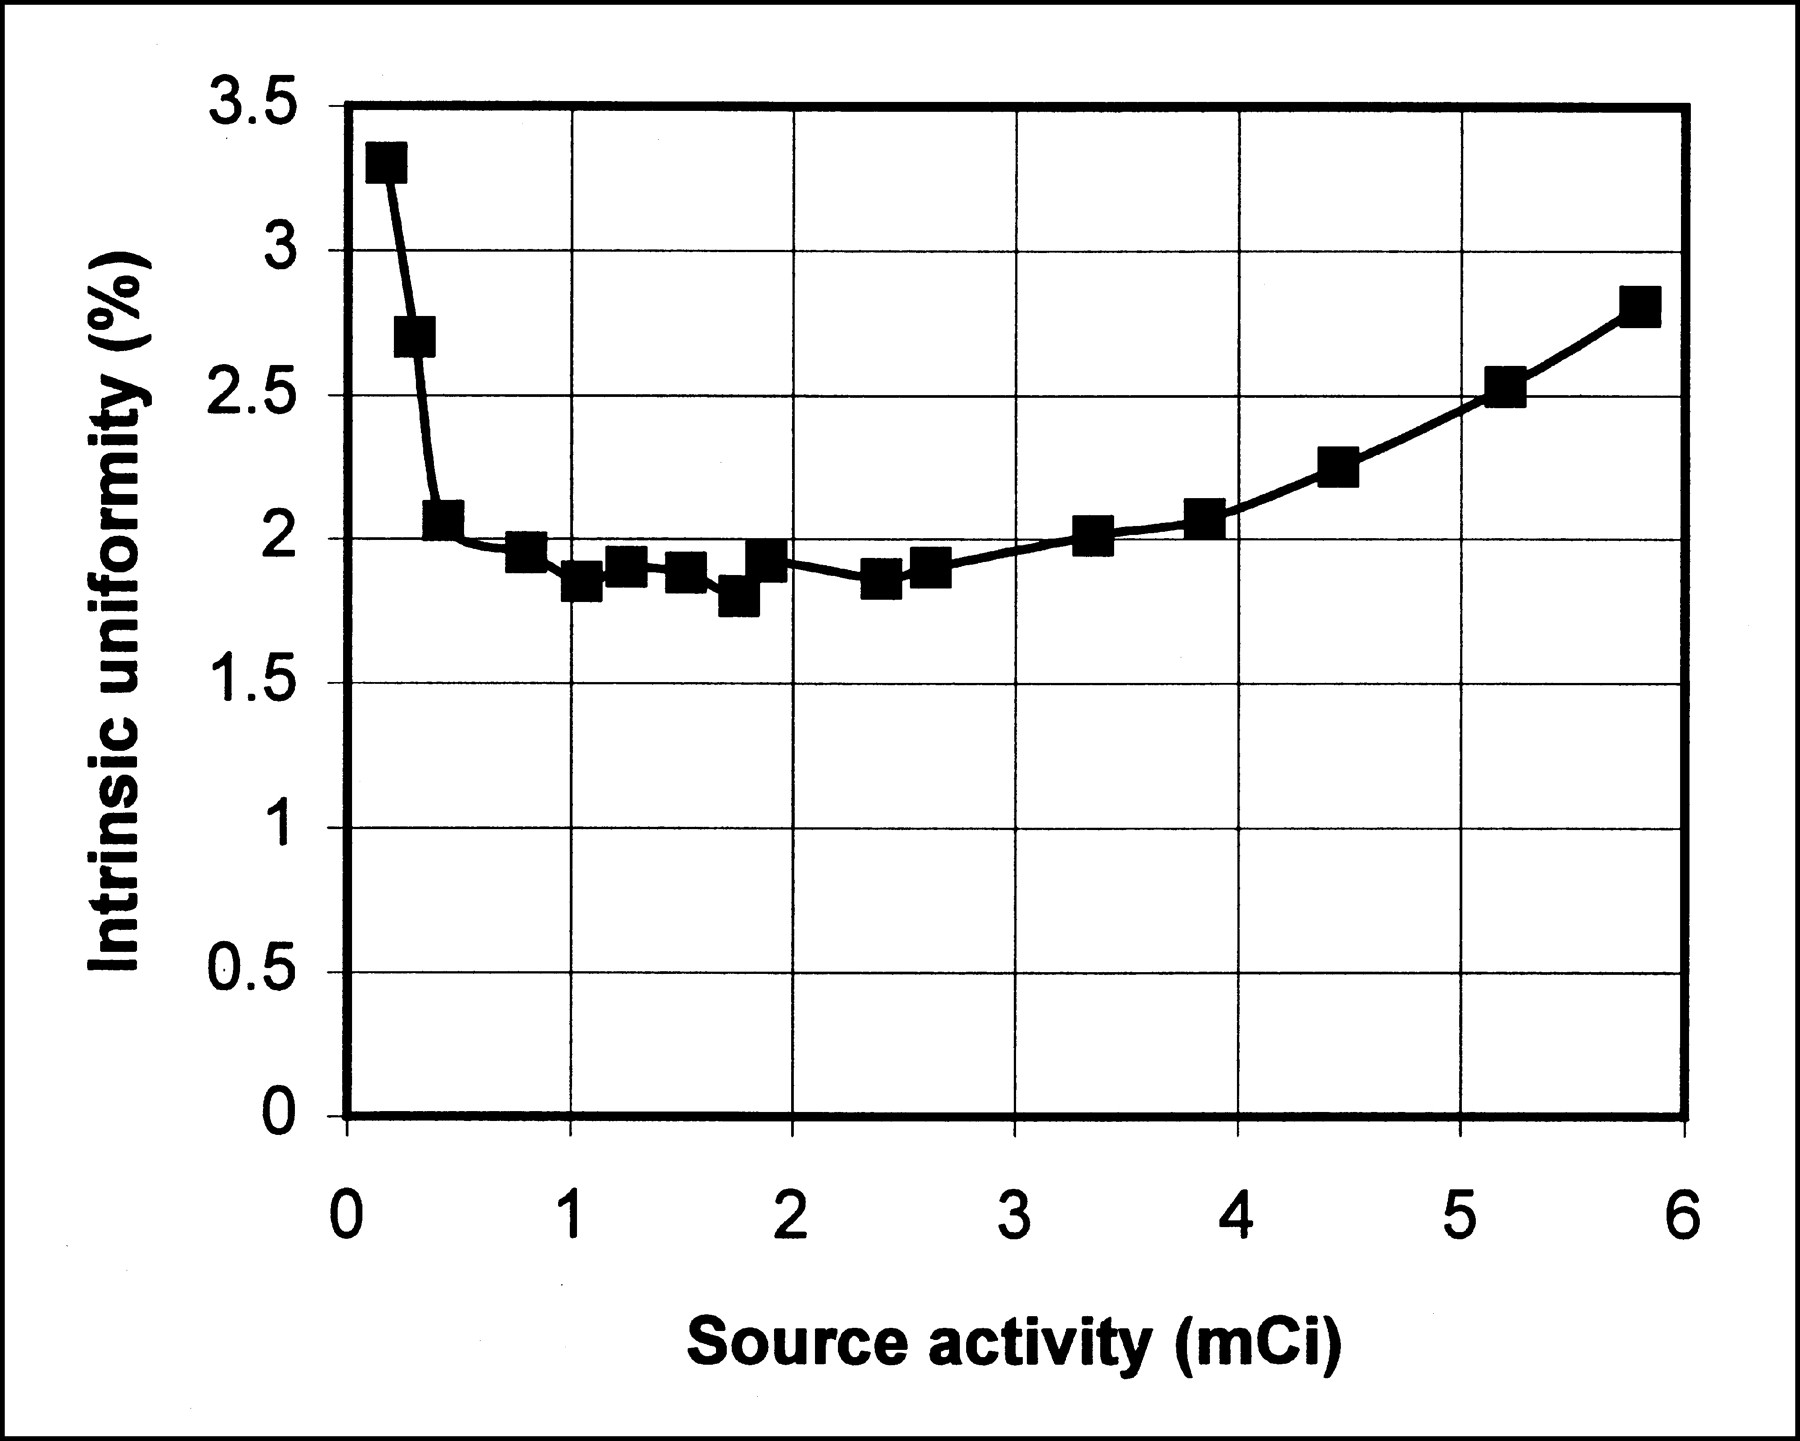
Figure 1 shows the measured CFOV IU of the system versus source activity when 15 M count flood-field images were acquired. From this figure we noticed:
At source activities < 0.8 mCi, the IU improved as source activity increased. This was due to the decreased role of room background in determining the IU as source activity increased.
At source activities between 0.8–3.0 mCi, the system IU was almost constant and less than 2%.
At source activities >3.0 mCi, the IU slowly degraded. This was probably due to the increased effect of counting rate losses caused by system dead time as source activity increased.

Intrinsic uniformity versus source activity. The intrinsic flood field uniformity was almost constant and < 2% for point-source activities between 0.8–3.0 mCi.
Intrinsic Uniformity Versus Number of Acquired Counts
Figure 2 shows the effect of the number of acquired counts on IU when 2.0–2.2 mCi point sources were used for all flood-field images. The error bars on the figure show the statistical variation. We demonstrated that by increasing the number of acquired counts (longer time to obtain the flood image), the IU improved because there were fewer statistical fluctuations. However, the incremental gain in IU from 30–60 M was minimal.
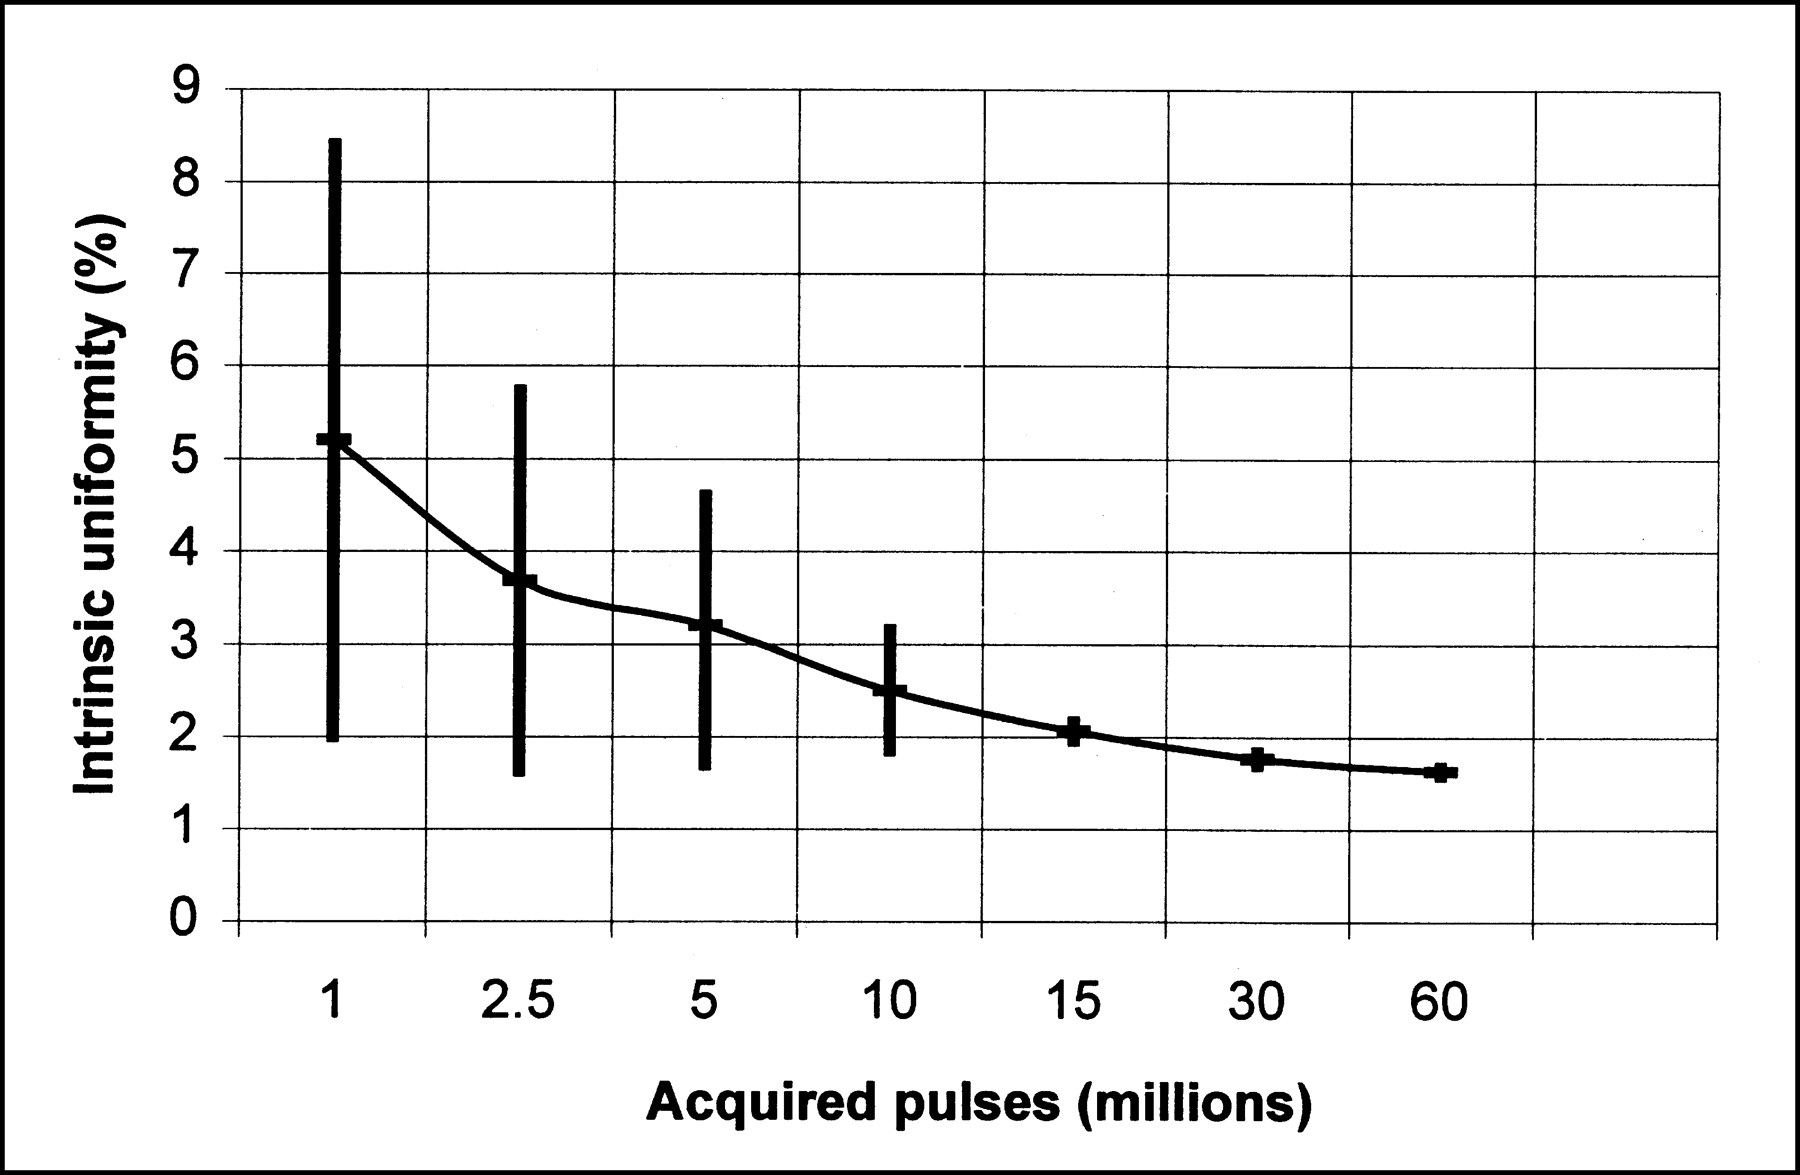
Intrinsic uniformity versus number of counts acquired (pulses acquired). The intrinsic flood-field uniformity improved as the number of acquired counts for the flood-field image increased.
Intrinsic Uniformity Versus Source-to-Camera Distance
Figure 3 shows the IU of the system versus the source-to-camera distance where the counting rate for acquiring the flood image was kept in the range of 45–50 kcps and the number of acquired counts for each flood image was 15 M. Figure 3 shows that the IU of the system improved as the source-to-camera distance increased by improving the uniformity of the gamma flux reaching the crystal. Ten feet was the maximum distance we could measure.
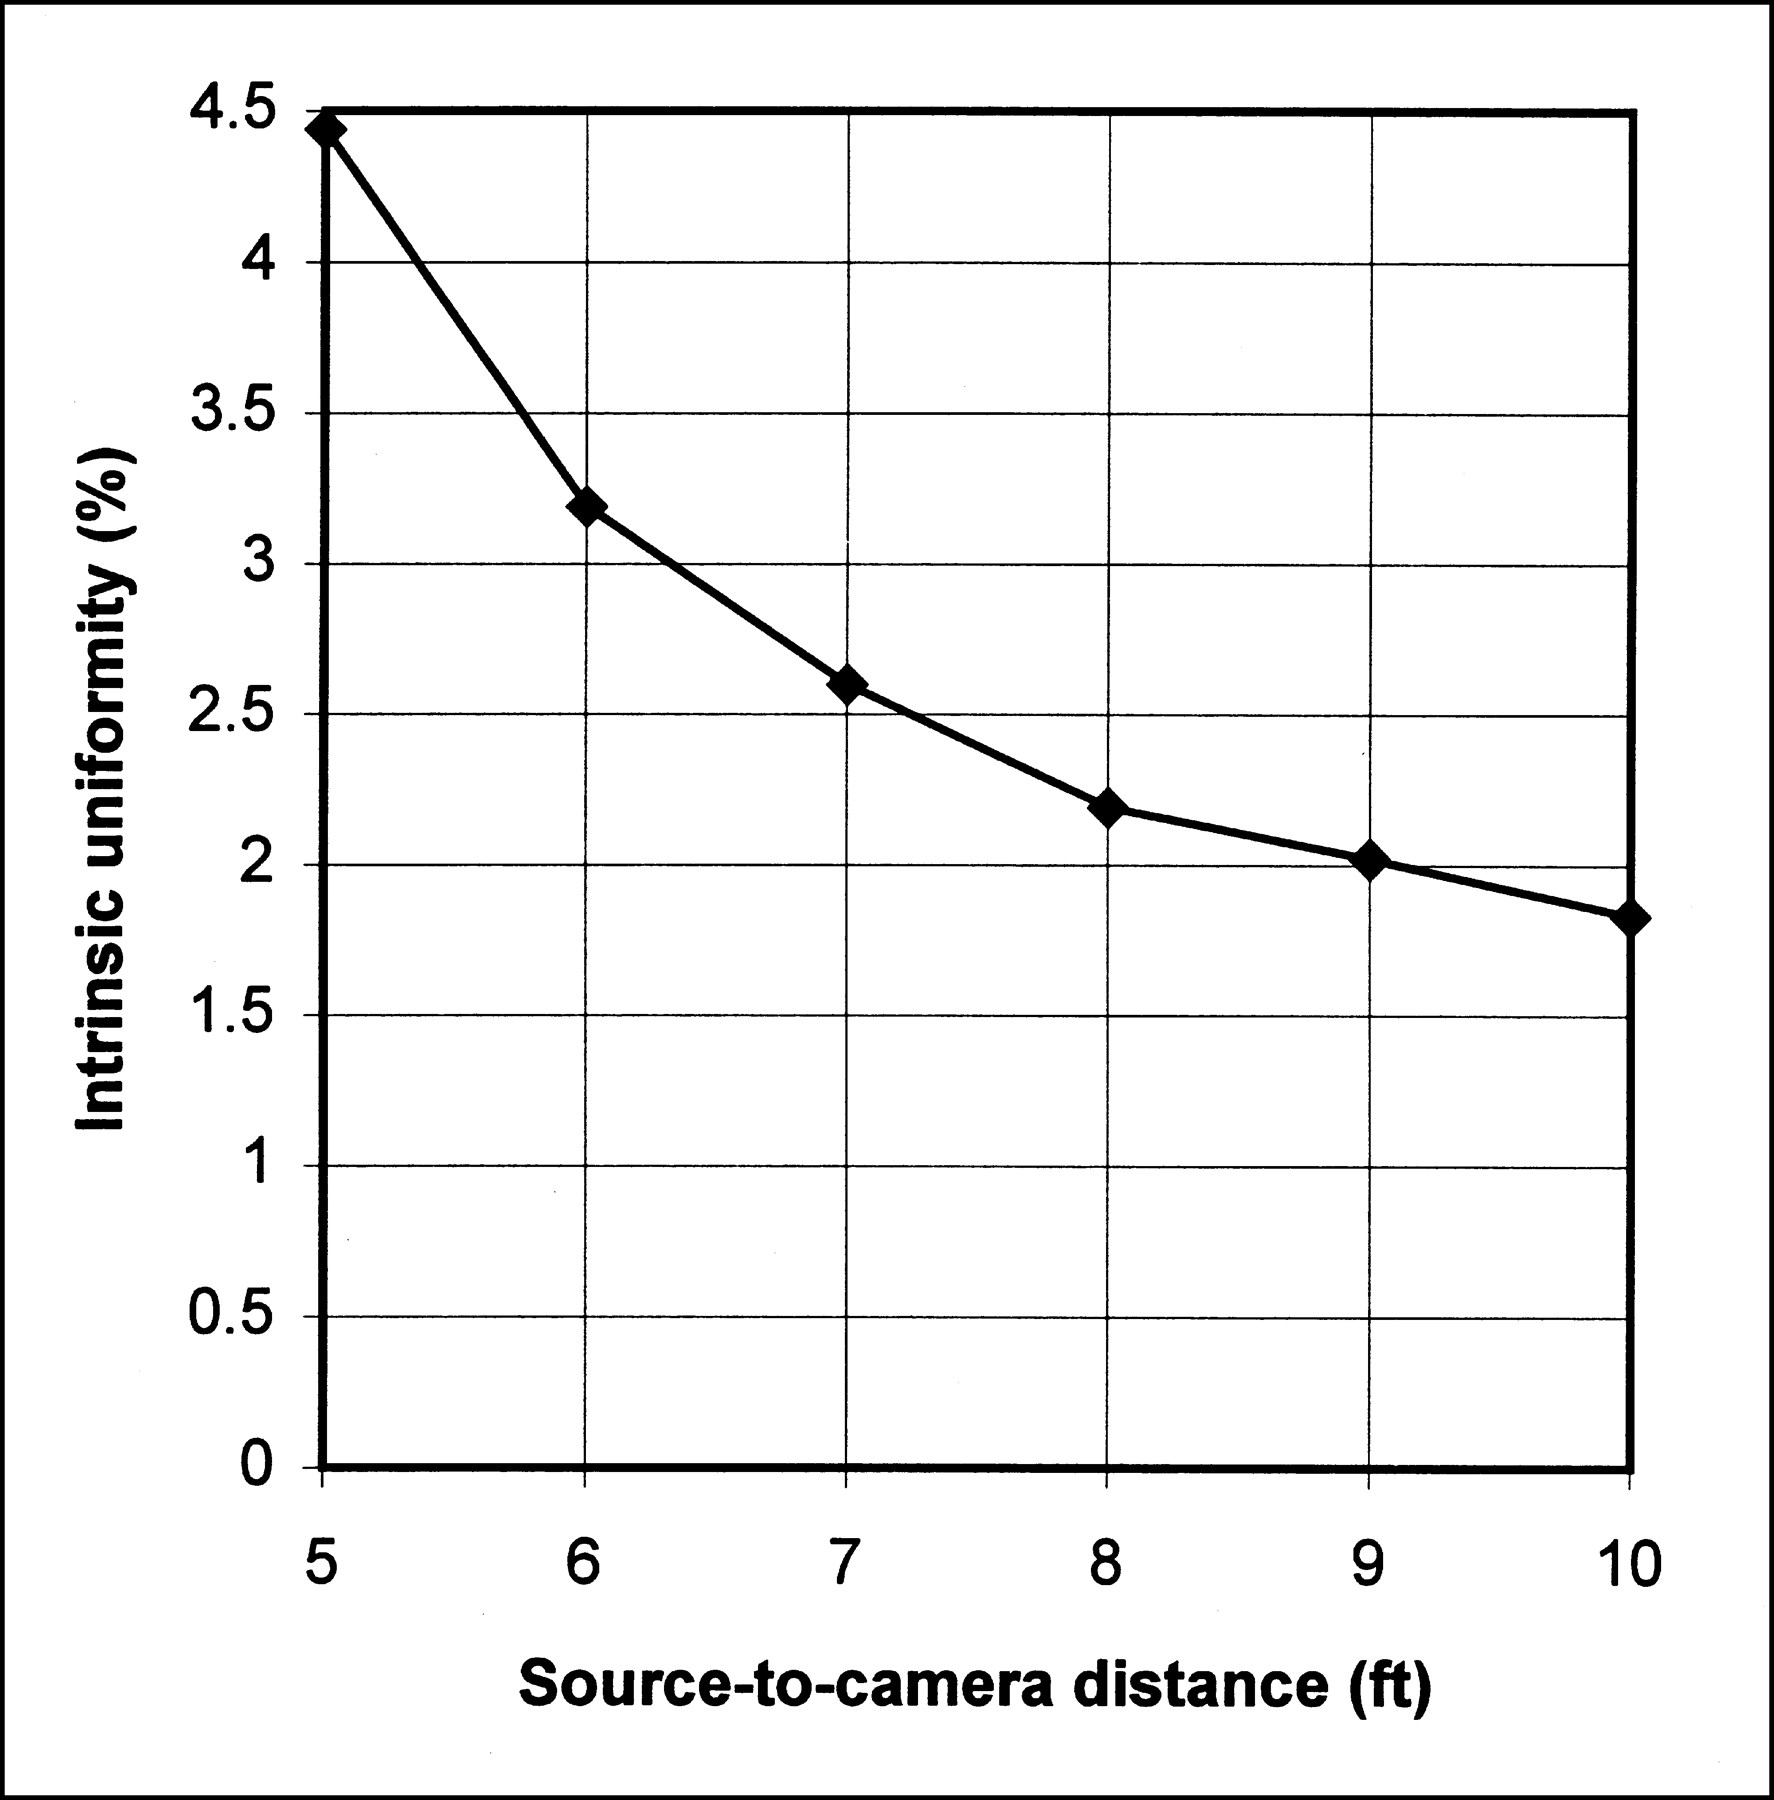
Intrinsic uniformity versus source to camera distance. The intrinsic flood-field uniformity improved with increasing point source-to-camera distance. In our department 10 ft was the maximum distance.
Intrinsic Uniformity Versus Image Matrix Size
Table 1 shows the measured UFOV and CFOV IU of the system at all the available matrix sizes that the flood-field image could be obtained. We used a 2.0–2.2 mCi 99mTc source and acquired 60 M counts for each of these experimental flood-field images. Table 1 shows almost constant IU for both UFOV and CFOV for all available image matrix sizes.
Intrinsic Uniformity at Various Image Matrix Sizes*
Intrinsic Uniformity Versus Source Volume
Figure 4 shows the experimental IU of the system for the CFOV at different source volumes. The 99mTc activity was 2.0–2.2 mCi and the number of acquired counts was 30 M for each flood-field image acquired. Figure 4 shows that the IU of the system slightly degraded as the source volume increased. For source volumes up to 0.3 mL, the IU is almost constant (≈1.5%).

Intrinsic uniformity versus point source volume. The intrinsic flood-field uniformity was constant for source volumes up to 0.3 mL.
Relative Sensitivity and Dead Time
To estimate the dead time of our gamma-camera system (Genesys; ADAC, Milpitas, CA) we measured the effect of the source activity on the system counting rate in the same geometry as we usually measure the IU as shown in Figure 5. From Figure 5 we concluded that the system was paralyzable and that the maximum observed counting rate R0max ≈ 74 kcps.

Counting rate versus point source activity. The maximum observed counting rate R0max ≈ 74 kcps.
According to Sorensen and Phelps (1), the system dead time τ may be estimated for a paralyzable system using the equation:
 where e is the base of natural logarithm.
For R0max = 74 kcps, the dead time is estimated to be approximately 4.97 μs.
For a more accurate determination of the system dead time, we used the two-source method described in Sorenson and Phelps (1) and Early and Sodee (2). Two 99mTc point sources, with approximately the same activity (≈ 1.25 mCi each), which together produced a total counting rate R12 ≈ 55 kcps, were used. While these sources were decaying, we measured the counting rates R1, R12, and R2 followed by R2, R12, and R1 for 10 different total counting rates R12 in the range 55–34 kcps. R1 and R2 are the counting rates produced by the first and second sources, respectively. The system dead time for each counting rate was determined using the equation:

The dead time of the system was determined to be τ = 4.5 ± 0.2 μs using the two-point source method.
DISCUSSION
Intrinsic Uniformity
Various authors (1–6) have suggested different protocols for performing QC tests for intrinsic uniformity (IU) and relative sensitivity (RS) for a gamma-camera system. Table 2 summarizes the main parameters of these protocols. A 99mTc point source in a syringe was used to acquire the flood image and all authors suggested a 20% discriminator window around the 140-keV gamma camera. We noticed that the main differences between the various protocols were:
The counting rate at which the IU test should be performed. The suggestions for this parameter varied widely from <10 K cps (3) to 70 K cps (2). It is important to check the system at both low counting rates and high counting rates to ensure that the uniformity remains acceptable (2).
The number of counts required for the flood image. One manufacturer (5) suggested 15 M counts in a 512 × 512 image matrix size, whereas NEMA (4) suggests ≥10,000 counts in the central pixel of the image (corresponding to ≥41 million counts for 64 × 64 matrix size) and the American Society of Nuclear Cardiology (6) suggests 4500 counts/cm2 (corresponding to ≈ 11 million for an LFOV camera). Klingensmith et al. (3), Sorensen et al. (1), and Early et al. (2) suggest 2–3 M counts in a 64 × 64 matrix size.
Image matrix size: Klingensmith et al. (3), Sorensen and Phelps (1), and Early and Sodee (2) suggest 64 × 64 × 16 matrix size (in which the cardiac SPECT studies are usually performed), whereas one manufacturer (5) suggests 512 × 512 × 16 and the American Society of Nuclear Cardiology (6) suggests 256 × 256 matrix. NEMA protocol suggests image matrix size, which produces pixel sizes with linear dimension of 6.4 mm ±30% (this corresponds to 64 × 64 matrix for large FOV cameras). It is important to ensure that uniformity is acceptable for all clinically used matrix sizes.
The acceptable value for IU required for SPECT studies is not specified in NEMA (4) and is suggested by a manufacturer (5) for a 512 × 512 matrix size to be < 2.5% for CFOV. Klingensmith et al. (3) recommended the system uniformity of ±1% to avoid artifacts in reconstructed images.
Looking at these different protocols, we were faced with the problem of deciding which set of parameters to use for rapidly performing our daily gamma-camera QC testing. Our results indicated that the best set of image-acquisition parameters and geometry for rapid performance of the daily gamma-camera QC testing of RS and IU in our department were:
Room background < 200 cps.
Point source activity 2.0% ±20% mCi of 99mTc.
Source volume < 0.3 mL.
Source-to-camera distance of 310 cm (about 10 ft).
Number of counts needed to obtain the flood image ≥15 M counts.
Protocols Suggested by Various Authors for Performing Daily Quality Control for Gamma-Camera Systems
CONCLUSION
In the last year, we have used the above protocol for our daily gamma-camera QC. It takes 5–6 min to perform a 15 M count flood image or 10–12 min to acquire a 30 M count flood image (using matrix size 512 × 512). IU has been <2% for 15 M count floods and <1.6% for 30 M count floods.
The dead time value, especially if not specified by the manufacturer, must be determined experimentally under the scatter conditions in each nuclear medicine department. We have used a dead time value of 4.5 μs in our daily calculations of the system RS and have obtained a RS value of 1730 ± 82 cpm/μCi for point source activities in the range of 1.1–3.2 mCi.
ACKNOWLEDGMENTS
The authors thank Hussein M. Abdel-Dayem, MD, and James F. Neuman, MD, DABR, for discussions and valuable assistance with this article.
Footnotes
For correspondence or reprints contact: Abdelhamid A. Elkamhawy, CNMT, Cuero Community Hospital, 2550 N. Esplanade, Cuero, TX 77954; Phone: 361-275-6191 X376; E-mail: abdel{at}dewittec.net.


