


Visual Abstract

Abstract
This study aimed to evaluate the measurement and prognostic ability of the SUVmax of whole-body tumors (SUVmaxwb) in non–small cell lung cancer (NSCLC) patients, comparing high-definition (HD) PET imaging with standard-definition (SD) PET imaging. Methods: The study included 242 consecutive NSCLC patients who underwent baseline 18F-FDG PET/CT from April 2018 to January 2021. Two imaging techniques were used: HD PET (using ordered-subsets expectation maximization with point-spread function modeling and time-of-flight techniques and smaller voxels) and SD PET (with ordered-subsets expectation maximization and time-of-flight techniques). SUVmaxwb was determined by measuring all the tumor lesions in the whole body, and tumor-to-background ratio (TBR) was calculated using the background SUVmean of various body parts. Results: The patient cohort had an average age of 68.3 y, with 59.1% being female. During a median follow-up of 29.6 mo, 83 deaths occurred. SUVmaxwb was significantly higher in HD PET than SD PET, with respective medians of 17.4 and 11.8. The TBR of 1,125 tumoral lesions was also higher in HD PET. Univariate Cox regression analysis showed that SUVmaxwb from both HD and SD PET were significantly associated with overall survival. However, after adjusting for TNM (tumor, node, metastasis) stage, only SUVmaxwb from SD PET remained significantly associated with survival. Conclusion: HD PET imaging in NSCLC patients yields higher SUVmaxwb and TBR, enhancing tumor visibility. Despite this, its prognostic value is less significant than SD PET after adjusting clinical TNM stage. Thus, consideration should be given to using HD PET reconstruction to increase tumor visibility, and SD PET is recommended for NSCLC patient prognostication and therapeutic evaluation, as well as for the classification of lung nodules.
The high-definition (HD) PET reconstruction technique with integration of time of flight (TOF) and the point-spread function (PSF) is now widely commercially available for PET imaging (1). TOF estimates the real location of the positron–electron annihilation and reduces noise, especially in larger body regions (1). PSF reconstruction corrects photon mispositioning due to how the γ-rays interact with the scintillation crystals in both nonoblique and oblique angles (1). This image reconstruction algorithm can improve the spatial resolution and signal-to-noise ratio of PET/CT images (2) and can lead to higher detection rates for small lesions (3). 18F-FDG HD PET has already been reported to improve the sensitivity of nodal staging for malignancies such as lung or breast cancer (4–6) and rectal cancer (7).
Non–small cell lung cancer (NSCLC) patients’ prognosis has been linked to multiple imaging parameters, such as metabolic tumor volume and total-lesion glycolysis and SUVmax within the whole-body tumor burden (SUVmaxwb) on 18F-FDG PET imaging (8). Our extensive literature search could find no study that reports a direct comparison of the prognostic value of SUVmaxwb measured on HD PET and standard definition (SD) PET imaging in NSCLC patients. The purpose of this study was to compare the measurement and prognostic power of SUVmaxwb measured on HD PET imaging reconstructed with integration of PSF and TOF techniques with smaller voxels versus SD PET imaging reconstructed with ordered-subsets expectation maximization and TOF techniques on baseline PET/CT images of NSCLC patients.
MATERIALS AND METHODS
Patient Recruitment
The institutional review board approved this retrospective study, and the requirement to obtain informed consent was waived. We performed a retrospective review of the medical records of patients with NSCLC. We merged the list of PET/CT cases performed at the University of Chicago Medical Center between April 2018 and January 2021, using our Siemens Biograph mCT (Siemens Healthcare) scanner, with the list of NSCLC patients diagnosed and treated at our institution. This information was obtained from our cancer registry database. From these 2 sources, we identified 242 consecutive NSCLC patients for this study, based on the following inclusion criteria: all patients had undergone a pretherapy baseline PET/CT scan with our mCT, none of the patients had known brain metastasis (as our whole-body PET/CT scans did not cover the entire brain, usually just eyes to thighs), and the patients had no history or concurrent diagnosis of another type of cancer. The purpose of the PET/CT scan for this group of patients was to stage the disease or diagnose lung lesions.
PET/CT Imaging
The baseline18F-FDG PET/CT scans were performed on the study patients in accordance with National Cancer Institute guidelines (9). The patients fasted for at least 4 h before intravenous administration of 370–555 MBq of 18F-FDG. In addition, the serum glucose levels were tested via finger stick sampling before injection.
The 18F-FDG PET images were acquired on a Siemens Biograph mCT, equipped with lutetium oxyorthosilicate detectors and a 64-detector-row equivalent CT. The PET camera had a bed position length of 22.1 cm and a bore 78 cm in diameter.
A whole-body unenhanced CT scan with no intravenous contrast administration was performed first for PET attenuation correction and fusion of PET with CT images. We used a standard protocol for the CT with 120 kVp, 70 mAs (quality reference mAs for dose modulation), a transaxial field of view 50 cm in diameter, a tube rotation time of 0.5 s per rotation, and a pitch of 1.5.
Ninety ± 30 min after injection of the 18F-FDG, a whole-body static PET scan was acquired for about 15–20 min, starting at the thighs and proceeding to the head. PET scans were obtained with an acquisition time of 3 min per cradle position, with 45% bed overlap to avoid artifacts.
The reconstructions were performed using HD and SD PET for all study patients. For HD PET, reconstructions were performed with PSF plus ordered-subsets expectation maximization plus TOF, 3 iterations, 21 subsets, a 2-mm gaussian filter, and 1.85 × 1.85 × 2.03 mm voxels. The image matrix was 400 × 400 pixels. For SD PET, reconstructions were performed with the 3-dimensional (ordered-subsets expectation maximization) iterative algorithm plus TOF, 2 iterations, 21 subsets, a 4.5-mm gaussian filter, and 2.89 × 2.89 × 3.00 mm voxels. The image matrix was 256 × 256 pixels. In contrast to SD PET, the HD PET reconstruction algorithm incorporates a specific correction for the PSF. We used a 3-dimensional imaging mode with model-based scatter correction. Daily calibrations were conducted using a 68Ge tub phantom.
Analysis of 18F-FDG PET Data
The SUV was calculated using Equation 1. (Eq. 1)
The SUVmax, metabolic tumor volume (MTV), and total-lesion glycolysis (TLG) for all tumor lesions throughout the body were measured by segmenting each tumor in the attenuation-corrected SD PET/CT images. This was done with the gradient method outlined in previous studies (1,10), using the PET Edge tool from MIMvista software. The measurements were conducted by one of the authors, a radiologist who has over 20 y of experience in clinical nuclear medicine and PET. He was aware of the clinical information but remained uninformed about the patients’ survival status and survival time. He used the MIMvista software along with our PACS to detect, characterize, and segment tumor lesions. This involved analyzing PET/CT images (including attenuation-corrected, maximum-intensity projection, and fusion images) and relevant diagnostic CT images and reports. The tumor segmentation was only performed on the SD PET/CT images, and the tumor contours were copied directly from SD PET to HD PET/CT images. The SUVmax MTV and TLG for each body tumor were recorded in a Microsoft Excel spreadsheet. The highest SUVmax across all lesions, termed SUVmaxwb, was identified. This comprehensive approach ensured no omission of the highest SUVmaxwb. Additionally, the percentage difference in SUVmaxwb was calculated, defined as Equation 2. (Eq. 2)
The whole-body MTV, which is the sum of all individual tumor MTVs, and the whole-body TLG, which is the sum of all individual tumor TLGs, were also calculated.
For calculating the tumor-to-background ratio (TBR) of all lesions, background SUVmean was measured in specified areas in normal lung, right atrial blood pool, right liver lobe, and a lumbar vertebral body (diameters of the background regions were at least twice the full width at half maximum). These measurements facilitated the calculation of TBR for primary lung tumors and mediastinal nodal, soft-tissue, and bony metastases, respectively. TBR is defined as the ratio of tumor SUVmax to the SUVmean of the corresponding background (10). The background SUVmean of the lung, blood pool, liver, and bone was used for calculating the TBR of lung tumoral lesions, chest nodal metastasis, soft-tissue metastases (including liver, spleen, and muscle metastases), and bony metastases, respectively. The percentage difference in TBR was calculated as Equation 3. (Eq. 3)
Statistical Analysis
Statistical analyses were performed using Stata software version 14. The SUVmaxwb measurements in all study patients and the TBRs of all tumoral lesions of the patients were compared using a nonparametric Wilcoxon signed-rank test, since the data were not normally distributed. The comparison of background SUVmean of normal lung, right atrial blood pool, normal liver, and bone on SD and HD PET was performed with paired samples t tests, as the data were normally distributed. The overall survival (OS) was considered the primary endpoint and defined as the time from baseline PET/CT to the time of any cause of mortality. Univariate and multivariate analyses were performed with Cox proportional-hazards regression models to test for an association with the primary endpoint, OS. A P value of less than 0.05 from a 2-tailed test was considered significant. Kaplan–Meier curves were plotted to visualize the time dependance of survival in the 2 patient groups stratified by the median of SUVmaxwb, and a log-rank test was performed to compare the curves. This was done for both HD and SD.
RESULTS
Comparison of HD and SD Measurements for SUVmaxwb and TBR
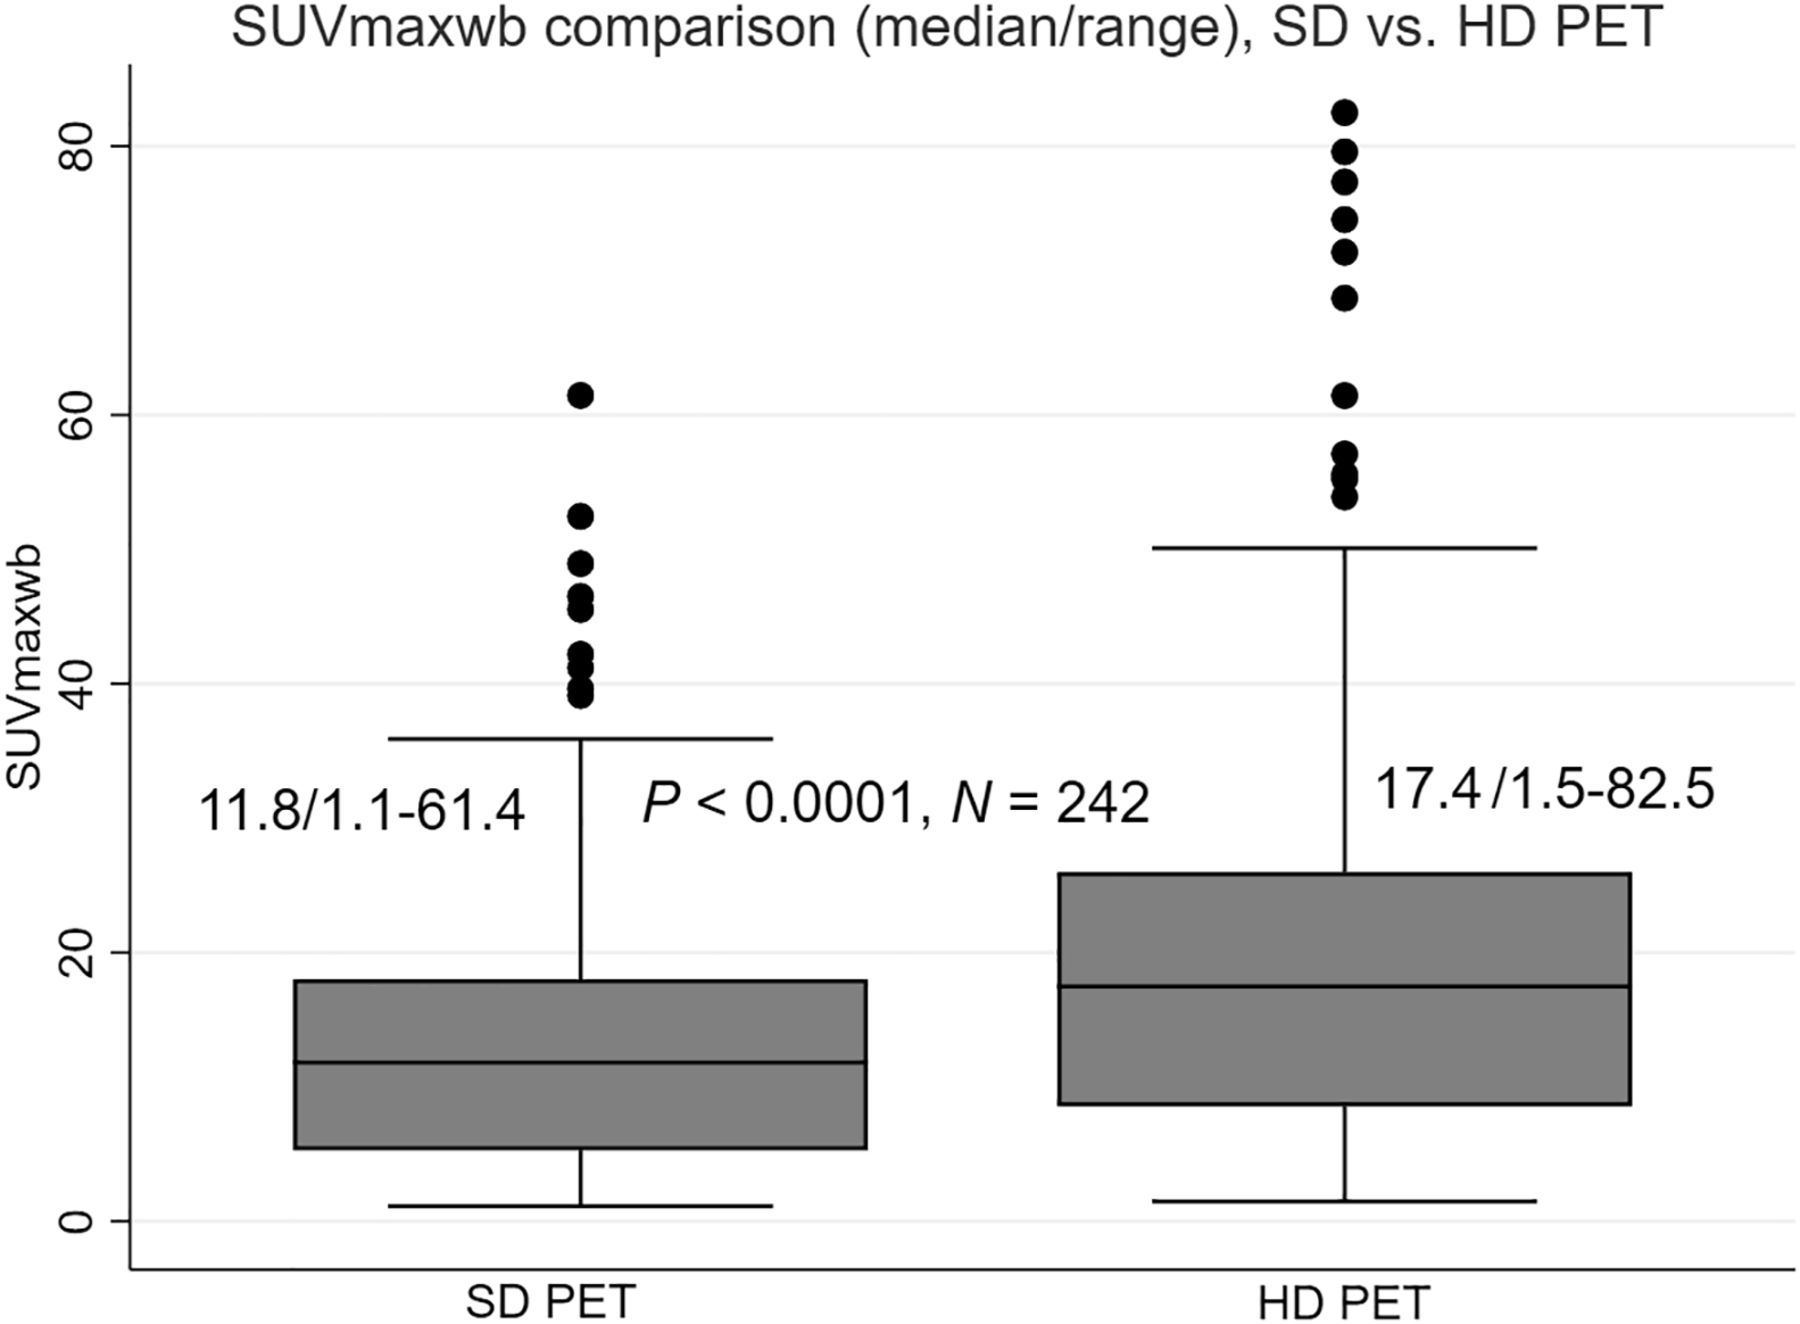
The SUVmaxwb was significantly greater in HD PET scans, with a median value of 17.4 (ranging from 1.5 to 82.5), than in SD PET scans, which had a median value of 11.8 (ranging from 1.1 to 61.4). This difference was statistically significant (P < 0.0001, n = 242) as illustrated in Figure 1. Additionally, the median percentage difference in SUVmaxwb between the HD and SD PET was 47.7%, with a range of 12.8%–227.6%.

Box plots of SUVmaxwb measured on SD and HD PET are positively skewed and significantly different, using Wilcoxon signed-rank test.
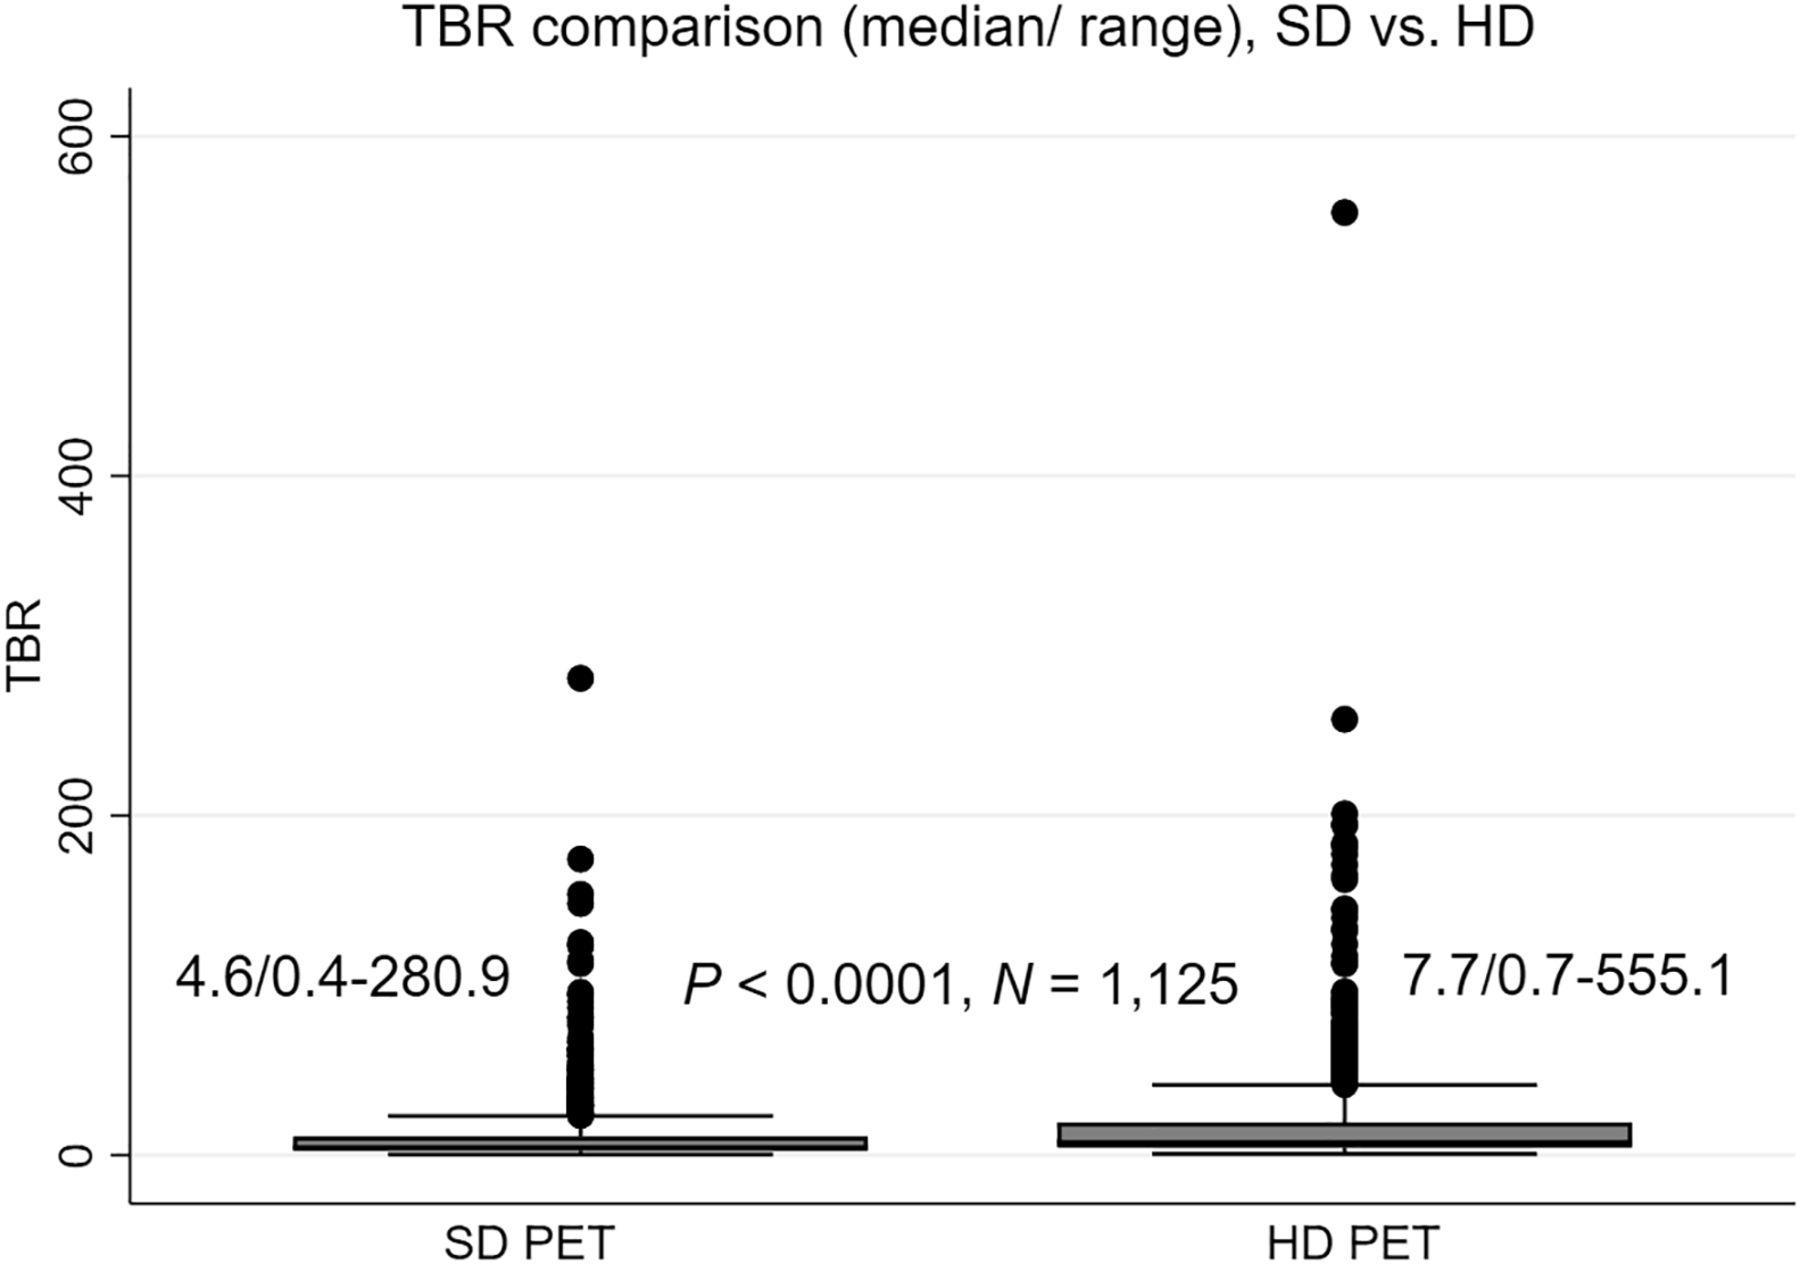
The TBR for tumor lesions in all patients was significantly higher in HD PET, with a median value of 7.7 (ranging from 0.7 to 555.1), than in SD PET, with a median of 4.6 (ranging from 0.4 to 280.9). This difference was statistically significant (P < 0.0001, n = 1125) as illustrated in Figure 2. Furthermore, the median percentage difference in TBR was 61.8%, with a range of 3.3%–359.8% across the 1,125 tumor lesions.

Box plots of TBR measured on SD and HD PET are positively skewed and significantly different, using Wilcoxon signed-rank test.
Comparison of HD and SD Measurements for Normal-Background SUVmean
The background SUVmean of lung parenchyma measured on SD PET (mean, 0.444; n = 242) was 1.37% greater than that measured on HD PET (mean, 0.438; n = 242, P < 0.01). The background SUVmean of the right atrial blood pool measured on SD PET (mean, 1.582; n = 242) was 0.54% greater than that measured on HD PET (mean, 1.573; n = 242, P < 0.01). The background SUVmean of the liver measured on SD PET (mean, 2.206; n = 242) was 0.36% greater than that measured on HD PET (mean, 2.199; n = 242, P < 0.01). The background SUVmean of the vertebral body bone measured on SD PET (mean, 2.259; n = 24) was 2.9% lower than that measured on HD PET (mean, 2.324; n = 24, P < 0.01). The graphical comparison of the background SUVmean is in Supplemental Figure 1 (supplemental materials are available at http://jnmt.snmjournals.org).
Comparison of Prognostic Value of SUVmaxwb with HD Versus SD
A total of 242 patients was included in the analysis, The mean age was 68.3 y. There were 99 male and 143 female patients. There were 91 patients with clinical stage I NSCLC, 25 with clinical stage II, 72 with clinical stage III, and 54 with clinical stage IV. One hundred patients were treated surgically, 106 were treated nonsurgically, and 36 did not receive cancer-specific therapy (Table 1). Over a median follow-up of 29.6 mo among survivors, there were 83 deaths.
Characteristics of 242 Study NSCLC Patients
Univariate Cox regression analysis revealed that SUVmaxwb on both HD and SD PET was significantly associated with OS, with hazard ratios of 1.027 (range, 1.015–1.038; P < 0.0001) and 1.046 (range, 1.028–1.065; P < 0.001), respectively. Other clinical variables that were statistically significantly associated with OS included clinical TNM stage, cancer treatment, patient’s age, and Eastern Cooperative Oncology Group performance score (all P < 0.05). However, the patient’s sex, race, smoking history, and tumor histology were not statistically associated with OS (all P > 0.05).
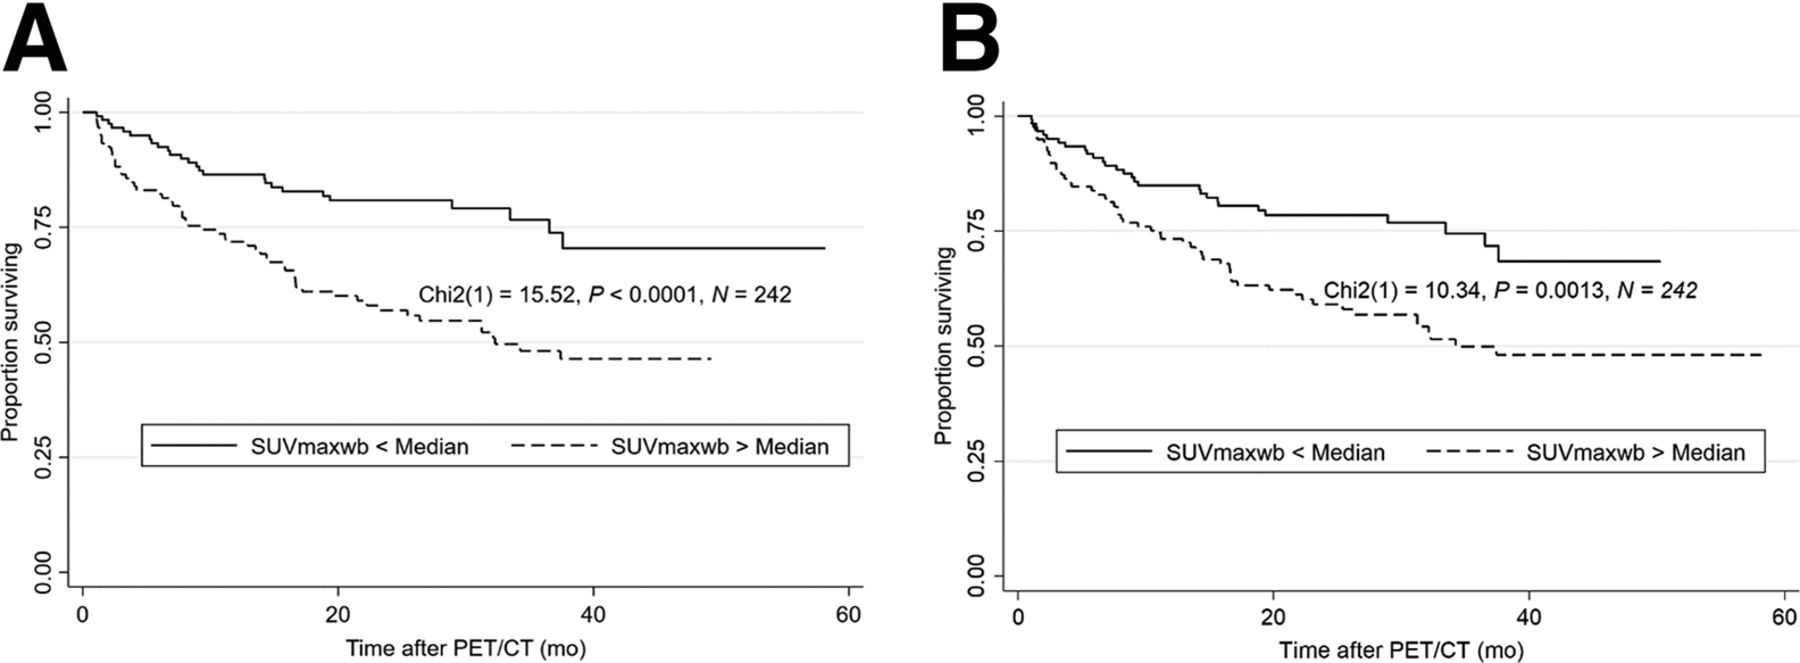
After adjusting for clinical TNM stage in a multivariate Cox regression analysis, we found SUVmaxwb on SD PET to be significantly associated with survival (hazard ratio, 1.022; 95% CI, 1.001–1.043; P = 0.04). However, there was no significant association between SUVmaxwb on HD PET and survival after adjusting for clinical TNM stage (hazard ratio, 1.010; 95% CI, 0.996–1.024; P = 0.16). The Kaplan–Meier curves of all the study patients dichotomized by median SUVmaxwb on SD PET imaging and on HD PET imaging are shown in Figure 3. Log-rank testing showed a statistically significant association of SUVmaxwb with OS of patients on SD PET imaging (P < 0.0001) and on HD PET imaging (P = 0.0013).

Kaplan–Meier curves of OS after baseline PET/CT dichotomized by median of SUVmaxwb measured on SD PET (A) and HD PET studies (B), showing significant association of SUVmaxwb with OS on both SD and HD PET studies.
Prognostic Value of Whole-Body MTV and Whole-Body TLG on HD Versus SD PET
Univariate Cox regression analysis revealed that whole-body MTV and whole-body TLG on both HD and SD PET were significantly associated with OS (all P < 0.0001). After adjusting for clinical TNM stage in the multivariate Cox regression analysis, we found whole-body MTV and whole-body TLG on both HD PET and SD PET to be significantly associated with OS (all P < 0.01).
DISCUSSION
The study showed that HD PET provides a statistically significantly higher SUVmaxwb and TBR. These findings indicate that HD PET can improve tumor visibility in NSCLC patients. We think this is primarily because HD PET reconstruction used a PSF-based resolution recovery technique whereas SD PET did not. Other differences between the 2 imaging reconstruction techniques, including the higher resolution (smaller voxel size and higher-resolution gaussian filter) (11) in HD PET than in SD PET, may also affect SUVmaxwb and TBR measurements. Ordered-subsets expectation maximization and TOF were used in both HD and SD PET reconstruction.
In the current study, univariate Cox regression models showed that SUVmaxwb measured on either HD or SD PET was associated with OS. However, in the multivariate Cox regression models, only SUVmaxwb measured on SD PET remained statistically significantly associated with OS after adjusting for clinical TNM stage. Conversely, SUVmaxwb measured on HD PET did not show an association with OS in the same multivariate model. This suggests that SUVmaxwb measured on HD PET has less prognostic value than does an SUVmaxwb measurement taken with SD PET imaging. SUVmaxwb in HD PET has higher sensitivity to noise (natural random variations) than does SD PET. This higher variation with HD PET may account for the lower statistical significance in the OS test.
Our study showed that the PET image reconstruction method can induce a significant difference in SUVmaxwb measurements; the median percentage difference in SUVmaxwb between HD and SD PET was 47.7%. This is clinically significant considering that using the criteria of the European Organization for Research and Treatment of Cancer, a change in SUV of 25% indicates a partial metabolic response or progressive metabolic disease dependent on interval decrease or increase in tumor SUV measurement (12). In PERCIST (13), a change in the peak of SUV corrected for lean body mass (SULpeak) of 30% indicates a partial metabolic response or progressive metabolic disease dependent on interval decrease or increase in tumor SULpeak. The current study demonstrates the importance of using the same acquisition and reconstruction methods in serial studies.
Our study indicated that in routine clinical PET/CT reading, SUV should be measured on SD PET if current guidelines are used. This is because the cutoff for distinguishing benign from malignant lung nodules in the literature was established on PET scanners before HD PET techniques became widely available (14). In addition, for therapeutic evaluation by quantitative comparison of initial and posttreatment PET/CT studies, the classification criteria for response to therapy were also established with SD PET scanner data (13). Our study reiterates that for accurate therapeutic evaluation using SUV measurements, a series of PET/CT studies, both initial and after therapy, should be conducted on the same PET scanner using the same reconstruction method. This is crucial because differences in PET image reconstruction can significantly impact SUV measurements.
There were several limitations to this study. First, it was retrospective. Prospective clinical trials are needed to verify these results. Second, there were relatively small sample sizes for detailed multivariate Cox regression survival analysis. Therefore, in the current study, only clinical TNM stage was used as the covariable in the multivariate models. Other variables, including age, treatment history, and performance status, were not included in the multivariate Cox regression models. It would be necessary to increase the sample size to establish the significance of including additional variables in the multivariate Cox regression model for association of SUVmaxwb with OS. Third, the evaluation of the prognostic value of whole-body MTV and whole-body TLG on HD PET/CT was limited, as tumor segmentation was performed on only the SD PET/CT images, and the tumor contours were copied directly from SD to HD PET/CT images.
CONCLUSION
In NSCLC patients, this study concluded that HD PET provides a statistically significant higher SUVmaxwb and TBR; however, HD PET bears less prognostic value than SD PET. Thus, consideration should be given to using HD PET reconstruction to increase tumor visibility. SD reconstruction is recommended for NSCLC patient prognostication and therapeutic evaluation, as well as for classification of lung nodules.
DISCLOSURE
No potential conflict of interest relevant to this article was reported.
KEY POINTS
QUESTION: Does HD PET imaging improve the measurement and prognostic power of SUVmaxwb in NSCLC patients compared with SD PET imaging?
PERTINENT FINDINGS: In a study involving 242 NSCLC patients, SUVmaxwb and TBR were higher for HD PET than for SD PET. However, only SUVmaxwb from SD PET remained significantly associated with OS after adjusting for TNM stage, despite the higher tumor visibility provided by HD PET.
IMPLICATIONS FOR PATIENT CARE: Although HD PET imaging enhances tumor visibility through a higher SUVmaxwb and TBR, the prognostic value for NSCLC patient survival is more reliably determined using SD PET after considering clinical TNM stage.
ACKNOWLEDGMENT
We thank Yan Che, MS, a senior biostatistician, for statistical guidance.
Footnotes
Published online Jul. 17, 2024.
REFERENCES
- Received for publication February 29, 2024.
- Accepted for publication May 29, 2024.


