


Article Figures & Data
Figures
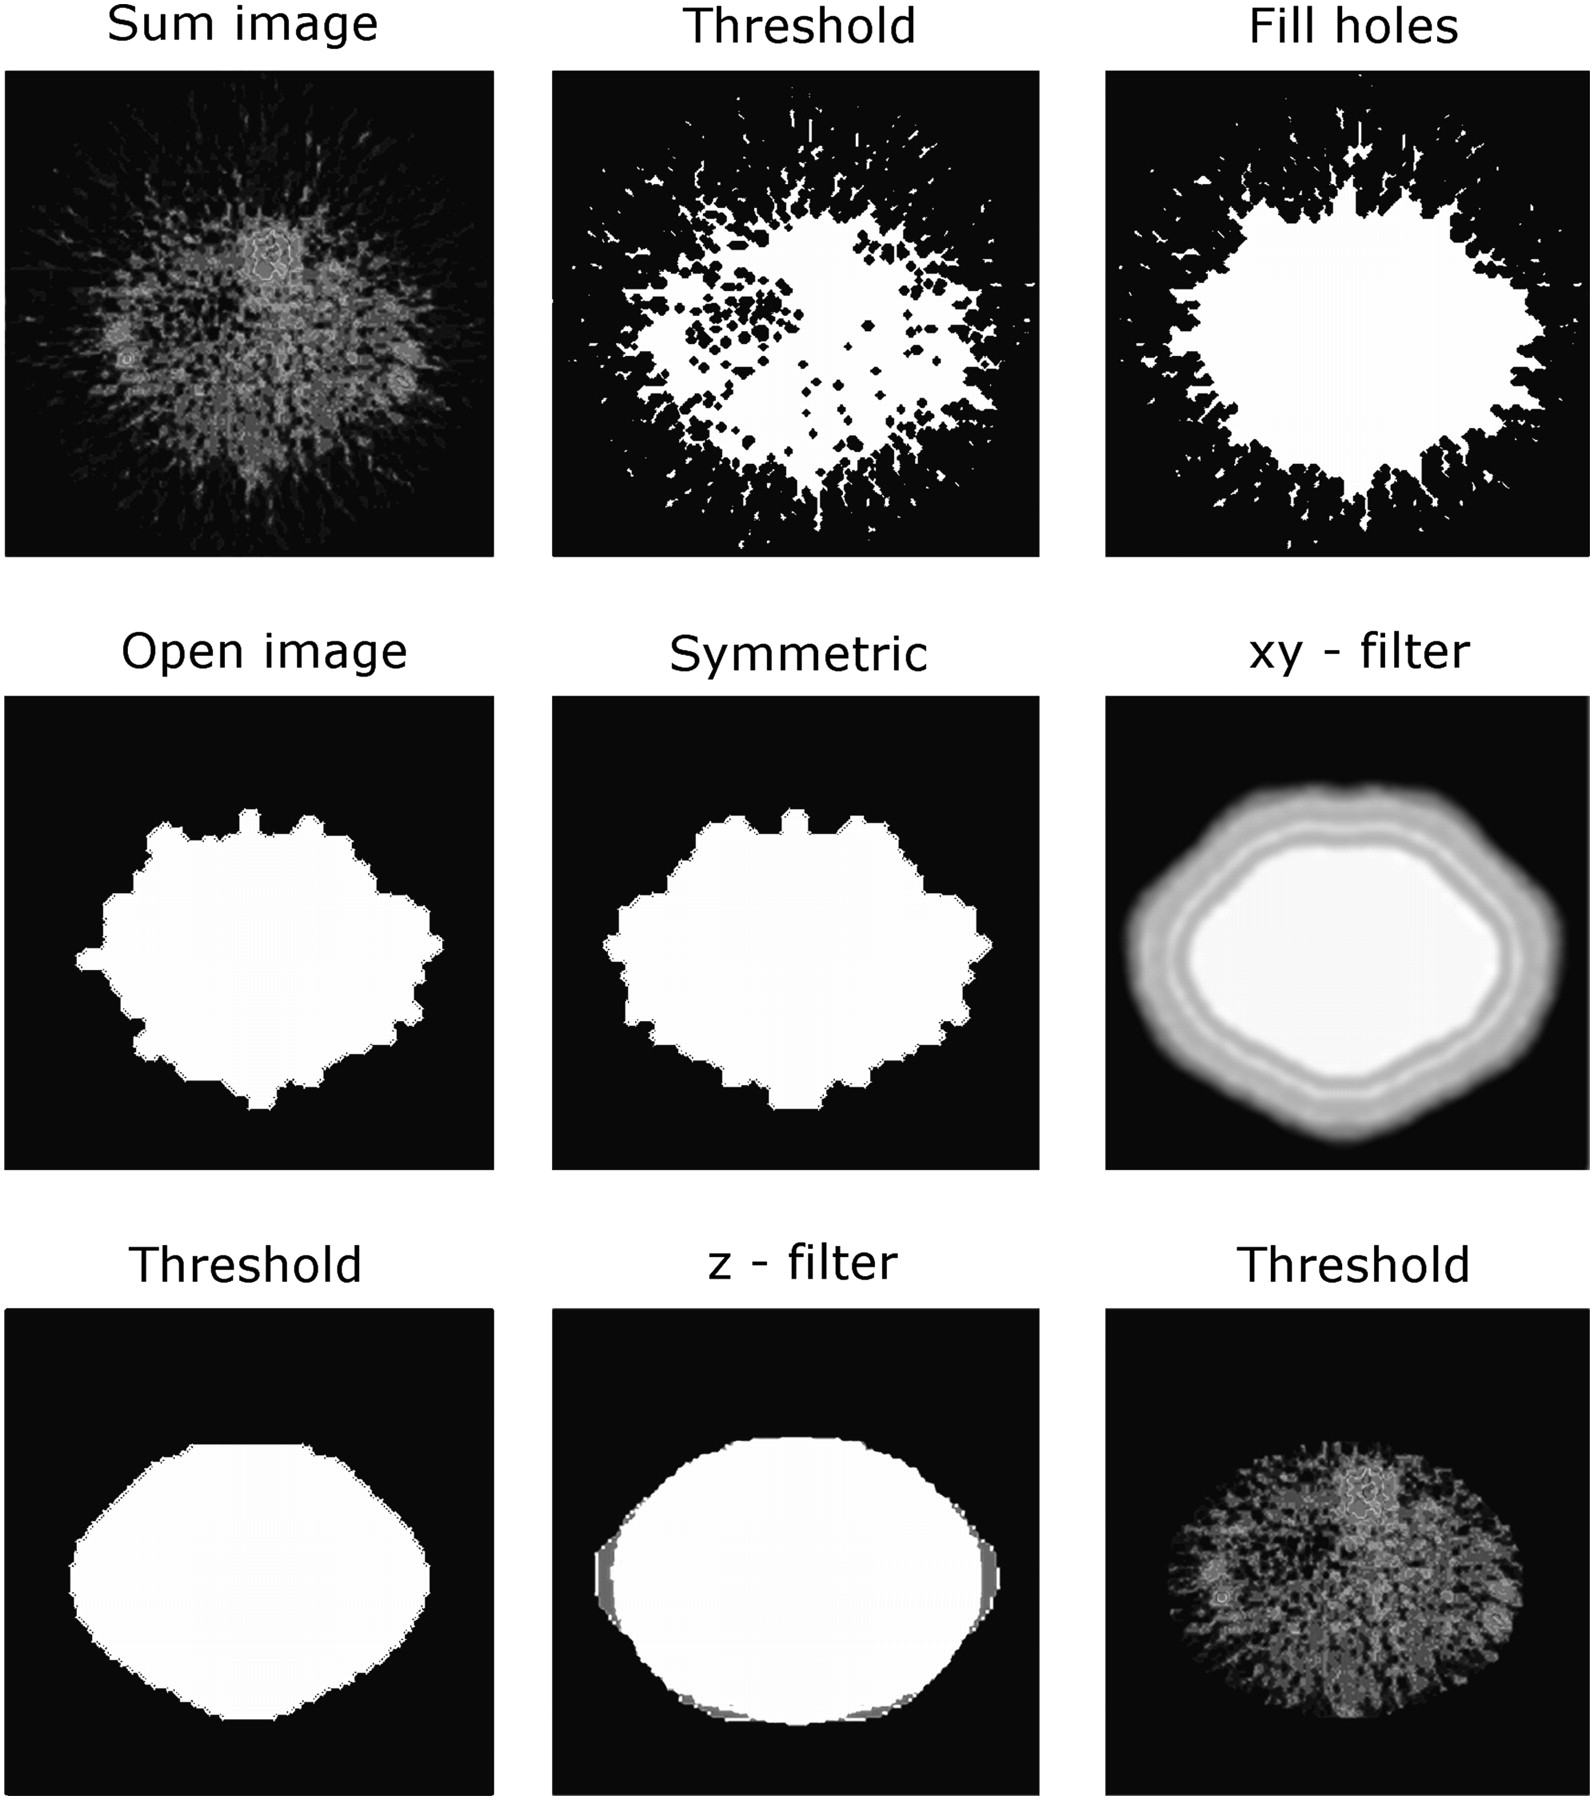
- FIGURE 1.
Step-by-step masking of PET series created in small-animal PET study of rat with 18F tracer. Results shown were obtained after masking steps for slice 30 of 61.
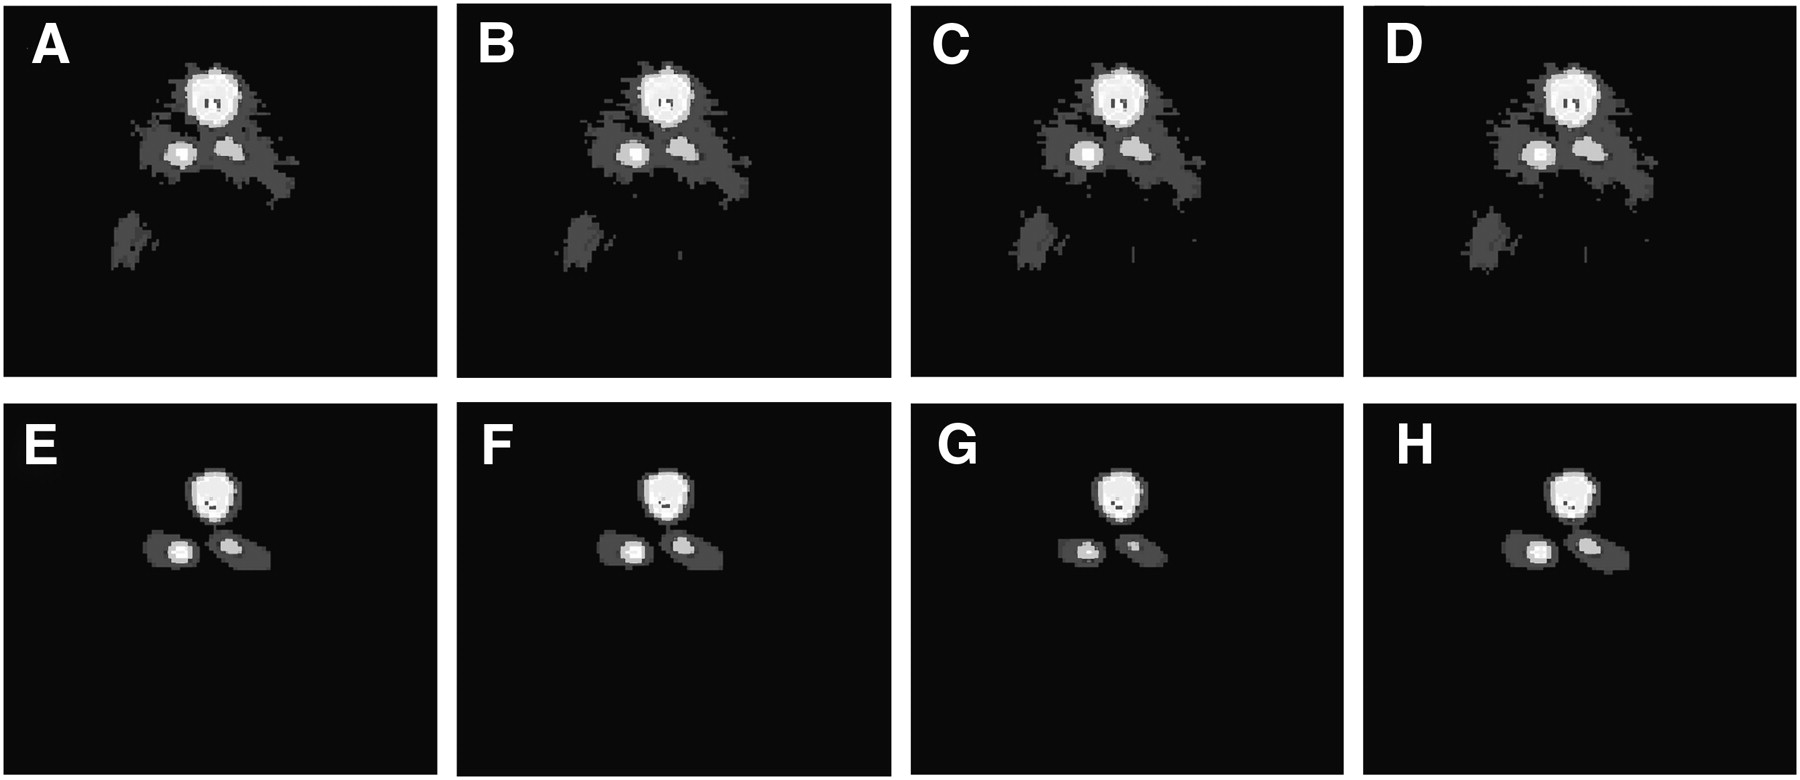
- FIGURE 2.
Slice 31 of 61 from MVW-PC1 images of mouse data. Time protocols had frame lengths of 1 min (A and E), 2 min (B and F), 5 min (C and G), and 10 min (D and H). Spine is clearly visible in upper portions of images. There are no visible differences among time protocols. (A color version of this figure is available as a supplemental file online at http://tech.snmjournals.org.)
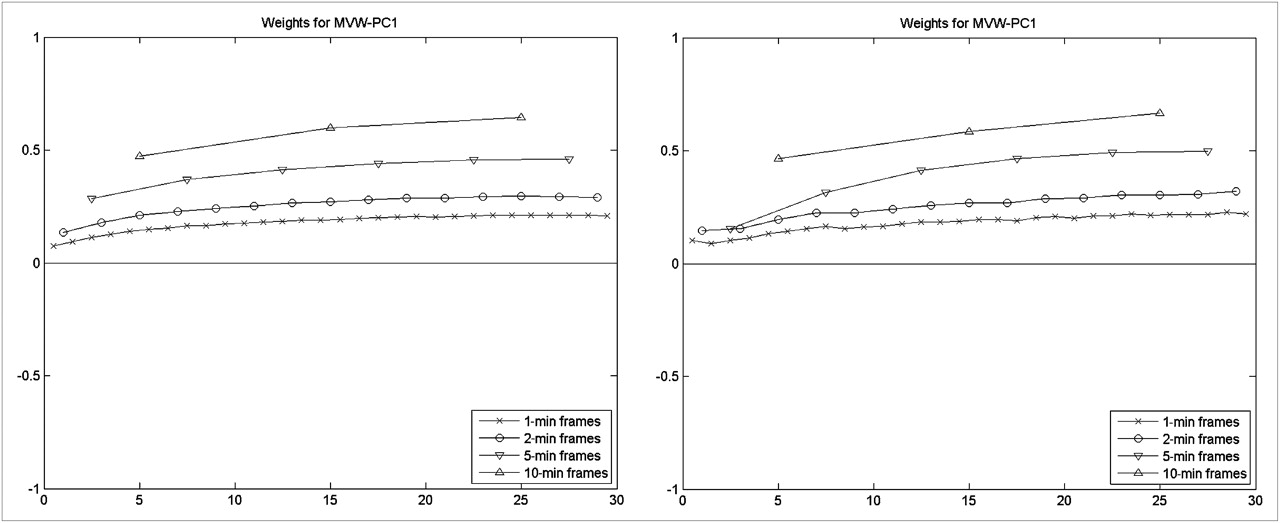
- FIGURE 3.
Weight factors for MVW-PC1 images of mouse data. (Left) Weight factors for FBP-reconstructed images. (Right) Weight factors for OSEM-reconstructed images. In both cases, MVW-PC1 is close to mean image.
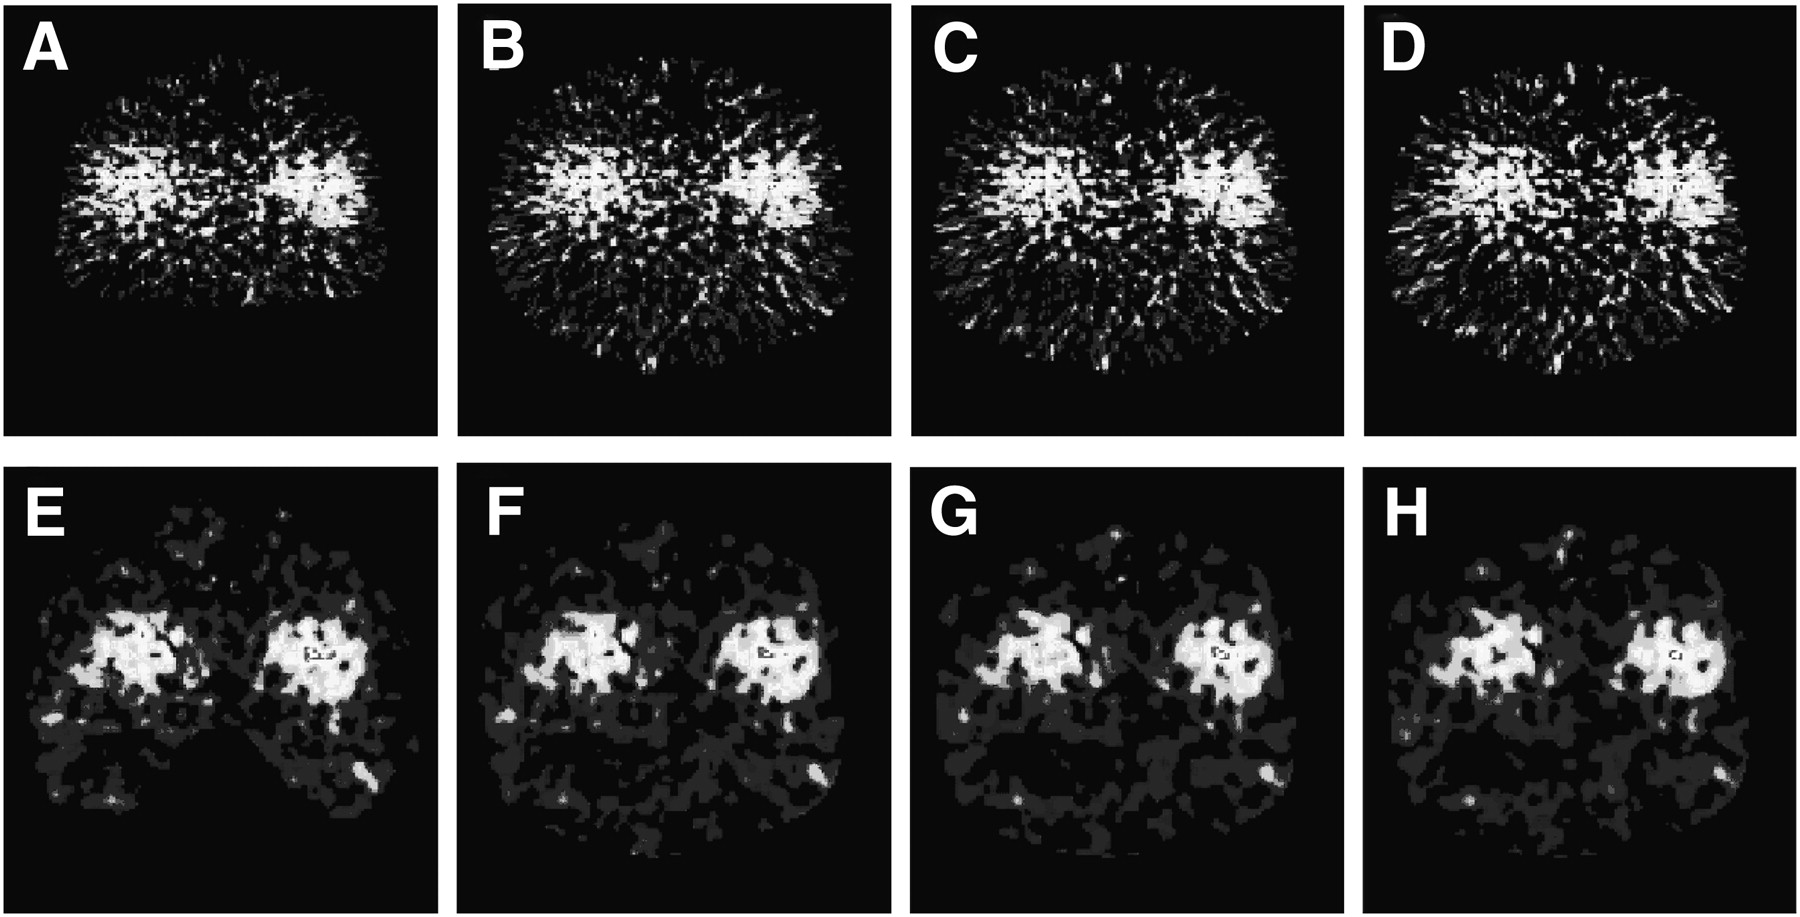
- FIGURE 4.
Slice 31 of 61 from MVW-PC1 images of data acquired in rat study. Time protocols had frame lengths of 1 min (A and E), 2 min (B and F), 5 min (C and G), and 10 min (D and H). Spine is clearly visible in upper portions of images. Kidneys are visible in left and right portions of images. There are almost no visible differences among time protocols. (A color version of this figure is available as a supplemental file online at http://tech.snmjournals.org.)
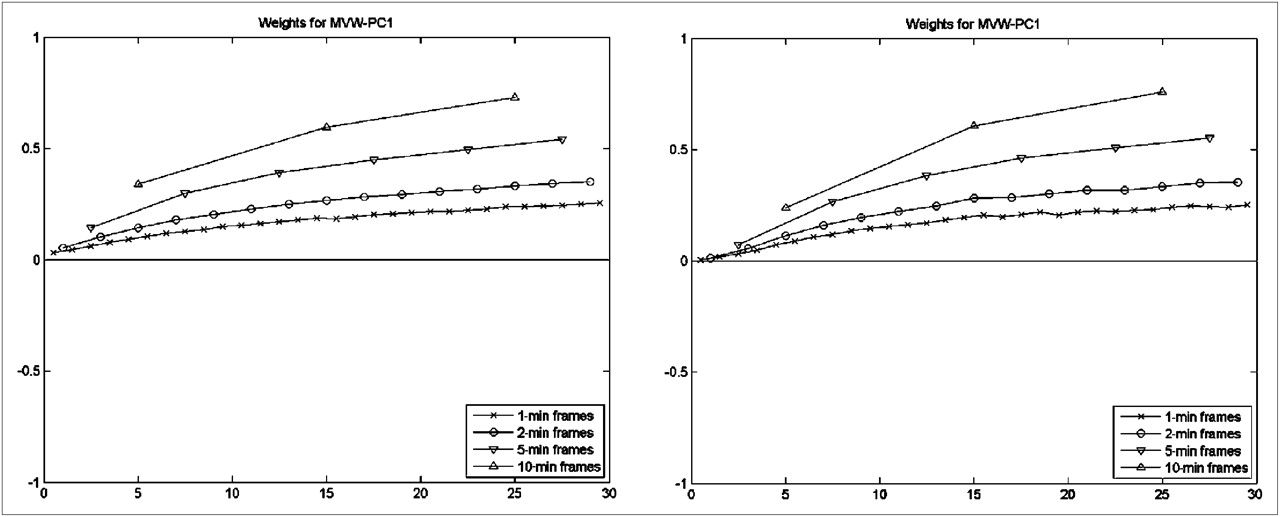
- FIGURE 5.
Weight factors for MVW-PC1 images of rat data. (Left) Weight factors for FBP-reconstructed images. (Right) Weight factors for OSEM-reconstructed images. In both cases, MVW-PC1 assigns higher weights to later frames, which typically contain less noise than earlier frames.
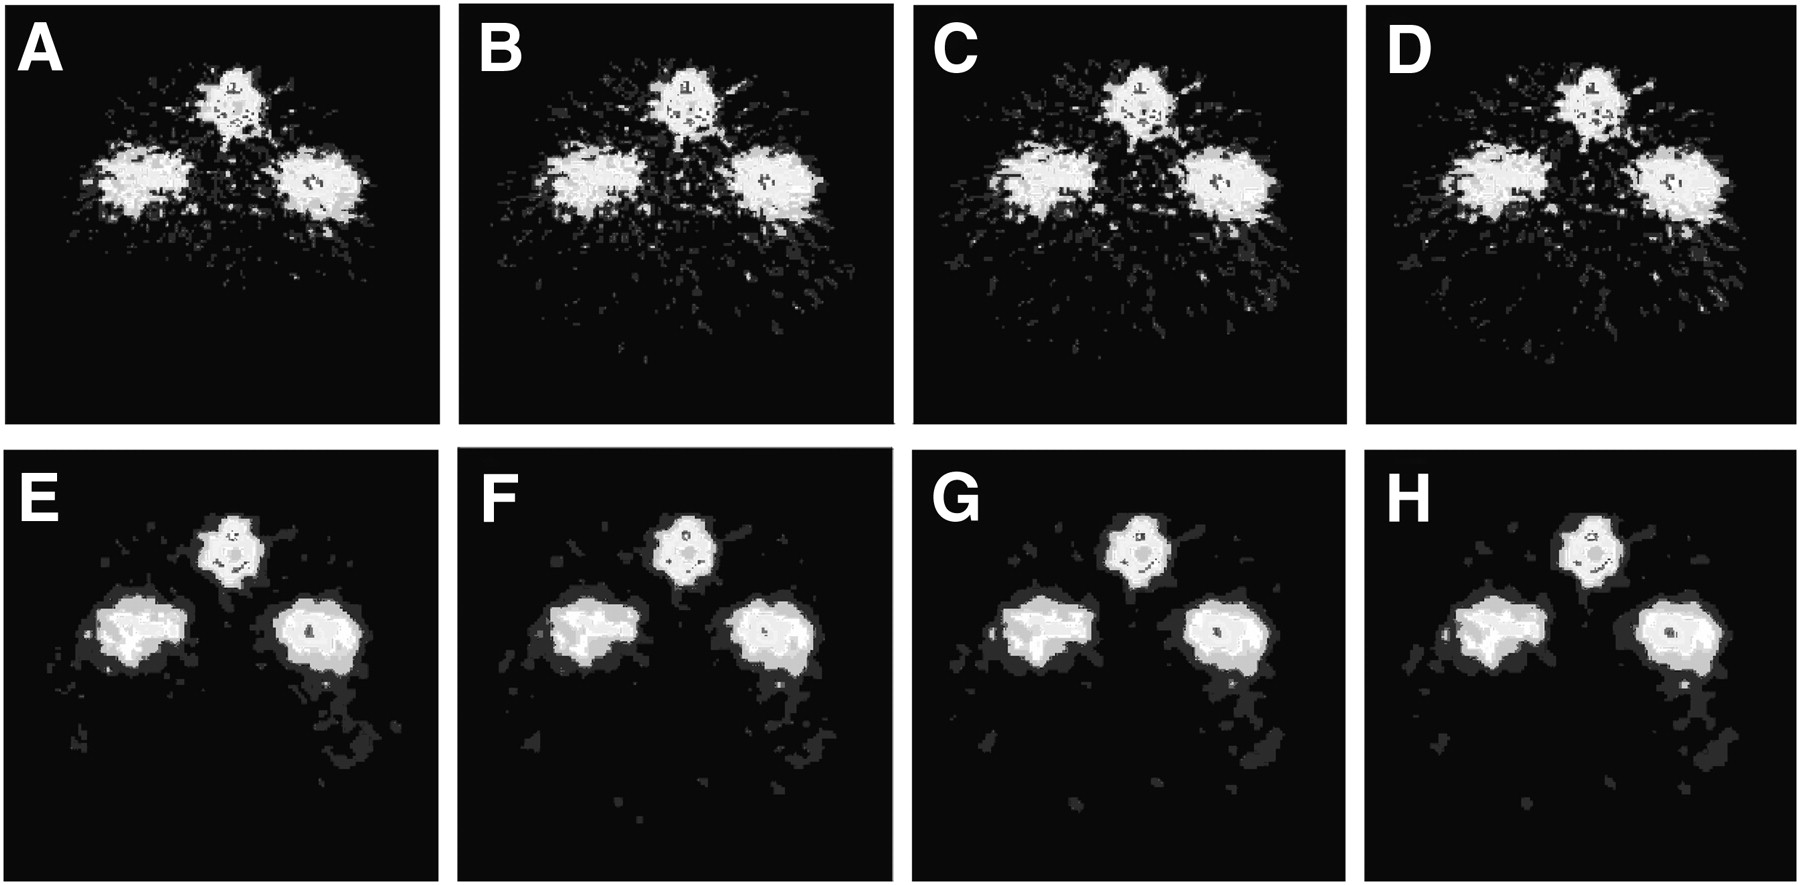
- FIGURE 6.
Slice 31 of 61 from MVW-PC2 images of data acquired in mouse study. Time protocols had frame lengths of 1 min (A and E), 2 min (B and F), 5 min (C and G), and 10 min (D and H). Kidneys and urinary tract are clearly visible in images. Differences among time protocols are slight, especially for comparison of spine in upper portions of A and D. Spine in G has slightly higher amplitude than spine in E, F, and H. (A color version of this figure is available as a supplemental file online at http://tech.snmjournals.org.)
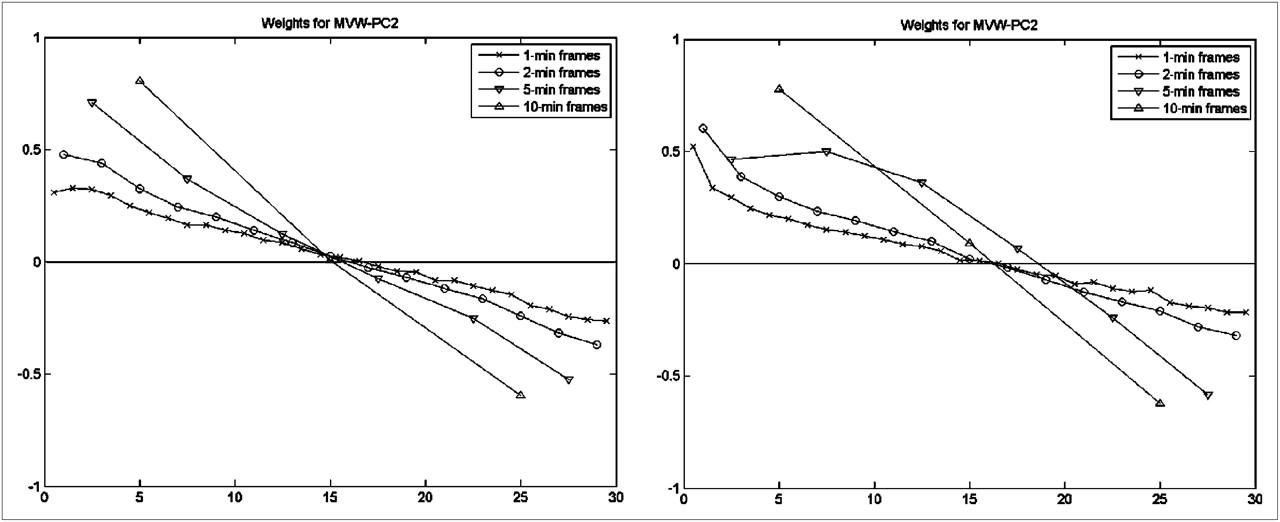
- FIGURE 7.
Weight factors for MVW-PC2 images of mouse data. (Left) Weight factors for images reconstructed with FBP. (Right) Weight factors for images reconstructed with OSEM. In both cases, MVW-PC2 assigns higher weights to earlier frames, which show higher signal intensity in kidneys, and negative weights in second half of scan, in which kidneys show little activity.
- FIGURE 8.
Slice 31 of 61 from MVW-PC2 images of data acquired in rat study. Time protocols had frame lengths of 1 min (A and E), 2 min (B and F), 5 min (C and G), and 10 min (D and H). Kidneys and urinary tract are clearly visible in middle portions of images. There are small but visible differences among OSEM-reconstructed images (E–H). (A color version of this figure is available as a supplemental file online at http://tech.snmjournals.org.)
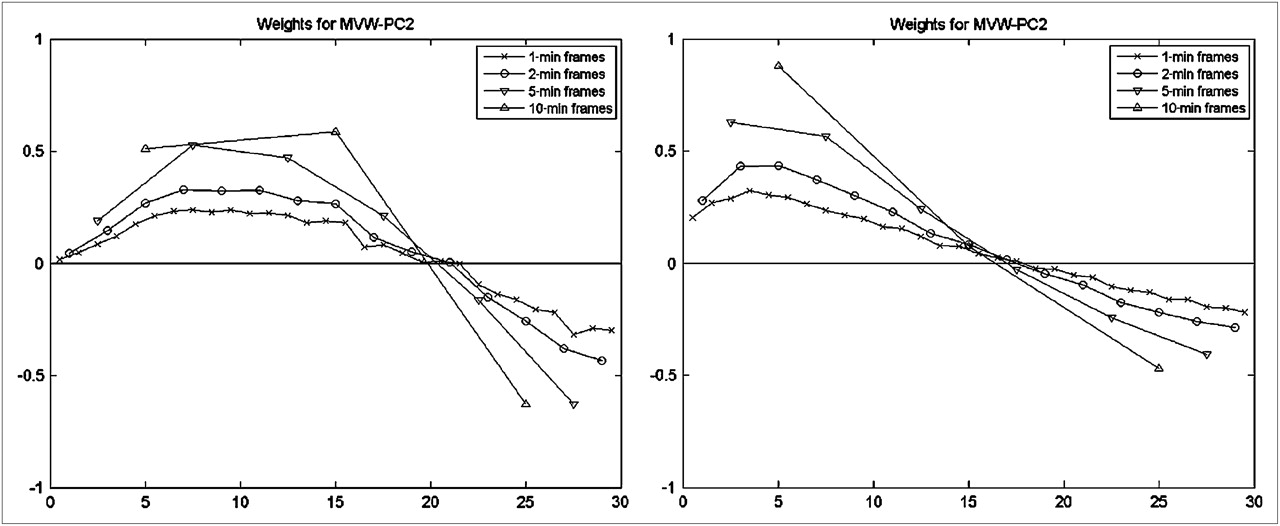
- FIGURE 9.
Weight factors for MVW-PC2 images of rat data. (Left) Weight factors for images reconstructed with FBP. (Right) Weight factors for images reconstructed with OSEM. In both cases, MVW-PC2 assigns higher weights to first half of frames, which contain higher signal intensity in kidneys, and negative weights in last part of scan, in which kidneys have little activity. There are differences between FBP and OSEM in shapes of weight factors, especially in beginning of scan, in which weight factor for OSEM-reconstructed data (right) is close to 0 in first part of scan.
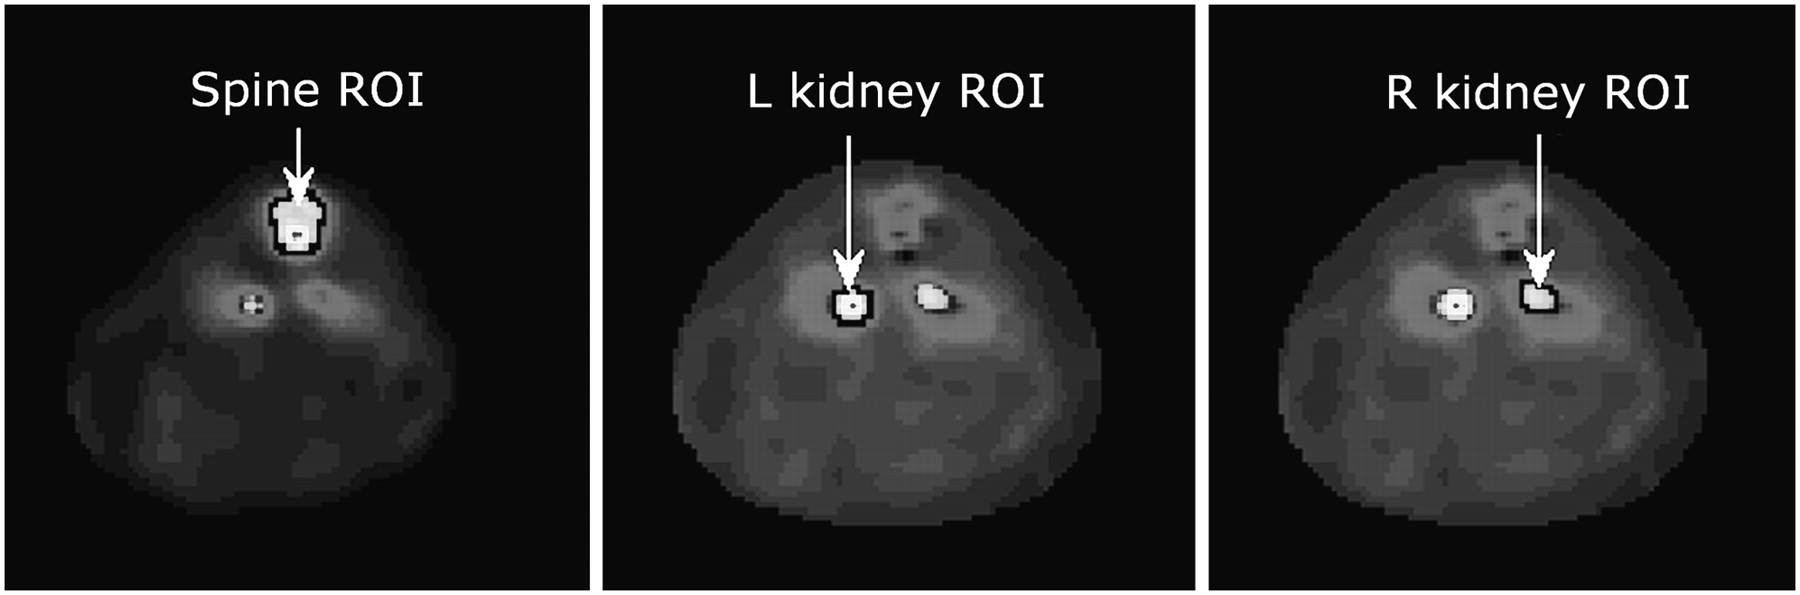
- FIGURE 10.
Regions of interest (ROIs) used to calculate time–activity curves shown in Figure 11. ROIs are drawn on MVW-PC1 image for spine and on MVW-PC2 images for kidneys. (A color version of this figure is available as a supplemental file online at http://tech.snmjournals.org.)
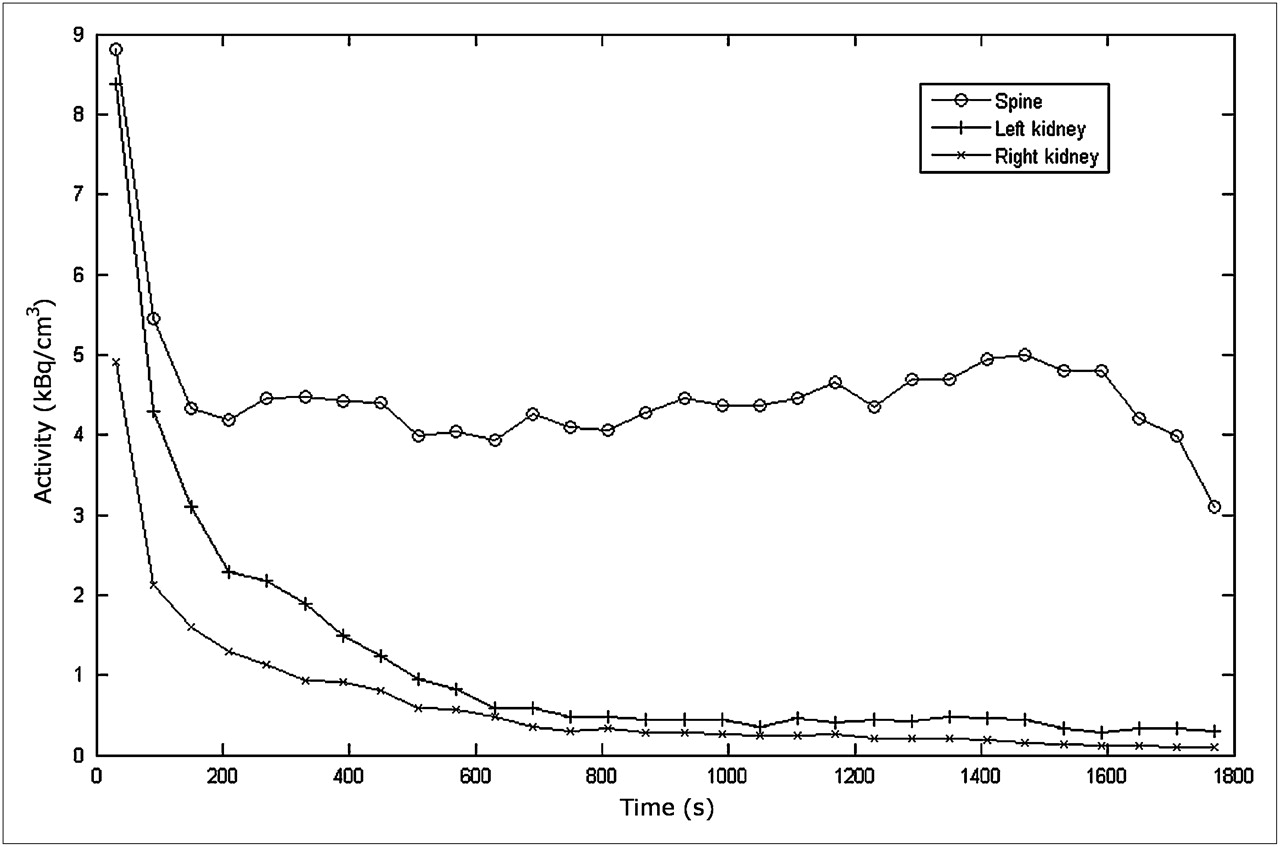
- FIGURE 11.
Time–activity curves for spine and left and right kidneys. Activity data were collected from 1-min frame of original dataset obtained from scanned mouse and reconstructed with FBP.


Additional Files
Supplemental Data
Files in this Data Supplement:


