


Article Figures & Data
Figures
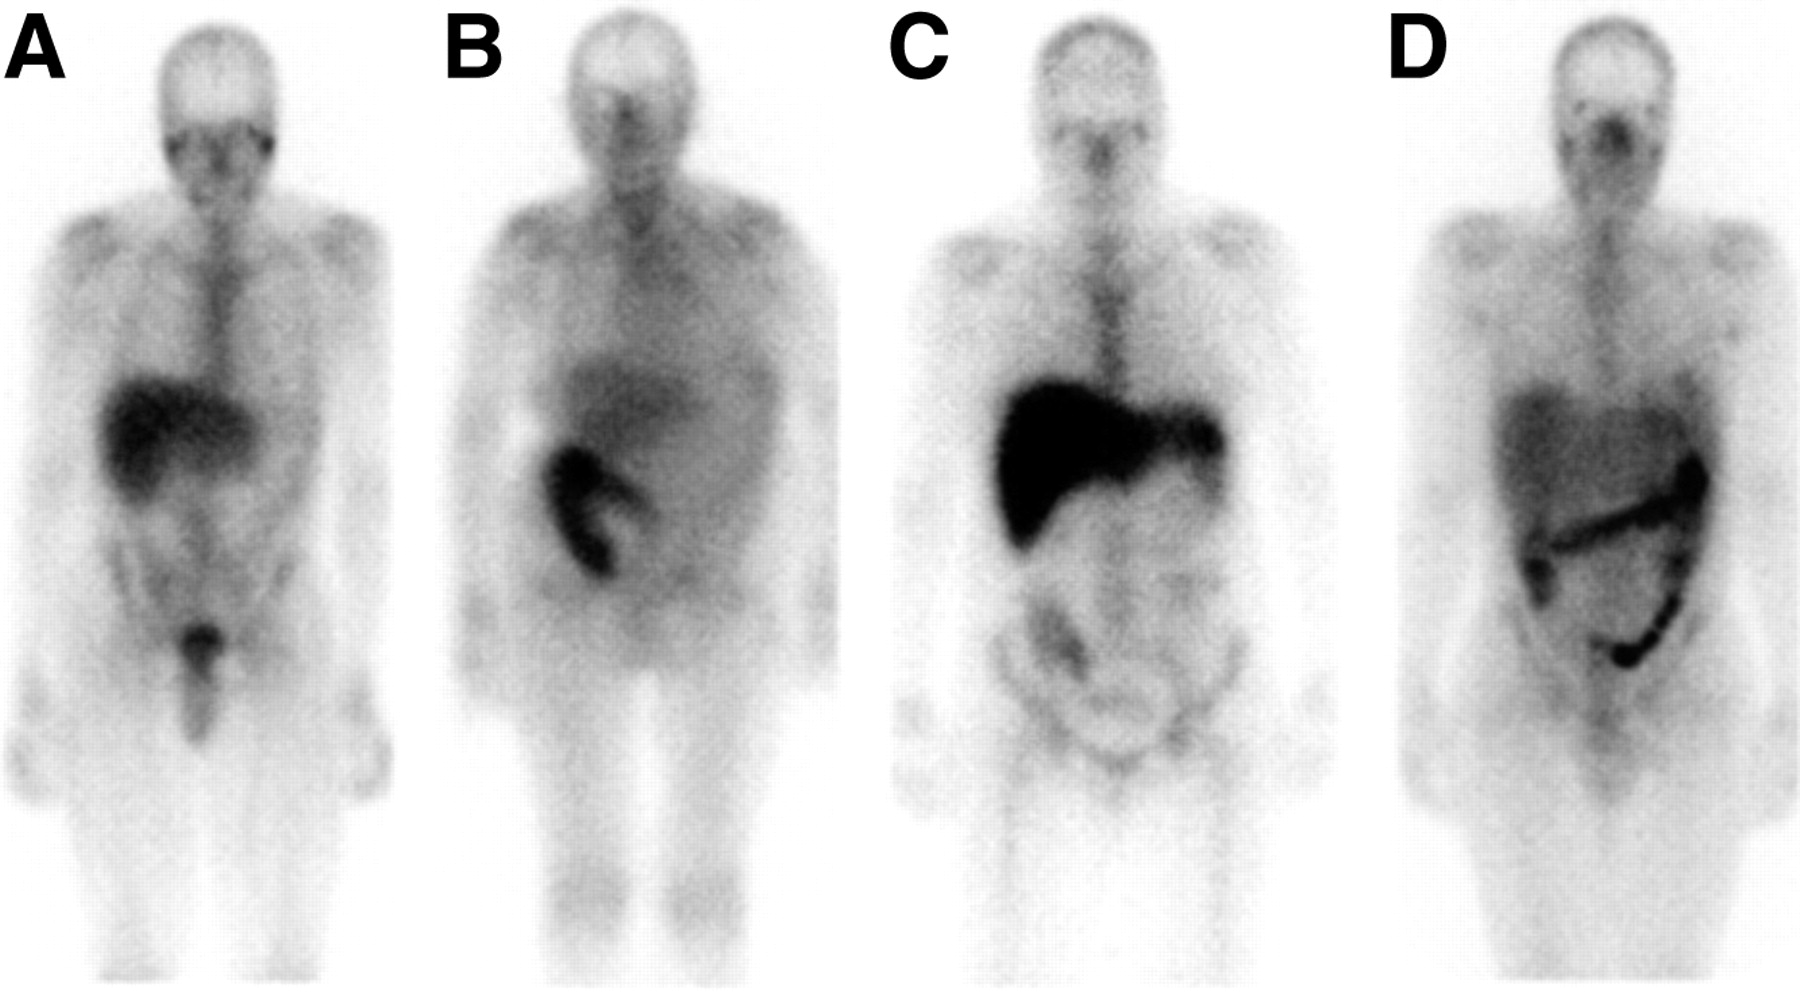
- FIGURE 1.
The normal distribution of activity on 67Ga studies is variable. (A) The skeleton and liver are well visualized and there is faint activity in the colon. (B) Skeletal and hepatic uptake is much less intense, whereas intense activity is present in the proximal colon. (C) The skeleton is well defined, hepatic activity is intense, and the colonic activity, confined to the proximal ascending colon, is faint. (D) Nasopharyngeal activity is prominent, and pancolonic activity is intense.
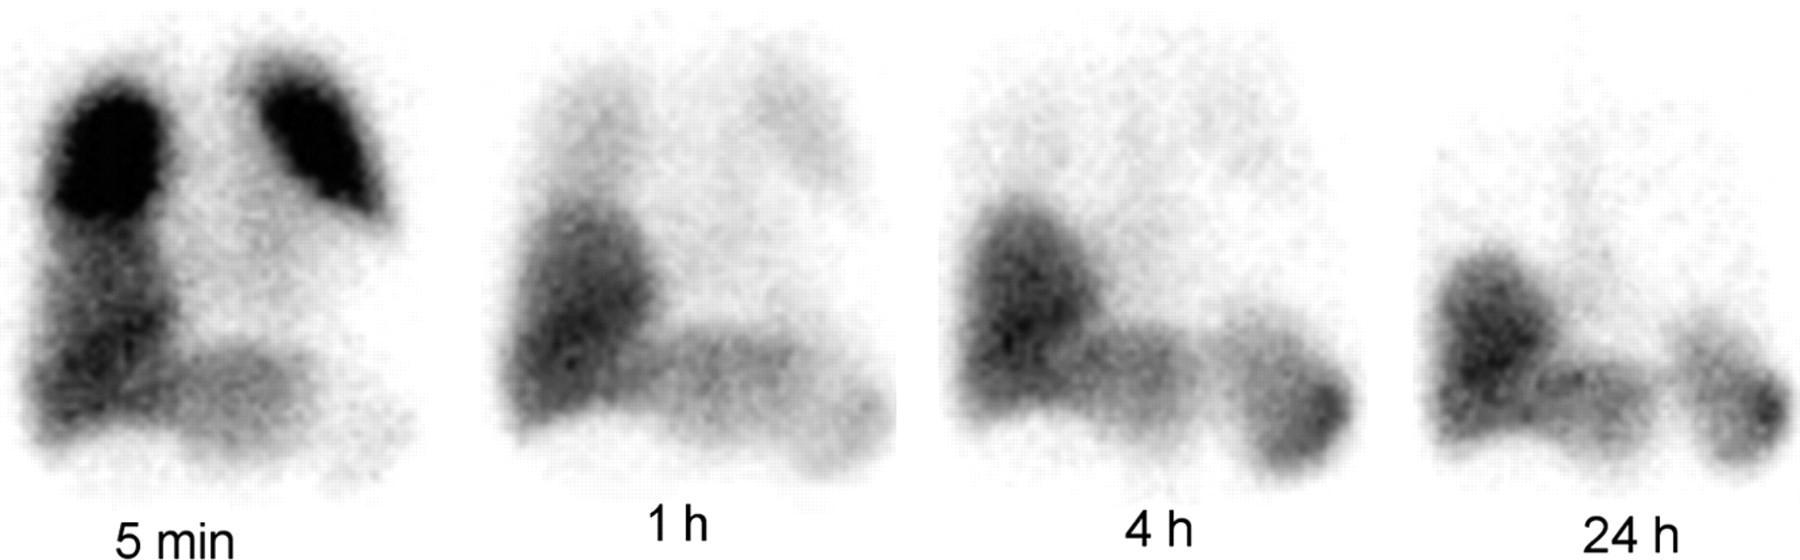
- FIGURE 2.
Immediately after injection of labeled leukocytes, intense activity is normally seen in the lungs. This activity decreases rapidly as the leukocytes leave the lungs, until by 4 h, little activity above background remains. Because of this phenomenon, the lungs should be evaluated only on images obtained more than 4 h, and preferably at 24 h, after injection of labeled cells.
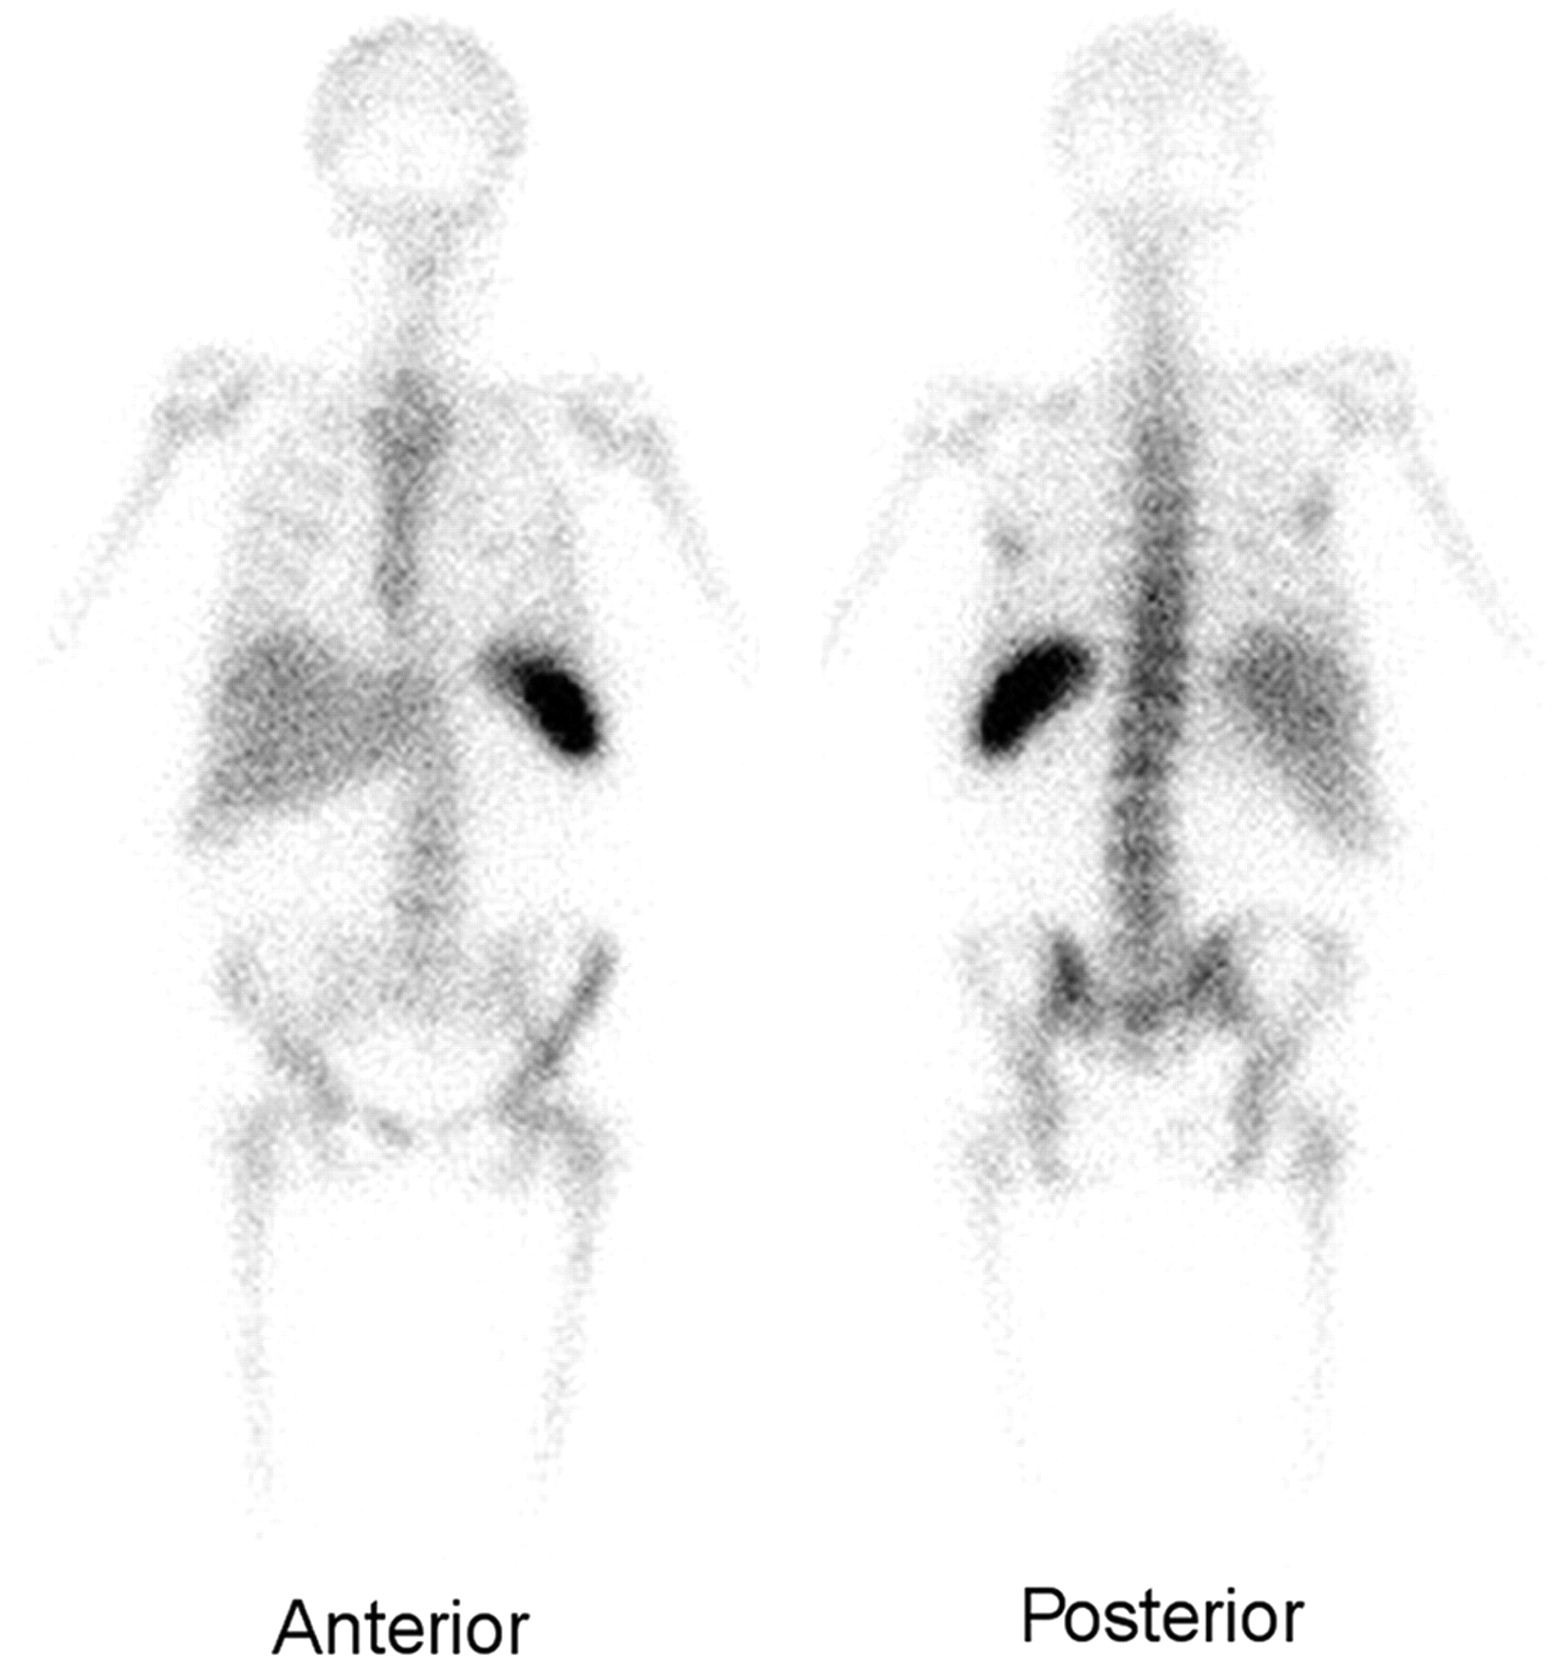
- FIGURE 3.
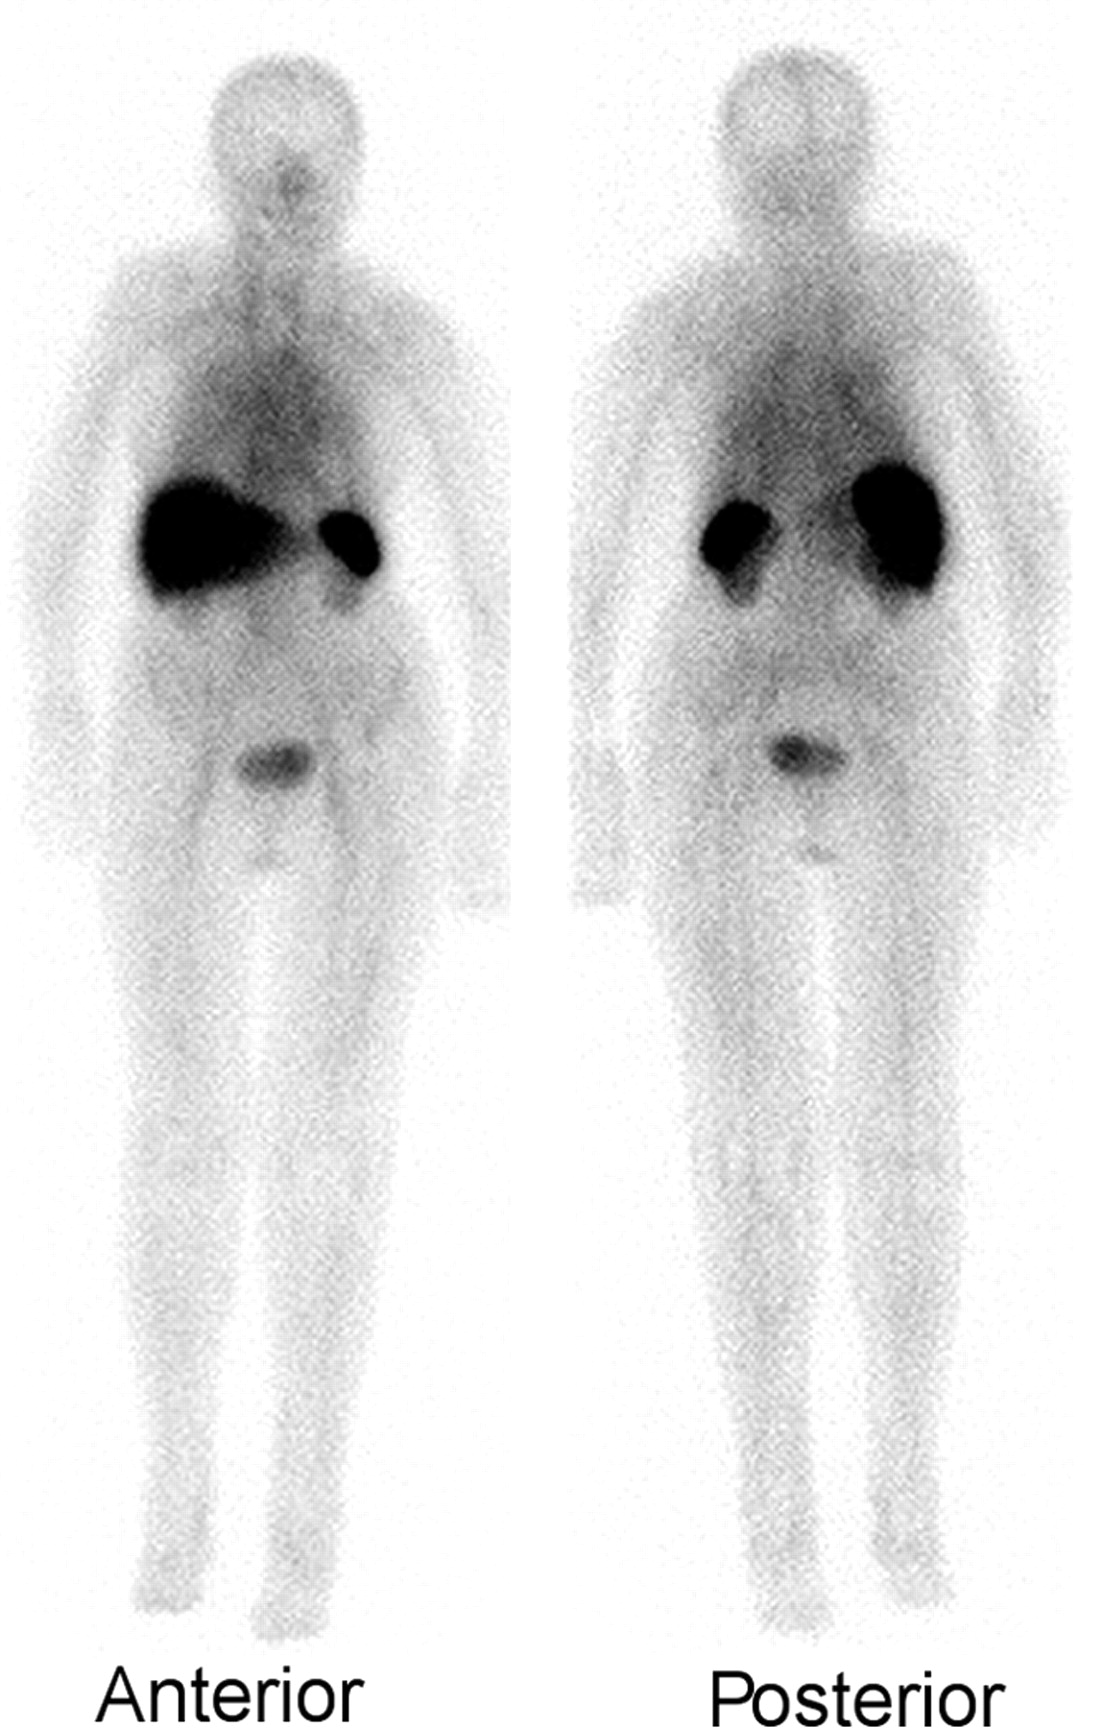
The normal distribution of activity on 111In-labeled leukocyte images acquired 24 h after injection is limited to the liver, spleen, and bone marrow.
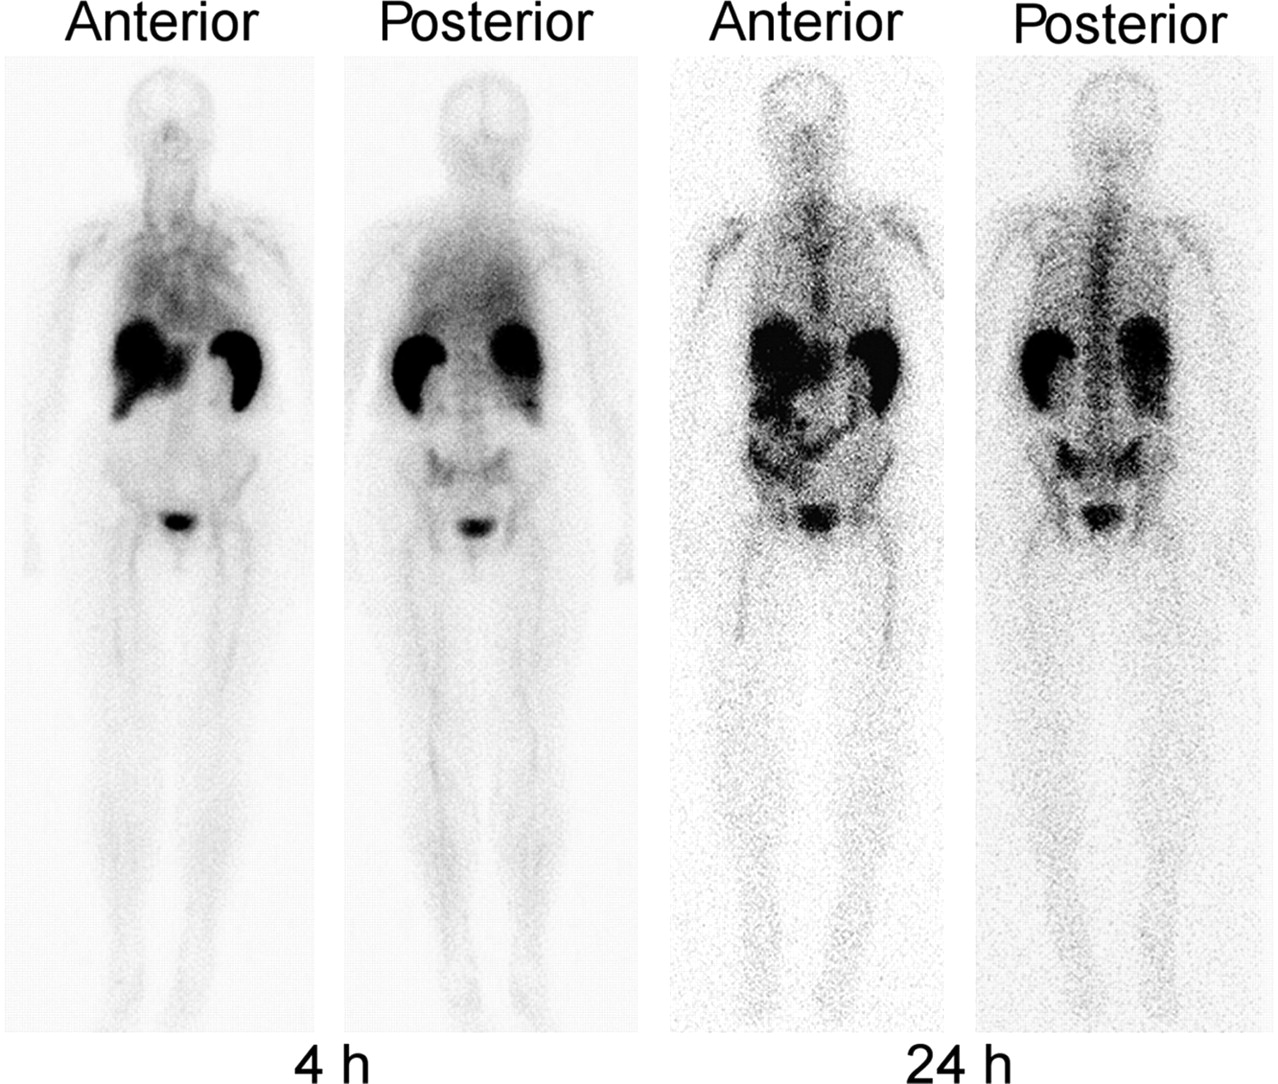
- FIGURE 4.
Four- and 24-h whole-body 99mTc-HMPAO–labeled leukocyte images. At 4 h, there is persistent blood-pool activity. Activity is also seen in the liver, spleen, and genitourinary tract. At 24 h, the blood-pool activity has cleared. Activity is present in the bladder and colon, in addition to the liver, spleen, and bone marrow. Compare with Figure 3.
- FIGURE 5.
Whole-body images performed about 3 h after injection of 740 MBq (20 mCi) of 99mTc-fanolesomab. Activity is present in the liver, spleen, bone marrow, and blood pool. Compare this image with the 4-h 99mTc-HMPAO–labeled leukocyte images in Figure 4.
- FIGURE 6.
Seen on the 67Ga image is intense, diffuse pulmonary activity, which is typical of Pneumocystis carinii pneumonia. The labeled leukocyte study, in contrast, shows normal findings. 67Ga imaging is superior to labeled leukocyte imaging for detecting most opportunistic infections. (Reprinted with permission of (6).)
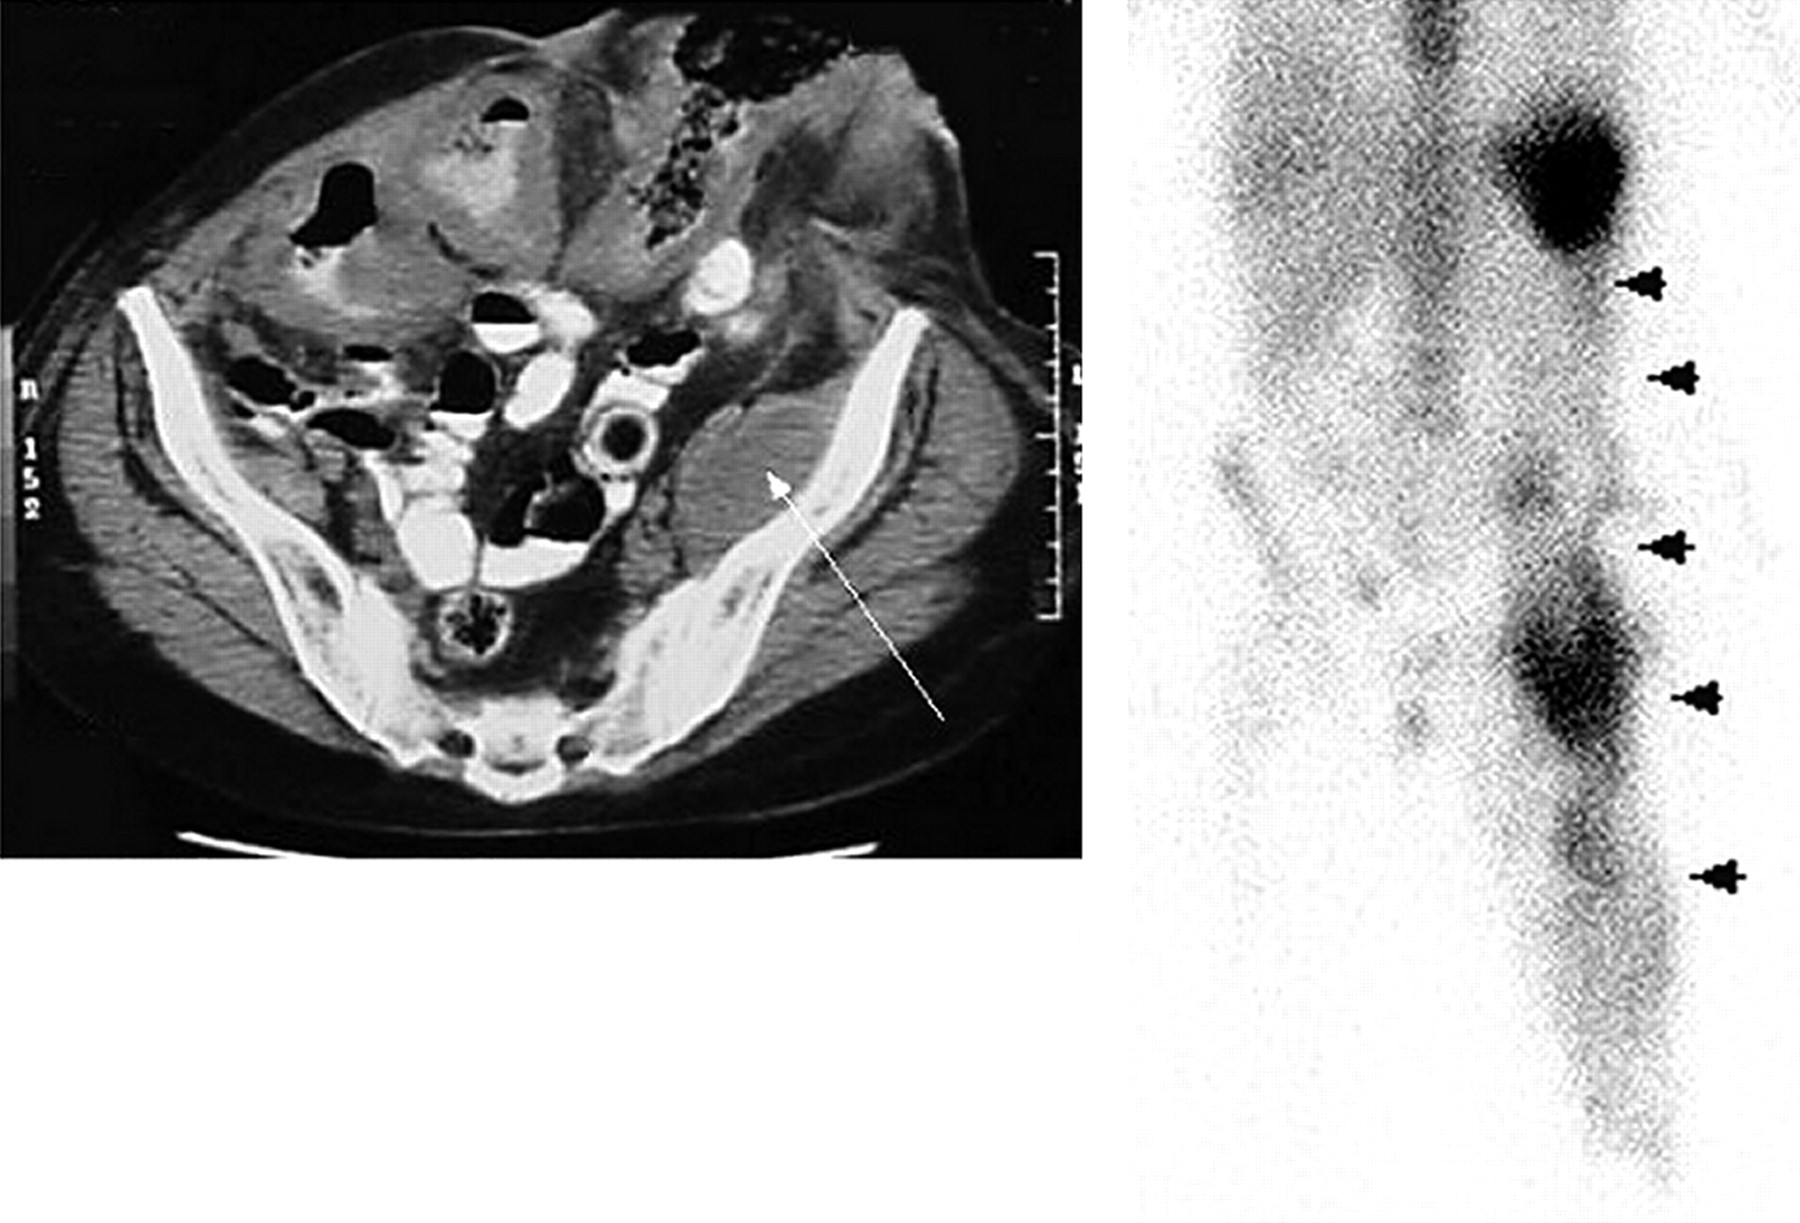
- FIGURE 7.
A patient with a history of multiple abdominal surgeries was noted to have a mass on a CT scan of the abdomen and pelvis (arrow). The differential diagnosis included postoperative changes and tumor, but not infection. Abnormal accumulation of labeled leukocytes extends through the left abdomen into the thigh (arrowheads). Multiple abscesses were subsequently drained.
- FIGURE 8.
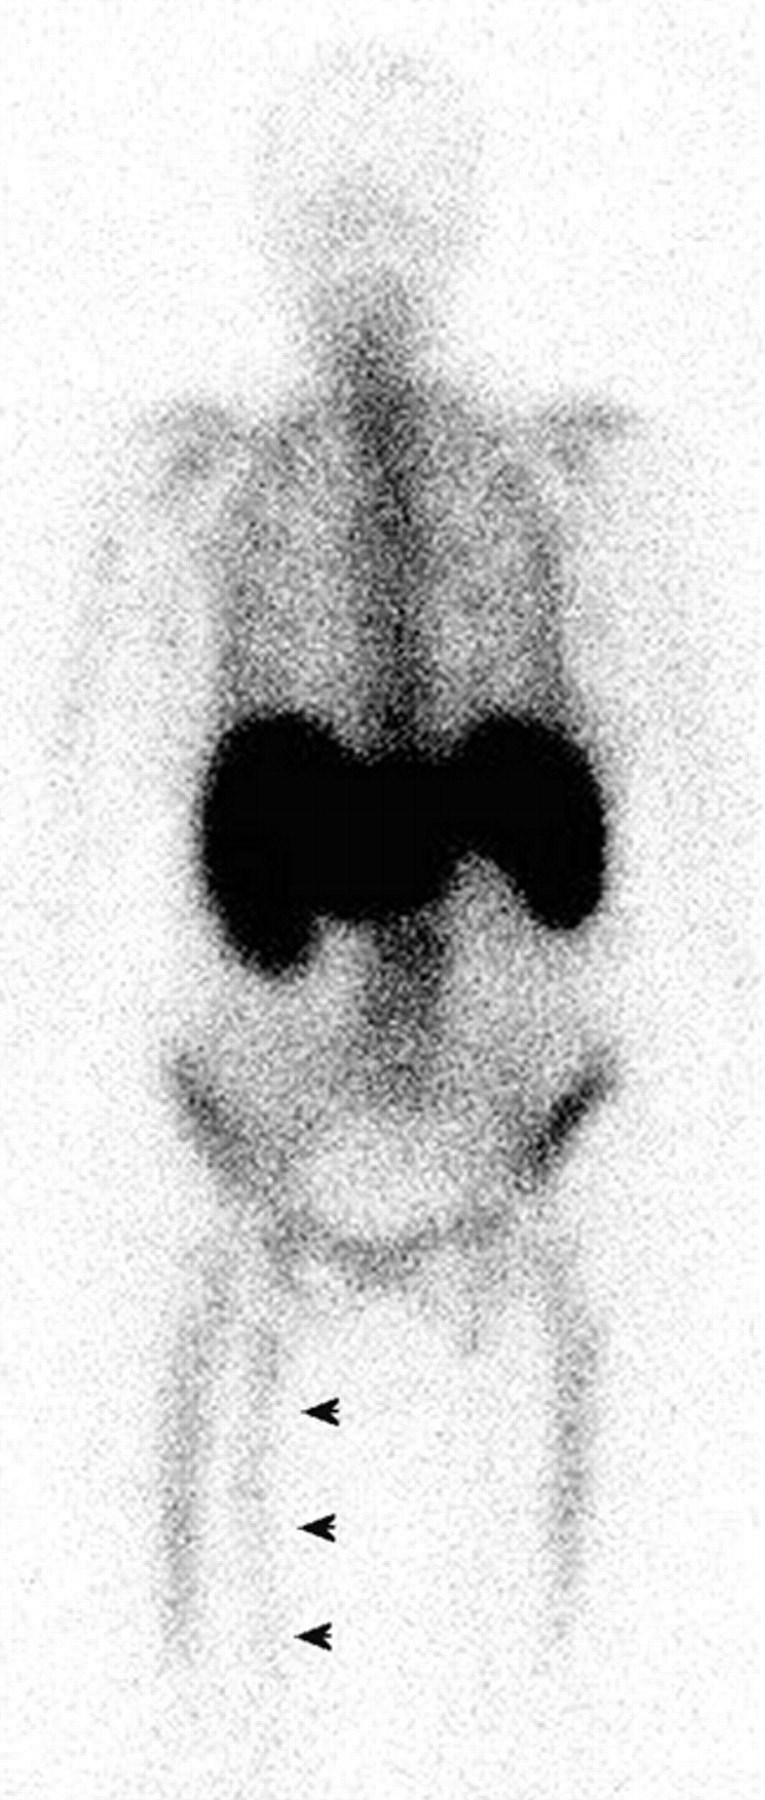
The 111In-labeled leukocyte study demonstrates a linear area of increased activity (arrowheads) in an infected prosthetic vascular graft in the right thigh.
- FIGURE 9.
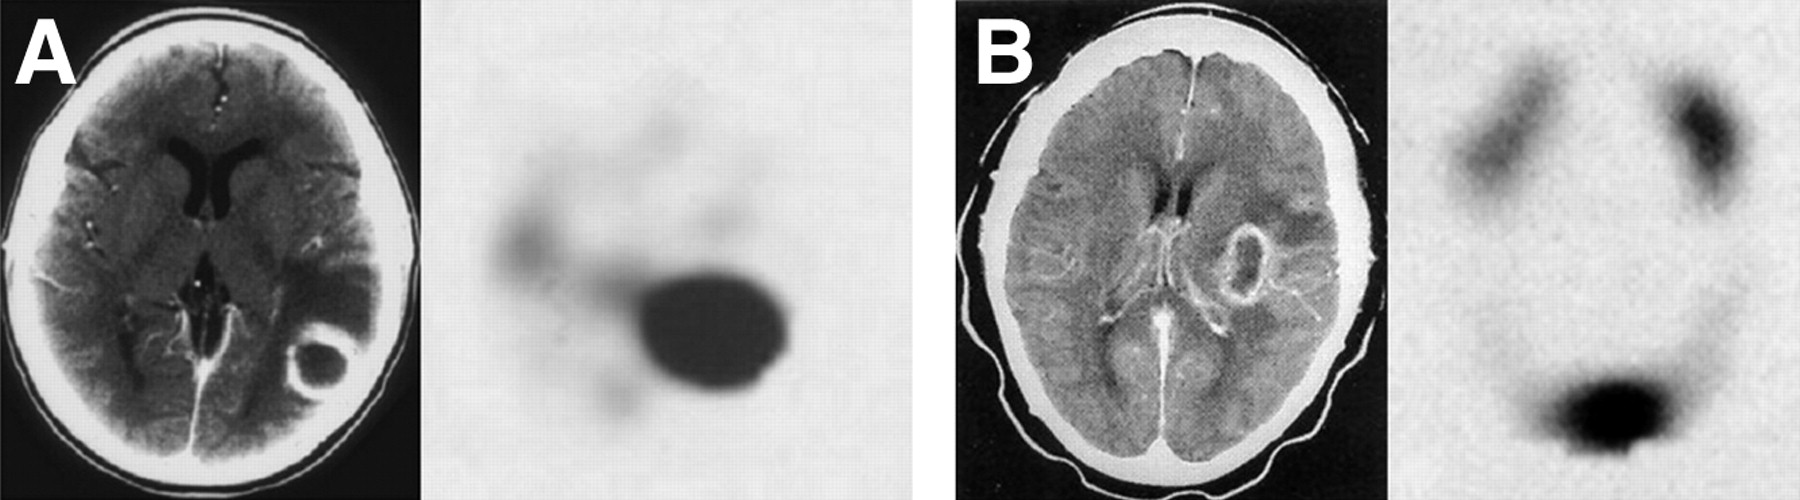
(A) CT with contrast medium (left) reveals an enhancing ring lesion surrounding a central zone of hypodensity in the gray matter of the parietooccipital region of the left cerebral hemisphere. A transverse SPECT image (right) from the 111In-labeled leukocyte study demonstrates intense focal accumulation of labeled leukocytes in this lesion. An abscess was surgically drained. (B) CT with contrast medium (left) demonstrates an enhancing ring lesion surrounding a central zone of hypodensity in the left parietal lobe of the brain. A transverse SPECT image (right) from the 111In-labeled leukocyte study reveals normal activity within the marrow of the skull but no labeled leukocyte accumulation within the lesion. An astrocytoma was found at operation. (Reprinted with permission of (27).)
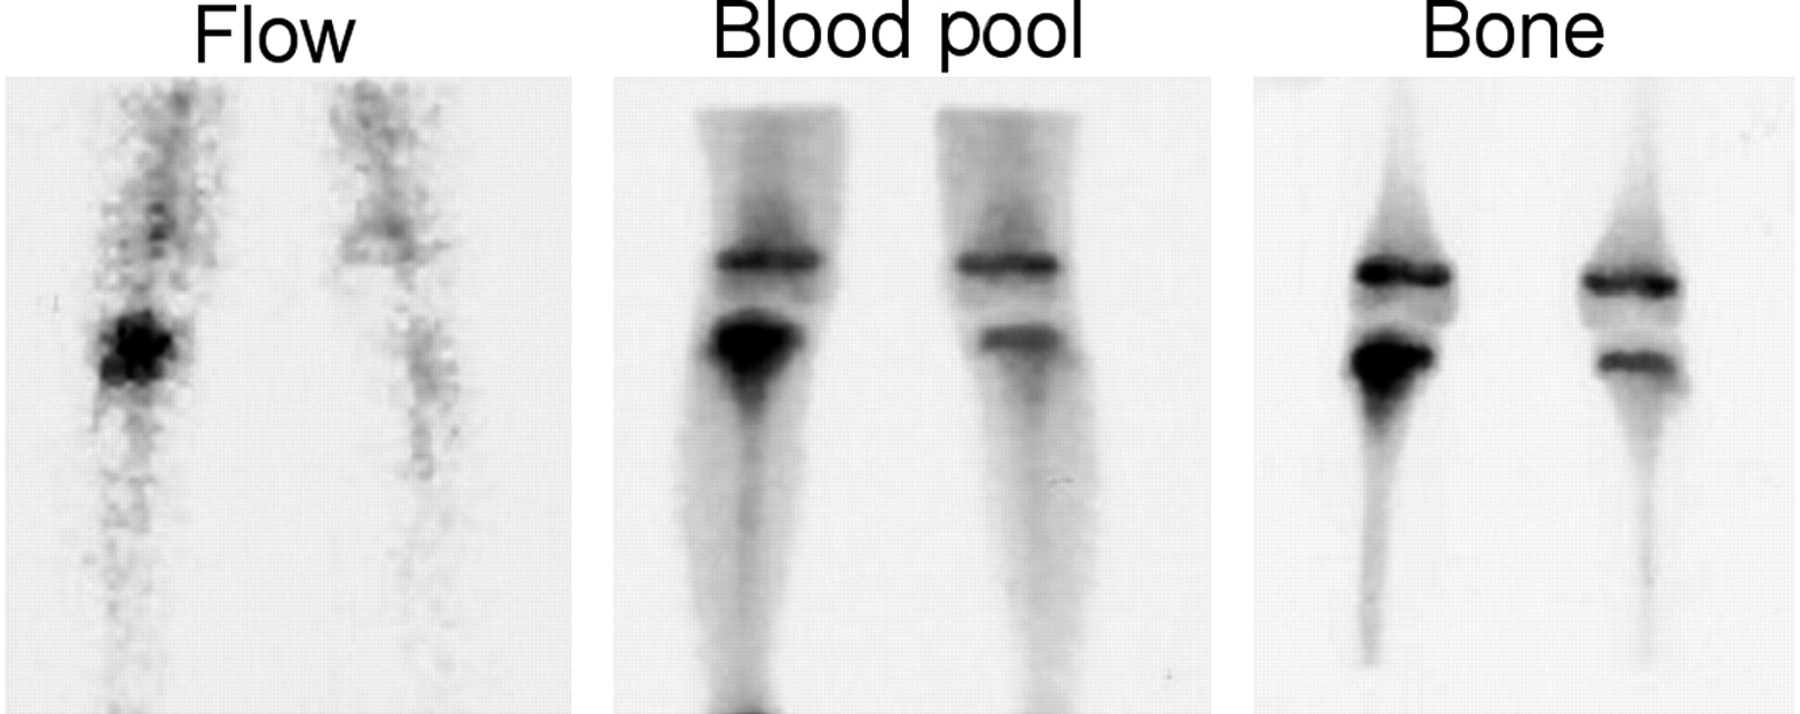
- FIGURE 10.
Focal hyperperfusion, focal hyperemia, and focally increased bony activity in the proximal right tibial metaphysis are the classic findings of osteomyelitis.
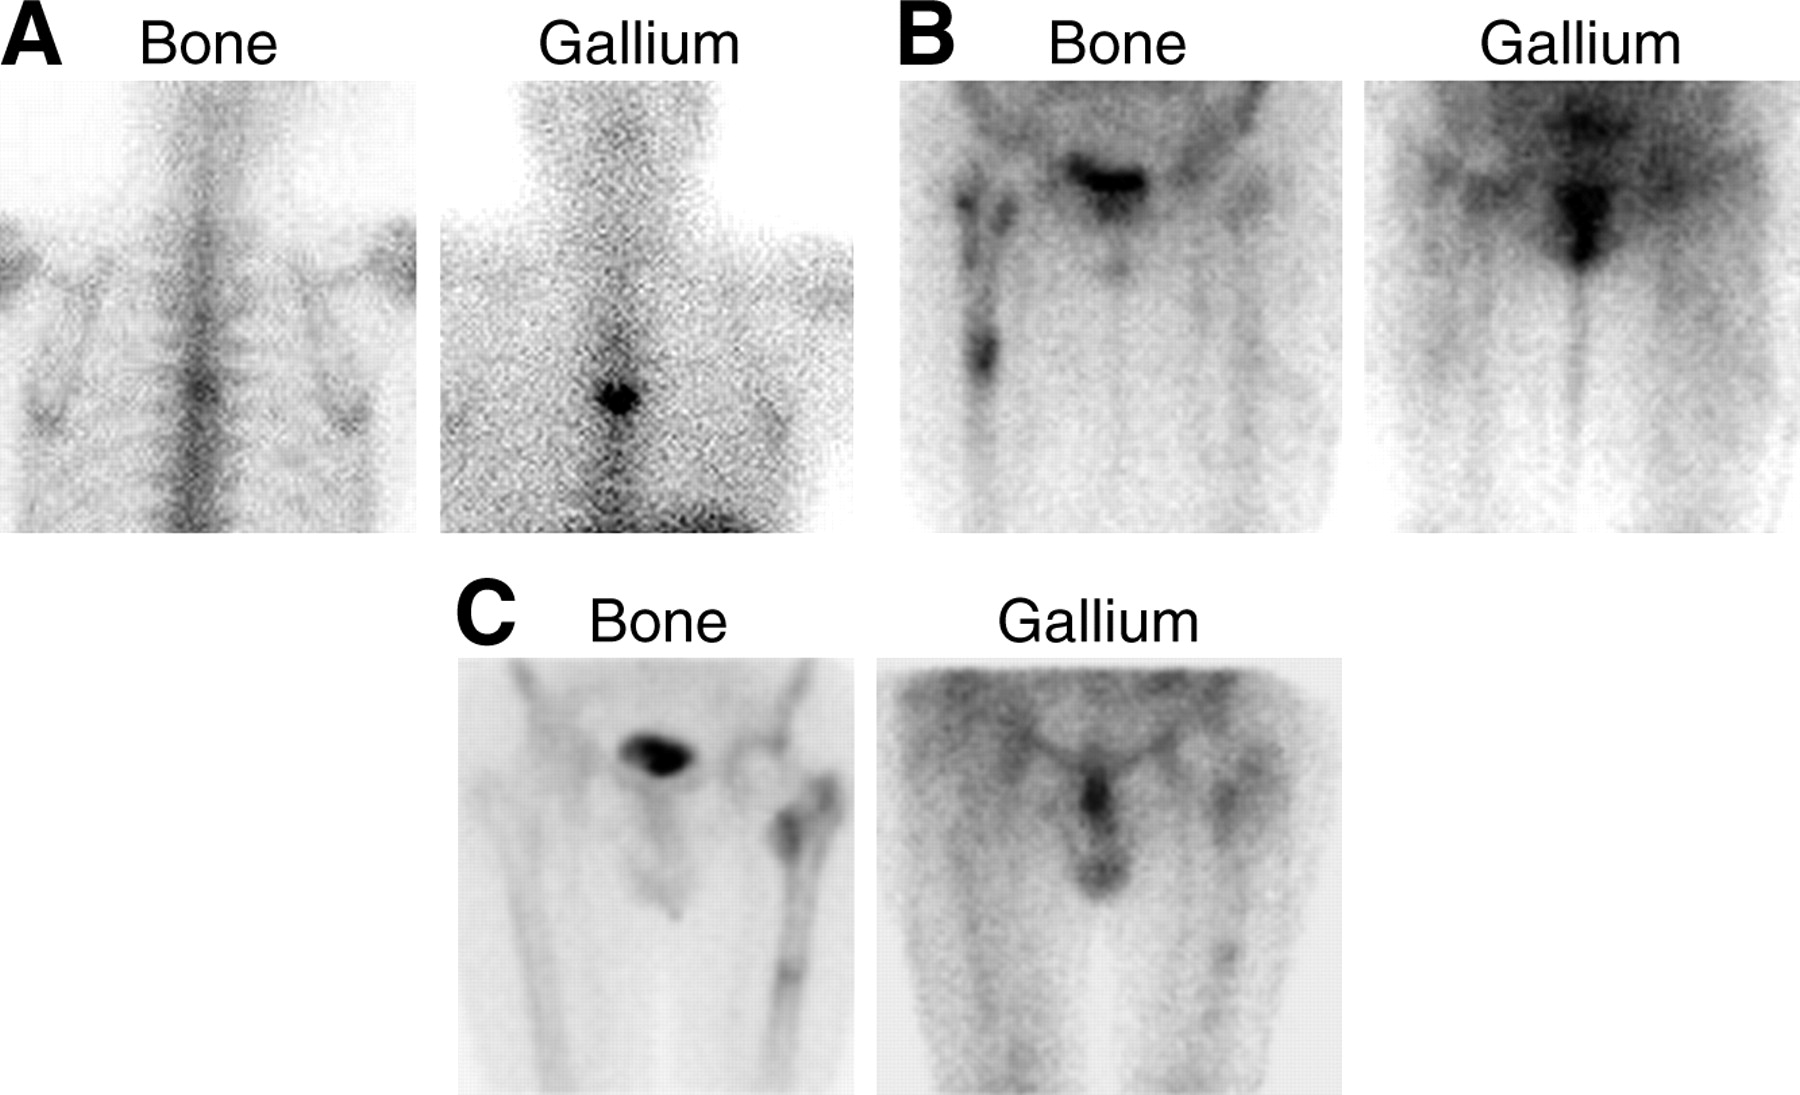
- FIGURE 11.
(A) The spatial distribution of the 2 tracers is similar, but the intensity of uptake is greater on the 67Ga image than on the bone image, and hence the combined study is positive for osteomyelitis. (B) Although periprosthetic activity is increased around a right hip prosthesis on the bone image, the 67Ga findings are normal, and the combined study is negative for infection. (C) The intensity and spatial distribution of both tracers around a left hip prosthesis are similar; thus, the combined study is equivocal for infection.
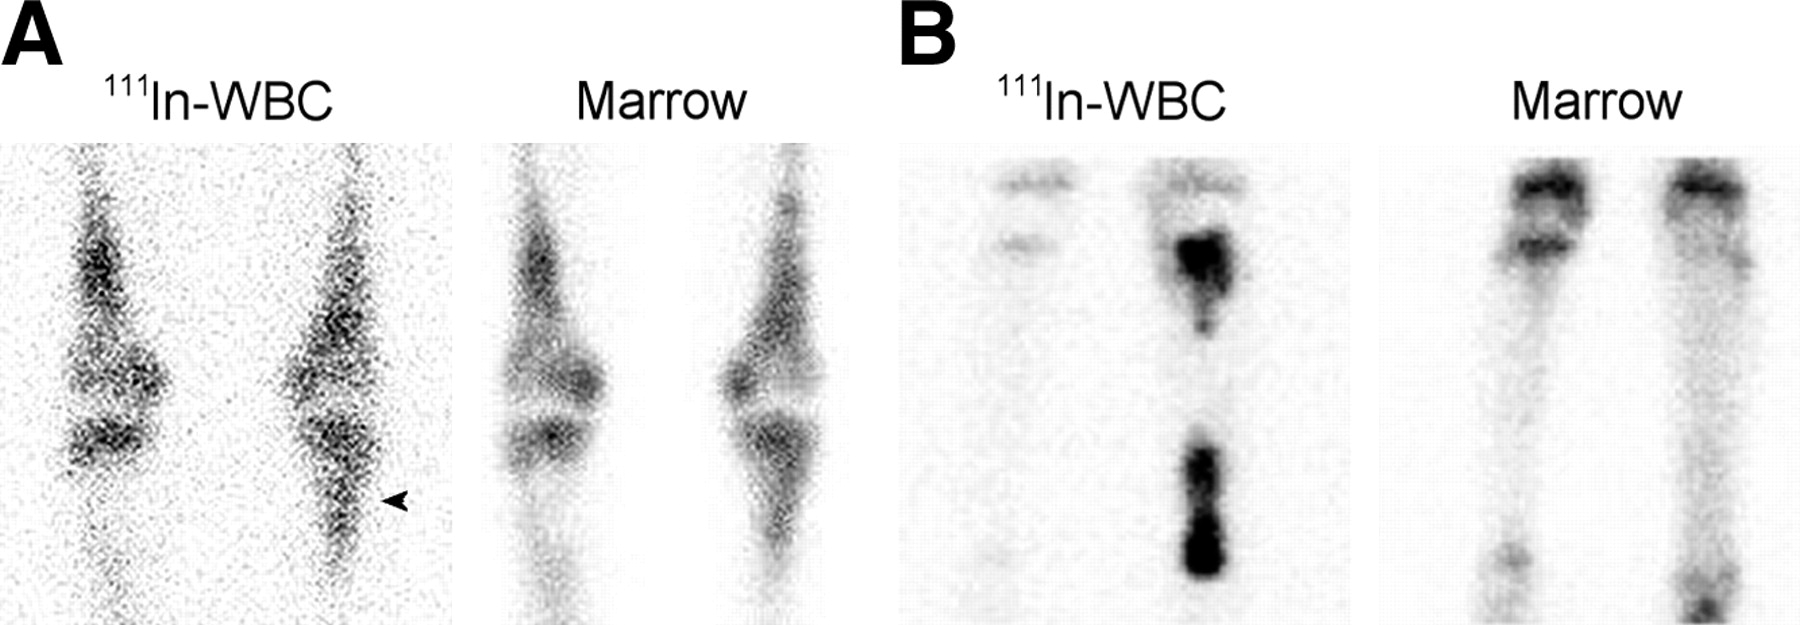
- FIGURE 12.
(A) The activity in the proximal left tibia (arrowhead) on the labeled leukocyte image of a patient with Gaucher’s disease could easily be interpreted as consistent with osteomyelitis. The distribution of activity on the bone marrow image is virtually identical however, and the combined study is negative for osteomyelitis. (B) On the labeled leukocyte image, activity is increased in both the proximal and the distal left tibia. The marrow image shows no corresponding activity, and the combined study is positive for multifocal osteomyelitis of the left tibia.
- FIGURE 13.
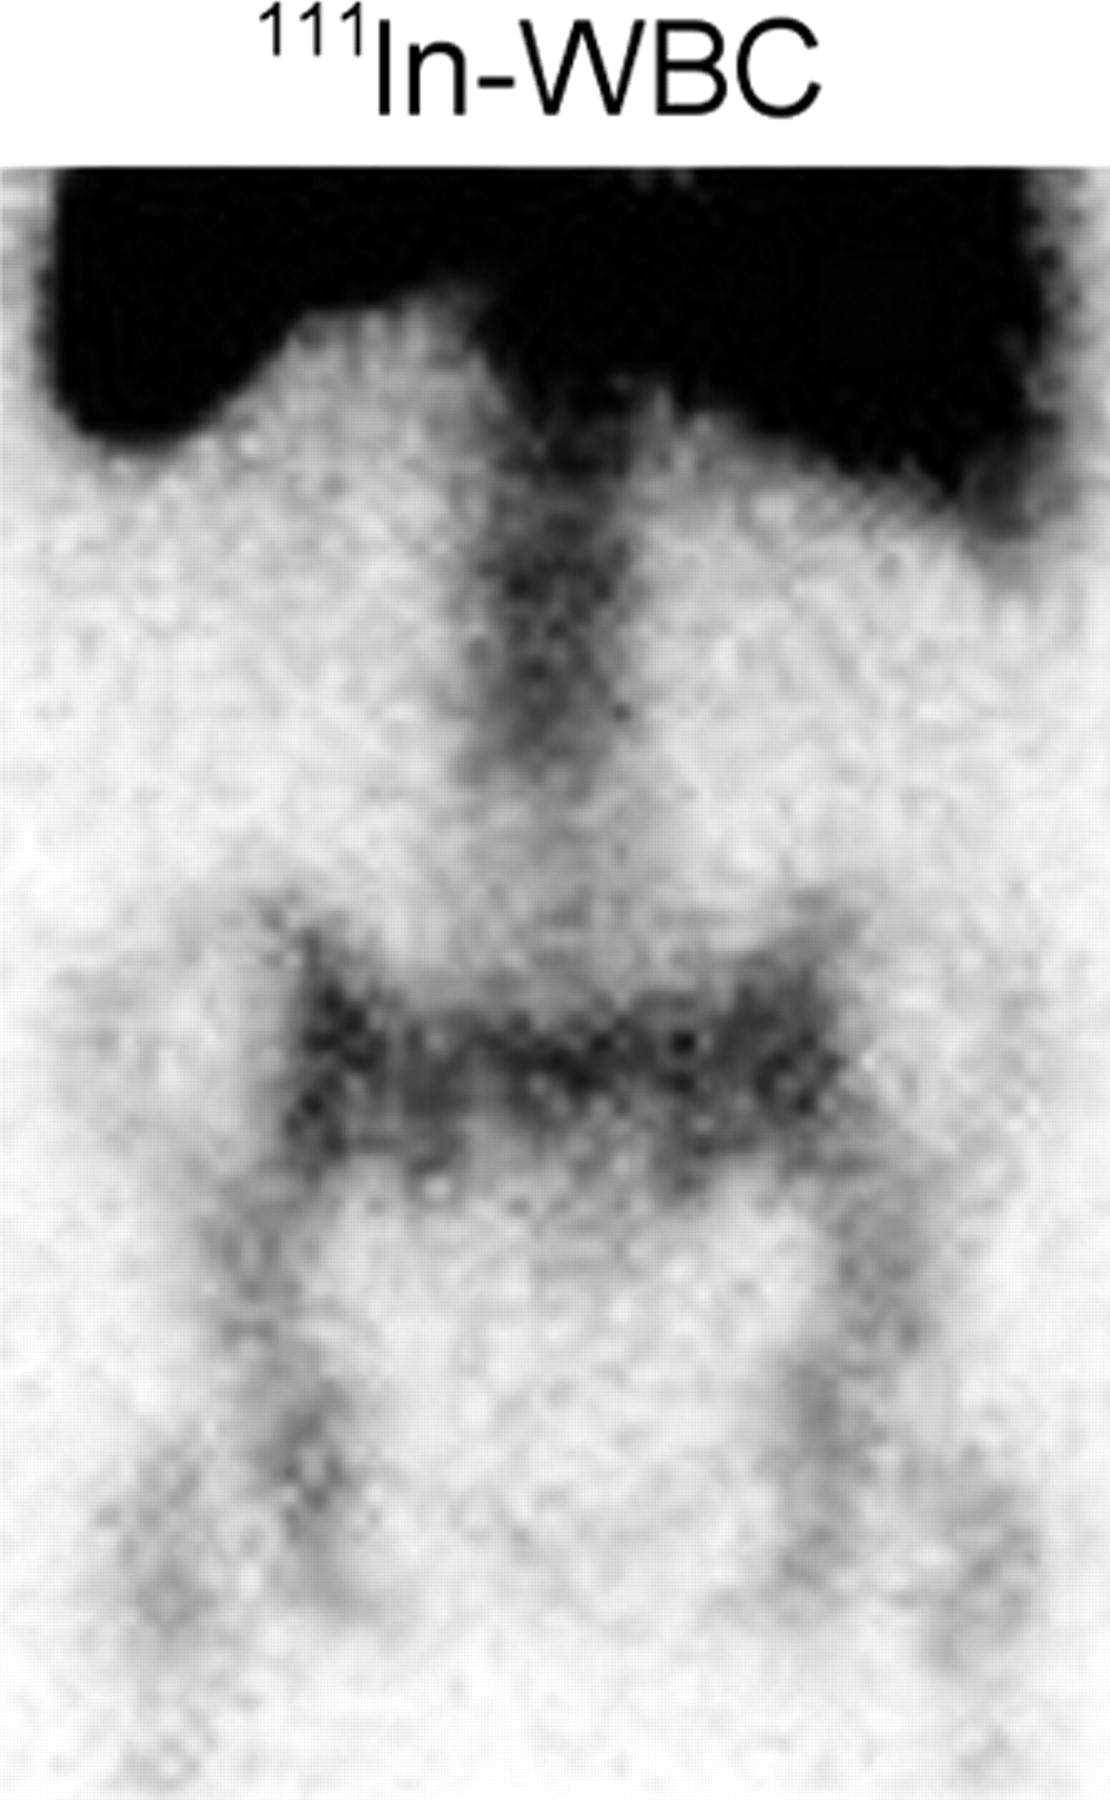
Labeled leukocyte activity is markedly decreased in osteomyelitis of the lower lumbar spine. This pattern, though consistent with, is not specific for, spinal osteomyelitis.
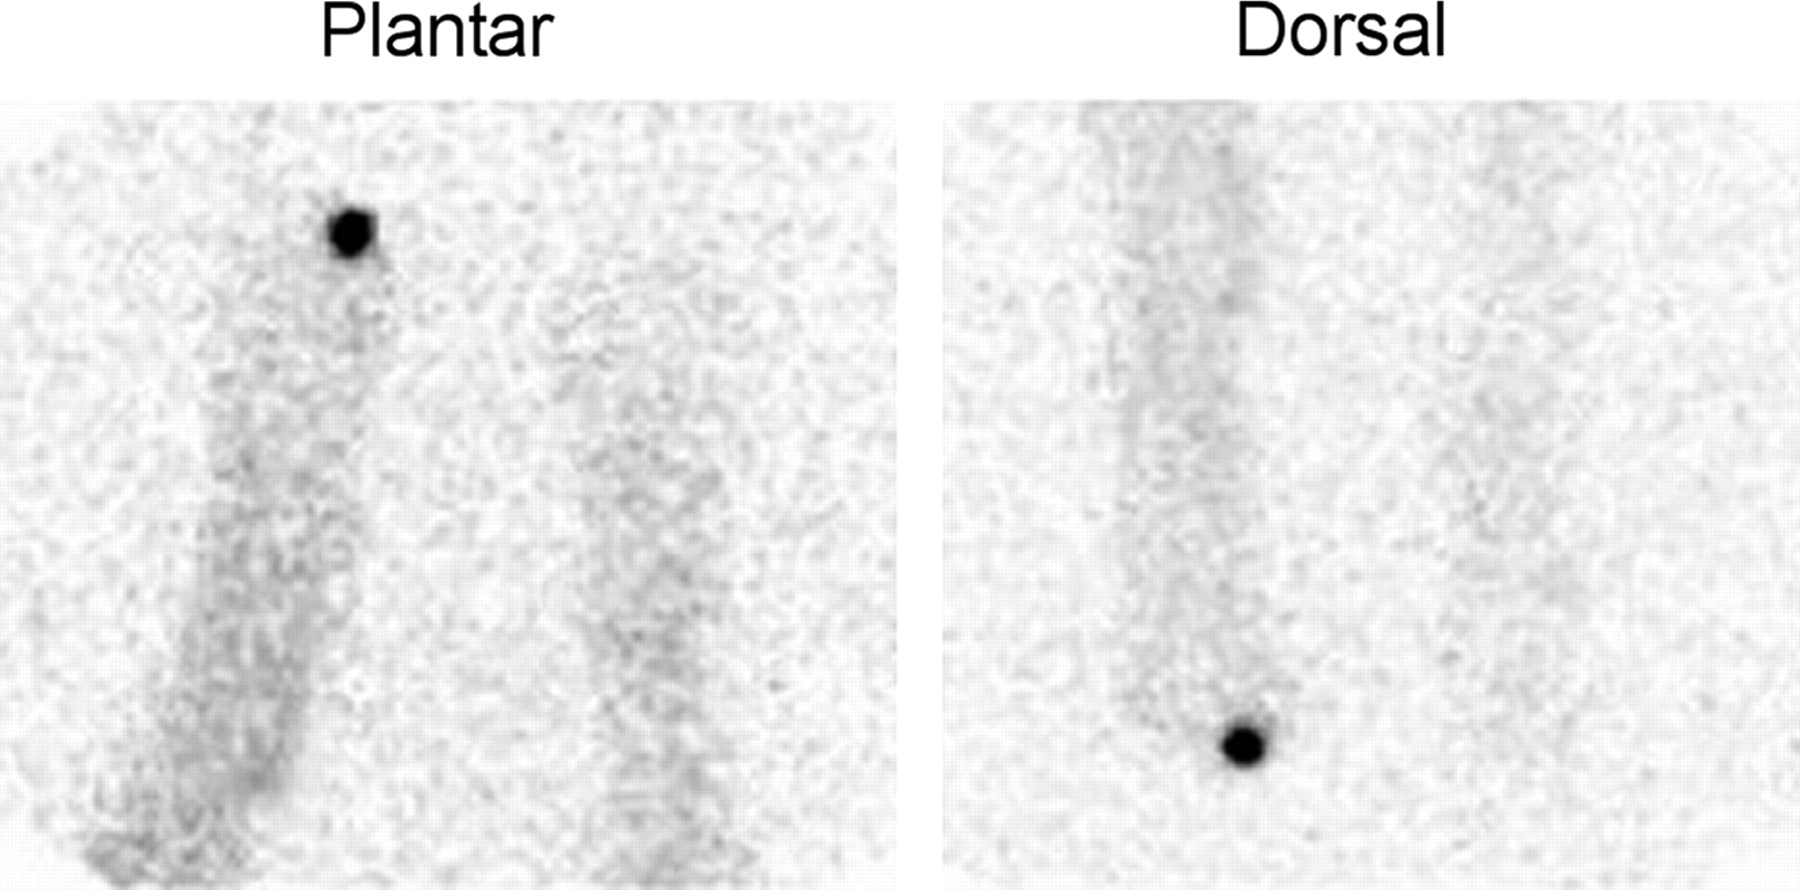
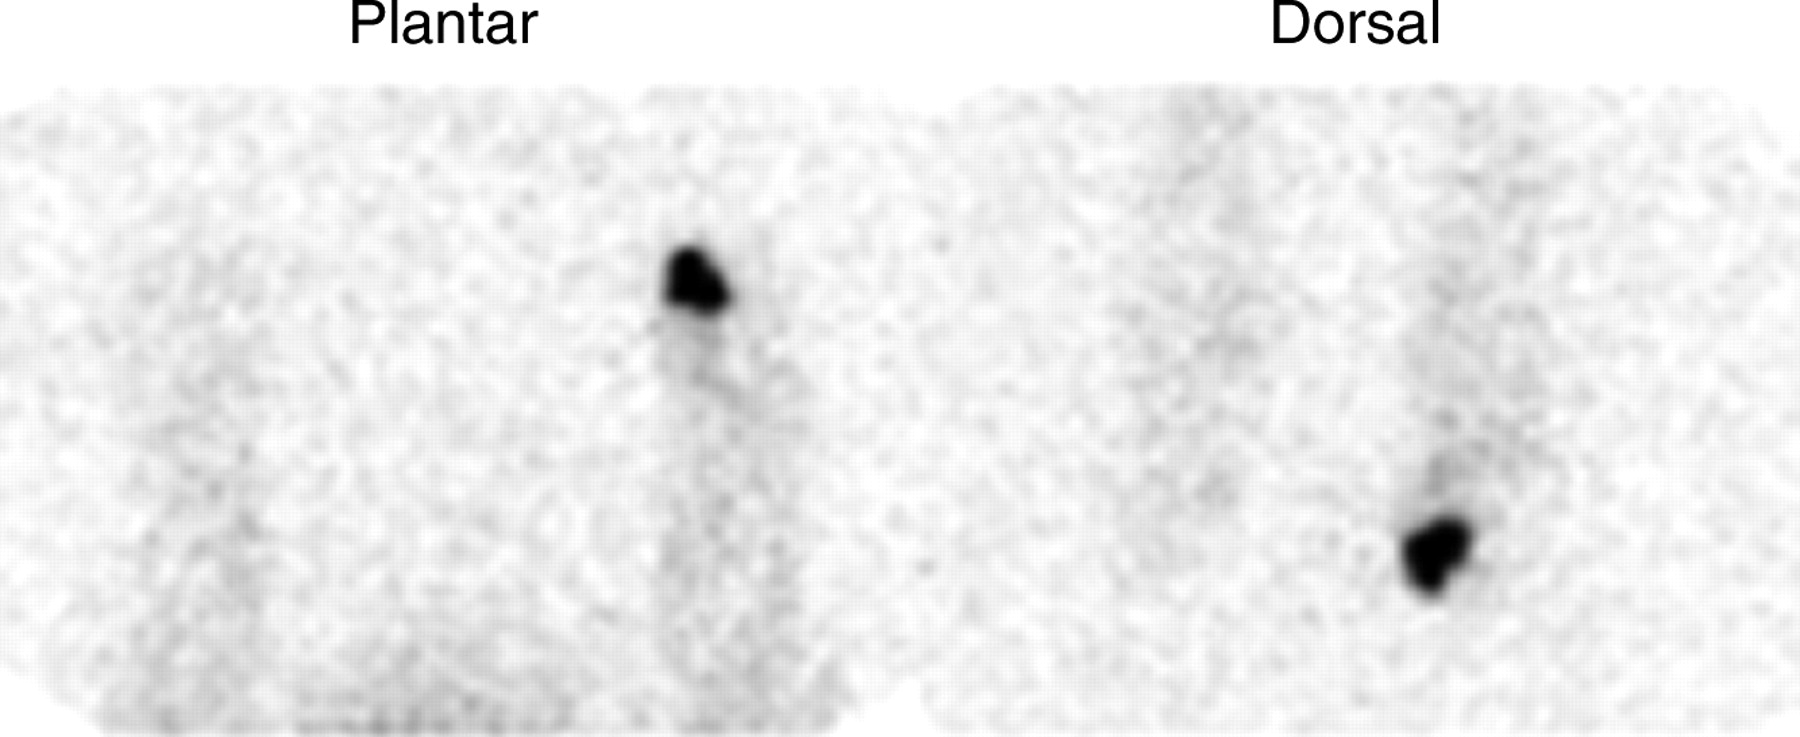
- FIGURE 14.
Focally intense activity is present on both the dorsal and the plantar labeled leukocyte images of a diabetic patient with pedal osteomyelitis of the left great toe.
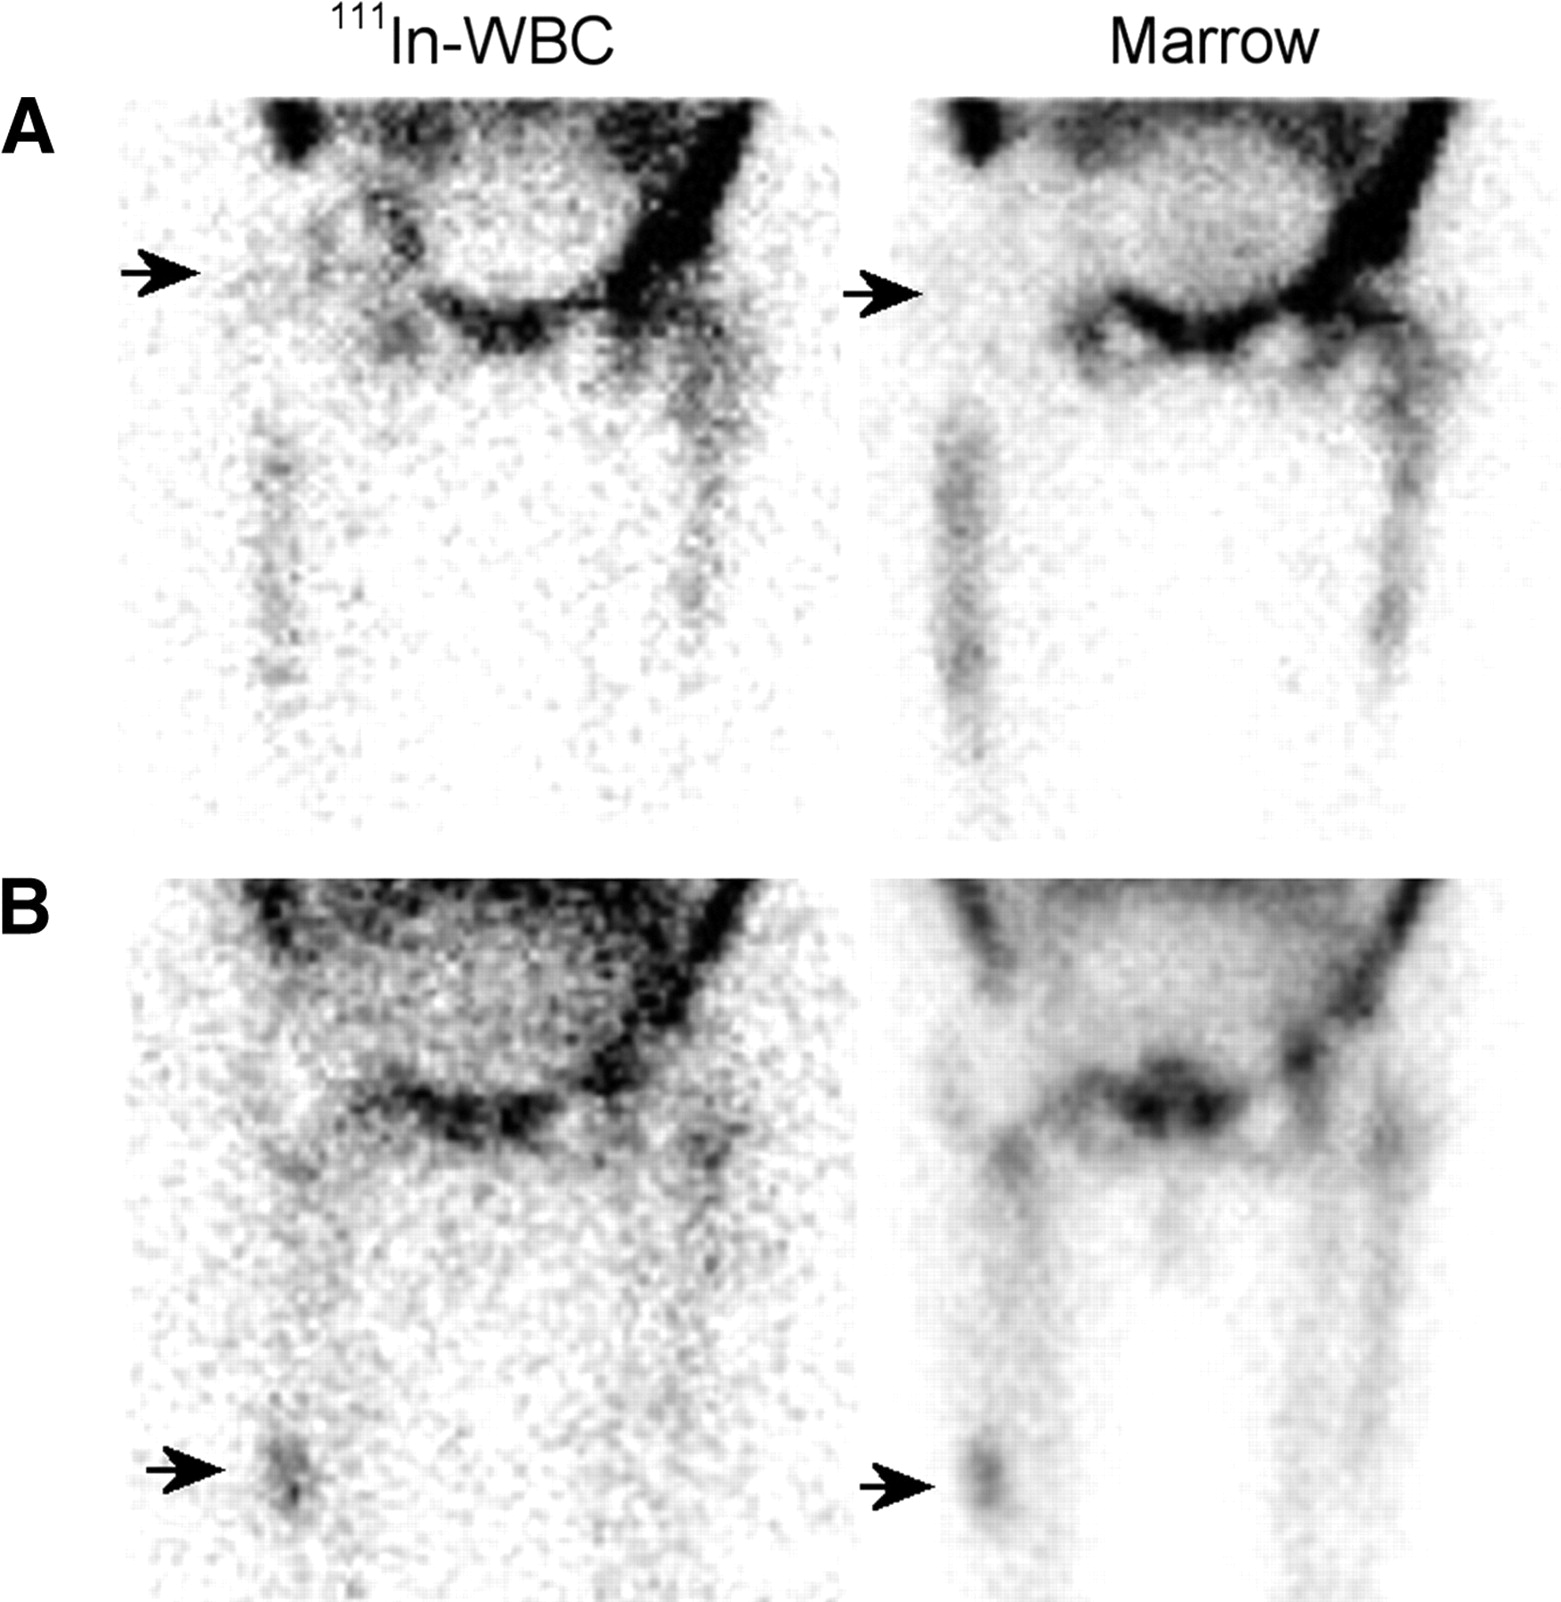
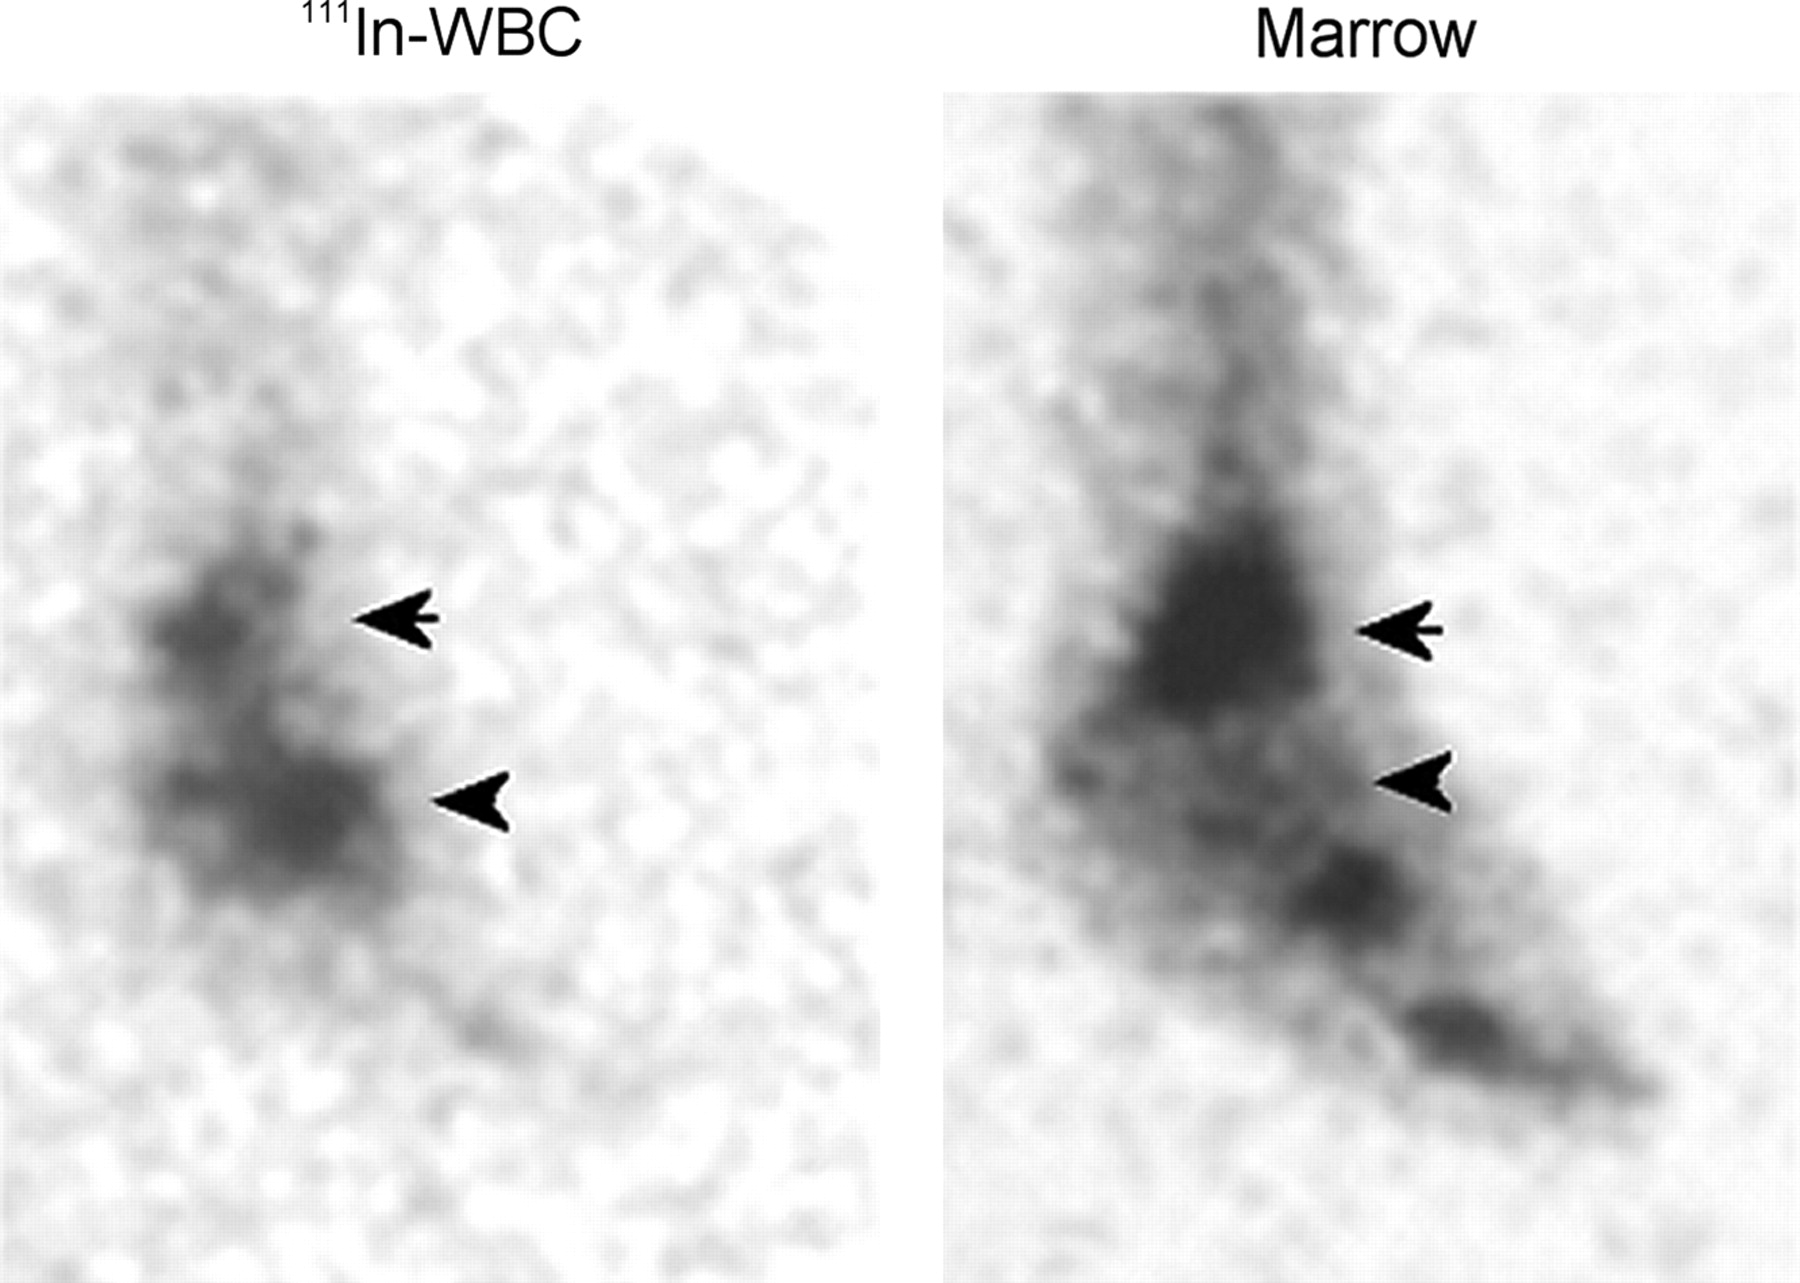
- FIGURE 15.
Labeled leukocyte and marrow images from a patient with osteomyelitis in Charcot’s joint of the left foot. Spatially congruent activity is present in the distal left tibia on both the labeled leukocyte and the marrow images (arrows), confirming that uptake of labeled leukocytes in this region is due to marrow, not to infection. In contrast, no activity is seen in the left midfoot on the marrow image that corresponds to the activity in this region on the labeled leukocyte study (arrowheads), and hence the uptake of labeled leukocytes in this region is due to osteomyelitis.
- FIGURE 16.
(A) Subtly increased labeled leukocyte activity is seen in the right hip region (arrow) of a patient with a painful right hip prosthesis. No increased activity is present in this region (arrow) on the marrow image, and the combined study is positive for infection of the prosthesis. (B) Focally increased activity at the tip of the femoral component (arrow) of an aseptically loosened right hip replacement is present on both the labeled leukocyte and the marrow images, and the combined study is negative for infection.
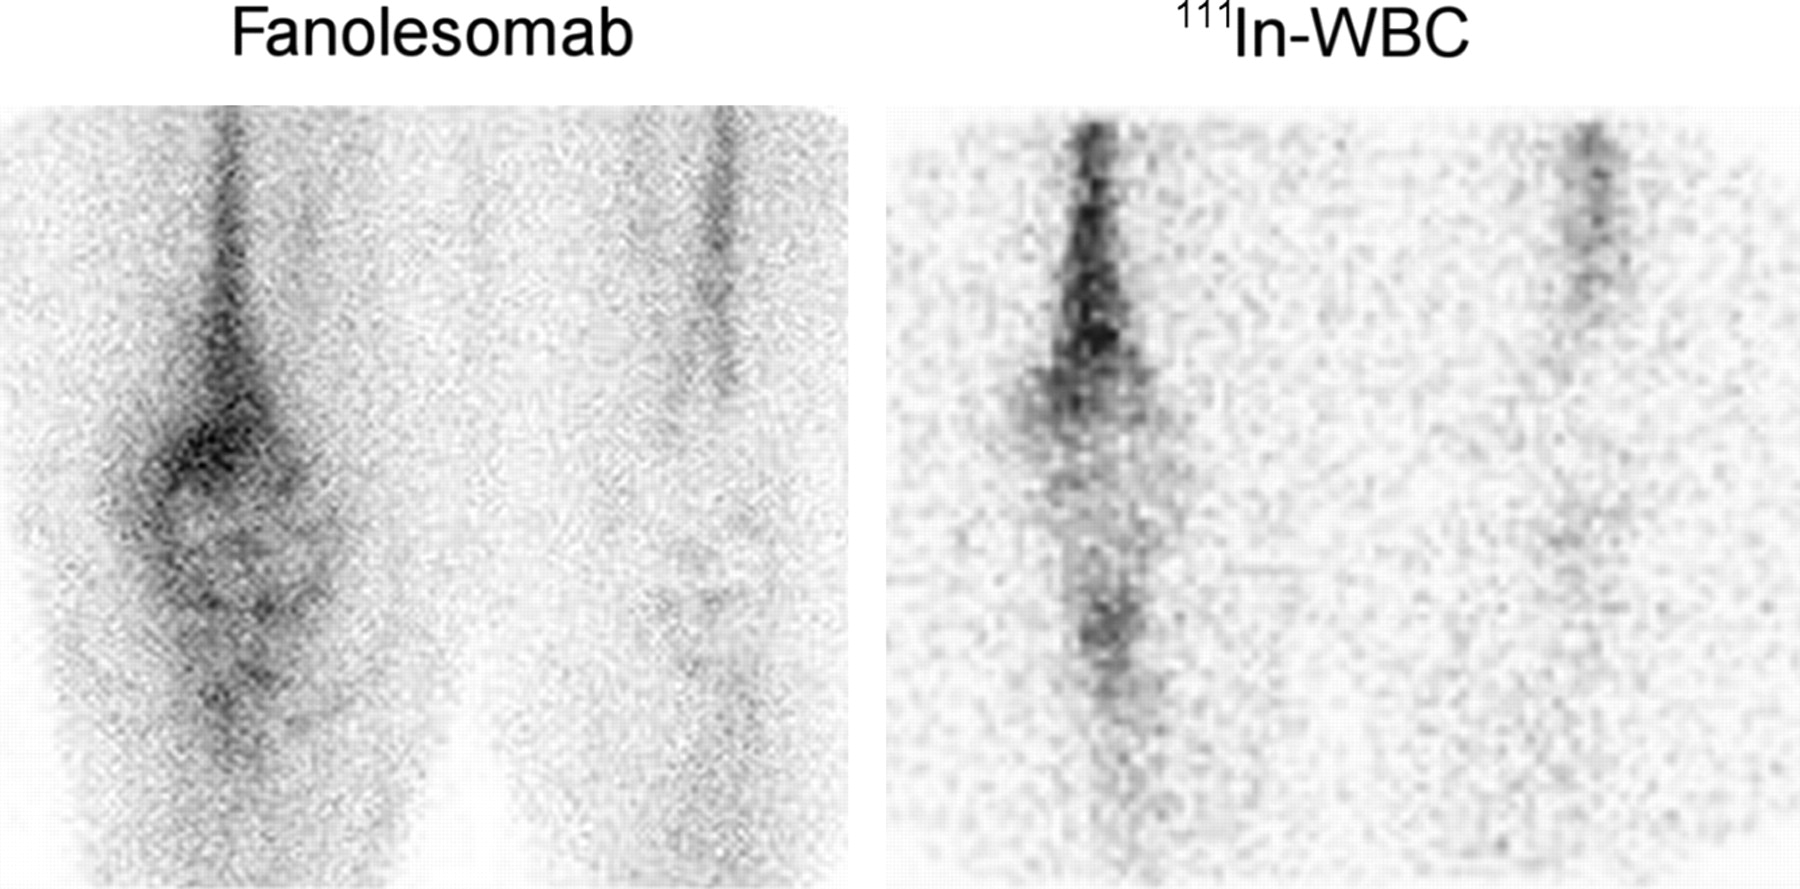
- FIGURE 17.
Both the 2-h fanolesomab and the 24-h labeled leukocyte images reveal increased activity around an infected right knee prosthesis. The distribution of activity on these 2 images is not identical. The fanolesomab image was performed 2 h after injection, whereas the labeled leukocyte image was performed about 24 h after injection. Thus, the fanolesomab image probably reflects an earlier stage of labeled leukocyte accumulation, whereas the leukocyte image reflects a later stage of labeled leukocyte accumulation.
- FIGURE 18.
One-hour fanolesomab images from a diabetic patient with pedal osteomyelitis of the right great toe.
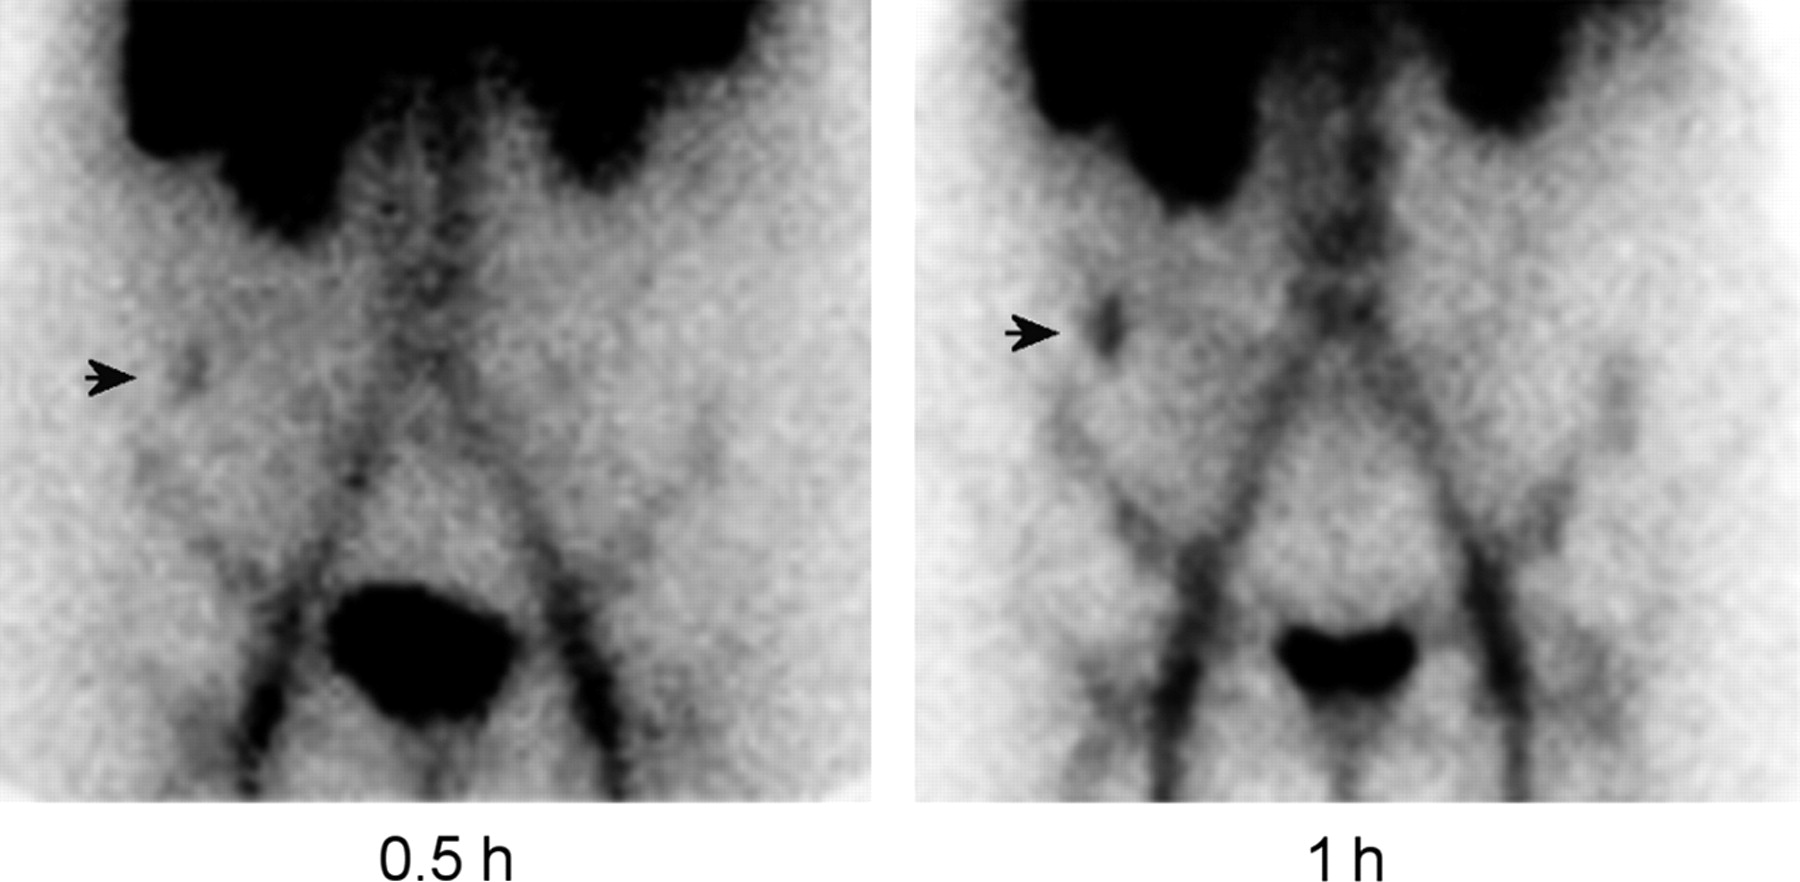
- FIGURE 19.
A fanolesomab study, performed on a patient with acute appendicitis, demonstrates focal activity in the right lower quadrant of the abdomen (arrow), which increases in intensity over time.
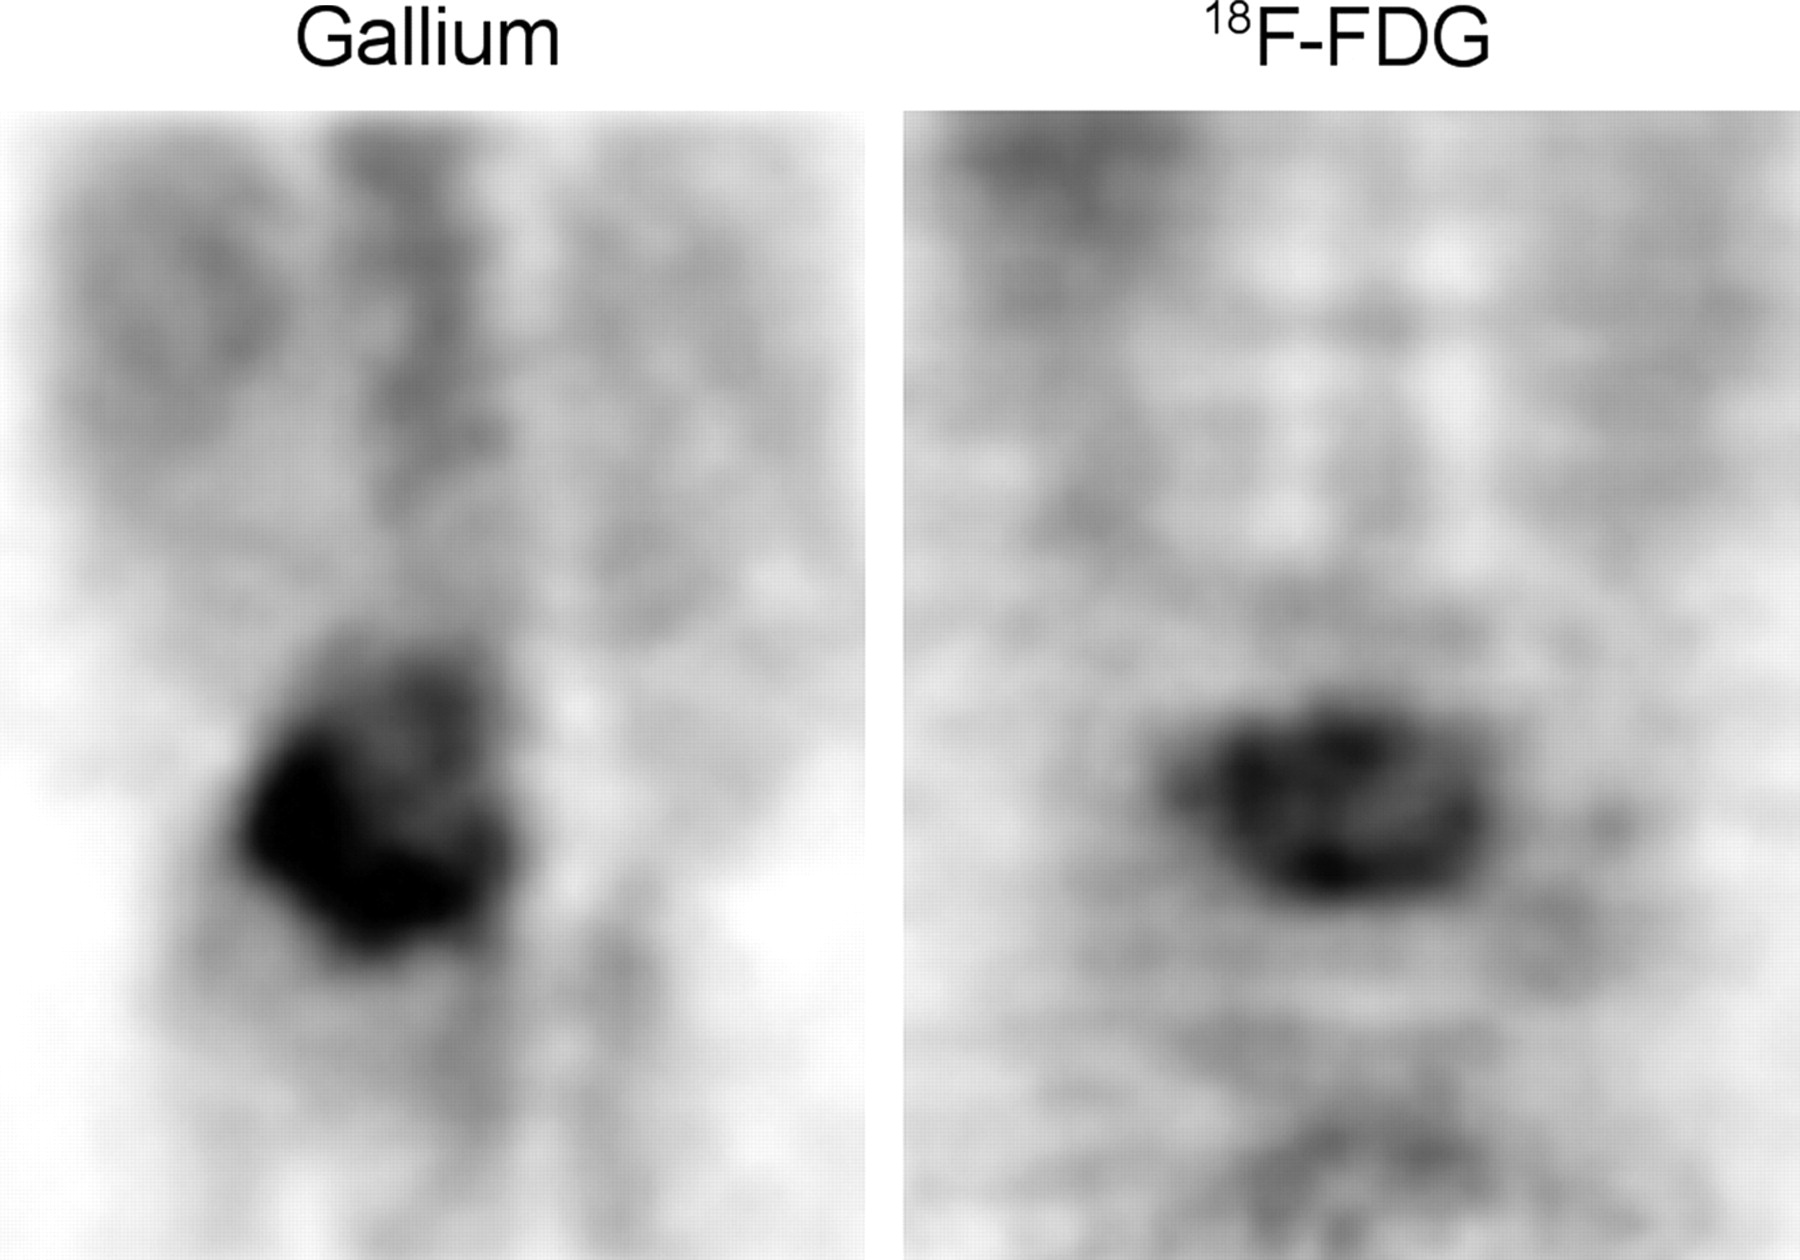
- FIGURE 20.
Both 67Ga SPECT and 18F-FDG PET images demonstrate intense activity in a case of osteomyelitis of the lower lumbar spine.


Jump to section
Related Articles
Cited By...
- Dynamic imaging for CAR-T-cell therapy
- Added Value of 99mTc-HMPAO-Labeled Leukocyte SPECT/CT in the Characterization and Management of Patients with Infectious Endocarditis
- In Vivo Leukocyte Labeling: The Quest Continues
- SPECT/CT Using 67Ga and 111In-Labeled Leukocyte Scintigraphy for Diagnosis of Infection
- Imaging of Infection and Inflammation with an Improved 99mTc-Labeled LTB4 Antagonist