

FIGURE 5.

FIGURE 5.
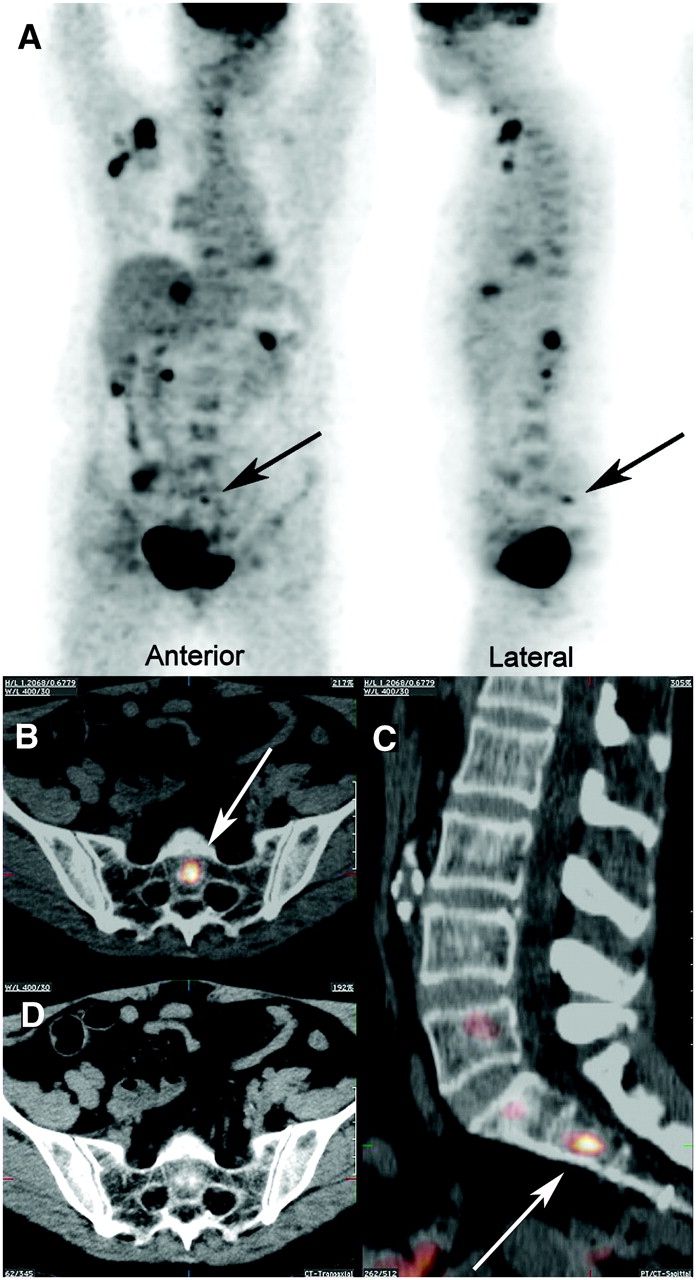
Dual-tracer acquisition: combined injection of 18F-FDG and 18F. (A) Two views of combined tracer showing soft-tissue, lytic bone, and osteoblastic bone lesions. Arrows point to small osteoblastic lesion in sacrum. (B and C) Fused CT and 18F-FDG/18F PET characterizing lesion (arrows) as small and osteoblastic in central body of S2. (D) CT image of B with fusion shows sclerotic nature of S2 lesion. Note sclerotic focus centrally within S2 body in lower left corner of CT image and same area on fused images. This area would probably not have been visualized on plain 18F-FDG scan.
In this issue


Related Articles
Cited By...
- Bone-Targeted Imaging and Radionuclide Therapy in Prostate Cancer
- 18F-Fluoride PET in the Assessment of Malignant Bone Disease
- The Value of Observer Performance Studies in Dose Optimization: A Focus on Free-Response Receiver Operating Characteristic Methods
- Validation of a Paper Chromatographic Methodology as an Alternative for Determination of the Radiochemical Purity of Na18F
- Software Fusion: An Option Never Fully Explored