


Abstract
Hypoxia is a significant therapeutic problem for solid tumors because hypoxic cells are treatment-resistant and more aggressive. Hypoxia-activated prodrugs such as SN30000 use a mechanism of activation in hypoxic cells similar to that of 2-nitroimidazole hypoxia PET tracers. Therefore, we have evaluated the usefulness of 2-(2-nitro-1H-imidazol-1-yl)-N-(2,2,3,3,3-18F-pentafluoropropyl)-acetamide (18F-EF5) PET to monitor and predict tumor response to SN30000 plus radiation treatment (RT). Methods: Human non–small cell lung cancer xenografts (H460) in athymic rats were imaged with 18F-EF5 PET before and after treatment with SN30000 (90 mg/kg), with or without 15-Gy RT. The feasibility of imaging early changes in hypoxia in response to SN30000 was examined 24 h after treatment, followed by ex vivo γ-counting and immunohistochemical examination to study drug-induced apoptosis. Subsequently, the therapeutic effects of SN30000 with or without RT were evaluated in tumor growth delay studies and compared with early treatment-induced changes observed by 18F-EF5 PET. Changes in tumor hemoglobin oxygen saturation as a function of time after treatment measured by optical spectroscopy were compared with PET data. Results: The uptake of 18F-EF5 was significantly lower in SN30000-treated tumors than in saline controls 24 h after treatment (mean standardized uptake value, 0.44 ± 0.08 vs. 0.56 ± 0.08 for control group; P < 0.05). Apoptosis was significantly higher in SN30000-treated tumors than in controls. Early treatment-induced changes in 18F-EF5 uptake were indicative of tumor response in growth delay studies at the group level. SN30000 plus RT significantly decreased 18F-EF5 uptake relative to baseline and resulted in complete tumor remission in 5 of 7 animals. SN30000 alone decreased 18F-EF5 uptake, generally in tumors with high initial standardized uptake values, and showed a minor tumor growth delay effect. The changes induced by SN30000 with or without RT in 18F-EF5 uptake correlated with baseline hypoxia levels. RT caused significant increases in tumor oxygen concentration and hemoglobin oxygen saturation. Conclusion: A hypoxia PET imaging agent can measure changes in tumor hypoxic fraction in response to SN30000. These results suggest the utility of 18F-EF5 PET for monitoring early response to tumor treatment with SN30000 plus RT in the clinical development of this novel hypoxia-activated prodrug.
Hypoxia is a common feature of nearly all solid tumors and arises due to an imbalance between the oxygen requirements of rapidly proliferating tumor cells and that available from the tumor vasculature. Additionally, structural and functional abnormalities in tumor microvessels generate areas with low oxygen levels relative to well perfused regions (1,2). Hypoxia has a profound impact on tumor cell gene expression and energy metabolism (3) and has been shown to be an independent adverse prognostic factor for patient outcome in a variety of cancers (4).
The significance of hypoxia in the pathophysiology of tumors drives the rationale for its detection and quantification using PET imaging with radiolabeled hypoxia markers. The availability of multiple radiotracers and the sensitivity of PET favors its use over other imaging methods (5). 2-(2-nitro-1H-imidazol-1-yl)-N-(2,2,3,3,3-18F-pentafluoropropyl)-acetamide (18F-EF5; Supplemental Fig. 1A [supplemental materials are available online only at http://jnm.snmjournals.org]) is a new 2-nitroimidazole hypoxia imaging agent that has been thoroughly investigated in nonradioactive form as a marker for tumor hypoxia using immunofluorescence imaging methods. Studies have shown that increased EF5 binding in human tumors is prognostic for disease progression and treatment outcome (6,7). Moreover, recent studies in patients with head and neck cancer and glioblastoma have demonstrated the potential utility of 18F-EF5 for PET imaging of tumor hypoxia (8–10).
The development of drugs that are selectively active against hypoxic cells has emerged as a therapeutic approach for their elimination. Lead compounds have been hypoxia-activated prodrugs, which—analogous to 2-nitroimidazole hypoxia imaging agents—undergo bioreductive activation in hypoxic cells. However, in contrast to 2-nitroimidazoles, which are finally converted to relatively nontoxic reduced metabolites that bind irreversibly to protein thiols inside hypoxic cells, hypoxia-activated prodrugs (hypoxia-specific cytotoxins) are designed to yield metabolites that induce hypoxic cell death by reacting with DNA (11). Tirapazamine is the most extensively studied hypoxia-activated prodrug; other compounds that have advanced to clinical trials include TH-302, PR-104, and AQ4N (11).
SN30000 is a novel hypoxia-activated prodrug (Supplemental Fig. 1B) with improved physicochemical properties that result in higher tissue penetration capability and greater hypoxic cytotoxic potency than tirapazamine (12). It has recently been shown that EF5 and SN30000 are both activated by the same 1-electron reductases as a first step in their activation pathway (13). Moreover, metabolic reduction of SN30000 is highly correlated to EF5 binding in a variety of tumor cell lines under hypoxic conditions (13), suggesting that hypoxia imaging with 18F-EF5 can be a biomarker for oxiodoreductases and hypoxia, both of which are required for successful activation and therapeutic efficacy of SN30000 in killing hypoxic tumor cells. Building on these studies, we investigated the effects of SN30000 treatment on tumor hypoxia measured by 18F-EF5 PET and whether 18F-EF5 imaging can provide an early assessment of the success of SN30000 treatment on H460 human non–small cell lung cancer (NSCLC) xenografts in athymic rats.
MATERIALS AND METHODS
Drugs and Radiopharmaceutical Preparation
SN30000 was synthesized as previously described (12). The allyl precursor for the radiosynthesis of 18F-EF5 was provided by Varian Medical Systems, and radiolabeling was performed using carrier-added 18F-F2 gas as described previously (14) but via an improved methodology (15). All other reagents and solvents were purchased from commercial suppliers and used without any further modification.
Tumor Model and Imaging Studies
All experiments and procedures involving animals were performed in accordance with the guidelines established by the Duke University Institutional Animal Care and Use Committee. H460 xenografts were established by subcutaneous injection of 5 × 10⁶ cells, suspended in 100 μL of RPMI 1640 medium and Matrigel (1:1; BD Biosciences), into the right hind limb of female athymic rats (NIH-RNU; NCI Frederick National Lab). Imaging and treatment experiments were initiated 10–12 d after tumor implantation.
Small-animal PET imaging was performed on a microPET R4 scanner (Concorde Microsystems) for initial pilot imaging, followed by an eXplore VISTA small-animal PET/CT system (GE Healthcare) for the remainder of the experiments. Animals were anesthetized using 1.5%–2.0% isoflurane in medical-grade air and injected with 35.8 ± 13.4 MBq of 18F-EF5 via the tail vein. Rats were allowed to recover from anesthesia; 2.5 h later, animals were reanesthetized using isoflurane and static emission scans were acquired for 15–20 min. For initial experiments (R4 scanner), rats were administered pentobarbital sodium (50 mg/kg intraperitoneally) immediately after the posttreatment PET scan, and tumors were excised and snap-frozen for evaluation by immunohistochemistry. A perfusion marker, Hoechst 33342 (50 mg/kg dose; Sigma), was administered intravenously 2 min before tumor excision. For growth delay studies, the imaging protocol was as for the small-animal PET imaging. After the posttreatment scan, animals were monitored for changes in tumor volume and body weight 3 times weekly until tumors reached 3 times the treatment volume (V = [(width)2 × length]/2) or at least 60 d in the cases of complete remissions.
Additionally, tumors in growth delay studies were also monitored for changes in tumor oxygenation status before and after treatment using optical spectroscopy. A fiber optic–based spectrometer (SkinSkan) was used to measure hemoglobin absorption of illuminated light spectra (480–650 nm) and to quantify hemoglobin content and oxygen saturation (HbSO2) in tumors as described previously (16).
PET data were analyzed for the R4 scanner using 3-dimensional ordered-subset expectation maximization–maximum a posteriori reconstruction (2 and 18 iterations, respectively) without attenuation or scatter correction. For the VISTA scanner, images were reconstructed using an 2-dimensional ordered-subset expectation maximization algorithm (2 iterations, 16 subsets), and attenuation corrections were made using a short CT scan acquired immediately before the PET scan. Image analysis used AMIDE software (amide.sf.net). Three-dimensional regions of interest (ROIs) were drawn on all planes covering the entire tumor region. For images acquired with the VISTA PET/CT scanner, PET images were aligned with corresponding CT images to assist in tumor ROI delineation. Activity concentrations were converted to standardized uptake values (SUVs) for all voxels in ROIs, and mean SUV (SUVmean), median SUV, and maximal SUV were calculated for each tumor.
Radiation and SN30000 Treatment
Drug or radiation treatments (RTs) were performed 1 d after baseline PET scanning. Studies conducted on the R4 scanner included 2 treatment groups: control and SN30000. Tumor growth delay studies using the VISTA scanner consisted of 4 treatment groups: control, SN30000 alone, RT, and SN30000 plus RT. For all animals receiving SN30000, freshly prepared SN30000 in 50 mM phosphate-buffered saline were administered intraperitoneally at 90 mg/kg, which is 75% of the maximum tolerated dose. The maximum tolerated dose was determined before the start of the study, as previously described (14). For RT, tumors were irradiated using an X-rad 320 orthovoltage irradiator (Precision X-ray). The animal’s body was covered with a lead shield. Radiation was delivered by applying 2-mm aluminum filtration to a total dose of 15 Gy (320 kV; 2.3 Gy/min). Five minutes later, animals were treated with SN30000 as described above. Control and SN30000-alone groups received sham irradiation in place of RT, and saline was injected for animals in the control and RT groups that did not receive SN30000.
γ-Counting and Immunohistochemical Staining
For initial pilot studies, excised tumors were counted for radioactivity in an automatic γ-counter (Wallac Wizard, Perkin-Elmer), and their weights were recorded. For each tumor, counts per minute were converted to Bq/g of tumor tissue by correcting for the γ-counter efficiency and SUVs were calculated as [activity concentration in the tumor/injected dose] × body weight.
Immunohistochemical staining of cleaved caspase-3, a marker for apoptosis, was performed on 3 sections per tumor. Briefly, frozen tumor sections were air-dried and fixed by immersion in 3.7% formaldehyde for 15 min. This was followed by blocking with 5% donkey serum (Jackson Immunoresearch) and incubation with primary antibody recognizing cleaved caspase-3 (Cell Signaling) at 4°C overnight. Sections were then treated with fluorescein isothiocyanate (FITC)–conjugated antirabbit secondary antibody (Jackson Immunoresearch) for 1 h at room temperature in the dark. Stained sections were imaged using a fluorescence microscope (Axioskop 2 plus; Carl Zeiss, Inc.) at ×50 magnification for a predetermined exposure time. The 4′,6-diamidino-2-phenylindole (DAPI) filter set was used for imaging of Hoechst 33342 fluorescence before immunohistochemical staining, and apoptosis was imaged using an FITC filter. Images were acquired and stitched using MetaMorph imaging software (Molecular Devices Corp.). Prestained Hoechst images illustrated the in vivo perfusion pattern for each section. Tissue masks representing the total viable tumor area were generated for each section by excluding necrotic areas (Adobe Photoshop). An apoptosis index was obtained by applying the corresponding tissue mask and calculating the percentage of viable tumor tissue that stained positive for cleaved caspase-3, using the ImageJ program (version 1.46r; http://imagej.nih.gov/ij/).
Statistical Analyses
Results are presented as mean ± SD. Within-group comparisons (pre- vs. posttreatment) were made using paired t tests. Differences among treatment groups were assessed by 1-way ANOVA, followed by Tukey post hoc test. A Pearson correlation coefficient was calculated to determine the association between treatment-induced changes in 18F-EF5 uptake and baseline hypoxia level (18F-EF5 SUV). Significances in tumor growth delay studies were assessed using a log-rank test. All statistical analyses were performed using GraphPad Prism (GraphPad Software), and a P value of less than 0.05 was considered significant.
RESULTS
18F-EF5 was obtained in an 11% ± 2% radiochemical yield and 98% or more chemical and radiochemical purity (n = 18), with a specific activity of 327 ± 95 MBq/μmol. The radiosynthesis details are reported elsewhere (15).
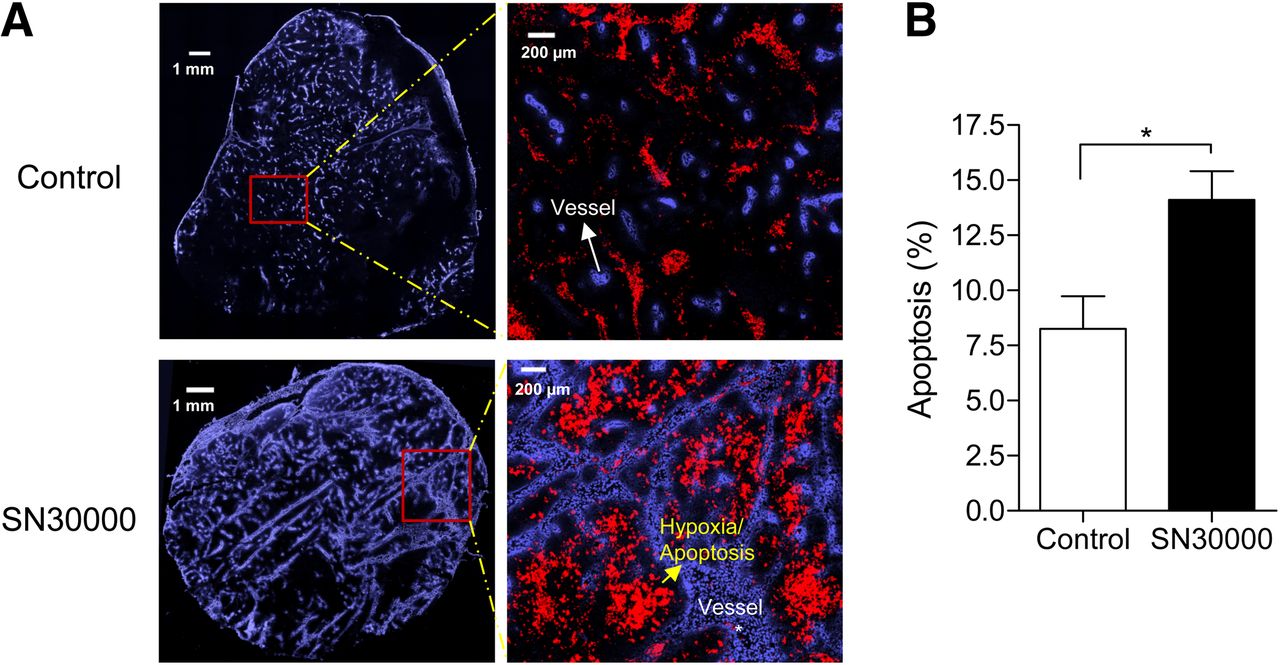
To examine the feasibility of imaging changes in hypoxia early after treatment of tumors with SN30000, H460 xenografts were imaged by 18F-EF5 PET before and 24 h after the treatment (Fig. 1). The average SUVmean for control and SN30000 groups was similar at baseline (0.52 ± 0.12 and 0.51 ± 0.20, respectively) whereas the 18F-EF5 uptake in posttreatment scans was significantly lower for the SN30000 group than the saline controls (average SUVmean, 0.44 ± 0.08, vs. 0.56 ± 0.08 for controls; P < 0.05). Likewise, γ-counting of excised tumors after the posttreatment scan also showed lower uptake of 18F-EF5 in SN30000-treated animals than in controls (Supplemental Fig. 2A). In immunohistochemical experiments, apoptosis in control tumors was detected mostly in areas distant from blood vessels and in necrotic regions, whereas in SN30000-treated tumors, a more uniform distribution of apoptotic cells was observed in less perfused but viable, and presumably hypoxic, tissue regions (Fig. 2A). Tumor apoptosis in the SN30000 group was 70% higher than that in controls (14.1% ± 3.1% vs. 8.3% ± 2.9%; P < 0.05, Fig. 2B). These results suggest that the lower uptake of 18F-EF5 seen in tumors after SN30000 treatment is due to ongoing hypoxic tumor cell chemodestruction.

Effect of SN30000 treatment on tumor hypoxia measured by 18F-EF5 PET at 24 h after treatment of female athymic rats implanted with H460 human NSCLC xenografts on right hind limb. (A) Average SUVmean for tumors before and after treatment with SN30000 (n = 6) or saline (n = 4). (B) Examples of 3-dimensional volume-rendered images of 18F-EF5 PET for tumors before and after treatment; arrow indicates tumors and corresponding SUVmean is shown below image. Error bars represent SEM. *P < 0.05.

Immunohistochemical analysis of H460 tumor sections from animals treated with saline (control) or SN30000. (A) Tumor sections showing in vivo perfusion marked by Hoechst 33342 in blue and apoptosis in red. (B) Percentage of cells positive for cleaved caspase-3 staining (apoptosis) for control and SN30000-treated tumors.
We next evaluated the effects of SN30000 treatment on 18F-EF5 uptake using monotherapy and in combination with RT. The early treatment-induced changes in 18F-EF5 uptake were compared with the therapeutic efficacy observed in growth delay studies after PET imaging. For these studies, PET imaging was performed on 35 animals. Pre- and posttreatment images were available for 32. One animal was excluded from the study because of illness, which was most likely associated with complications from the intraperitoneal injection. As an indicator of treatment-related toxicity, changes in body weight were recorded for all animals up to 35 d after the treatment (Supplemental Fig. 3). The highest reduction in body weight was observed for the combination-treatment group (SN30000 plus RT) on day 5 after the therapy (−7.3% ± 5.3%). No other treatment-related toxicities were observed.
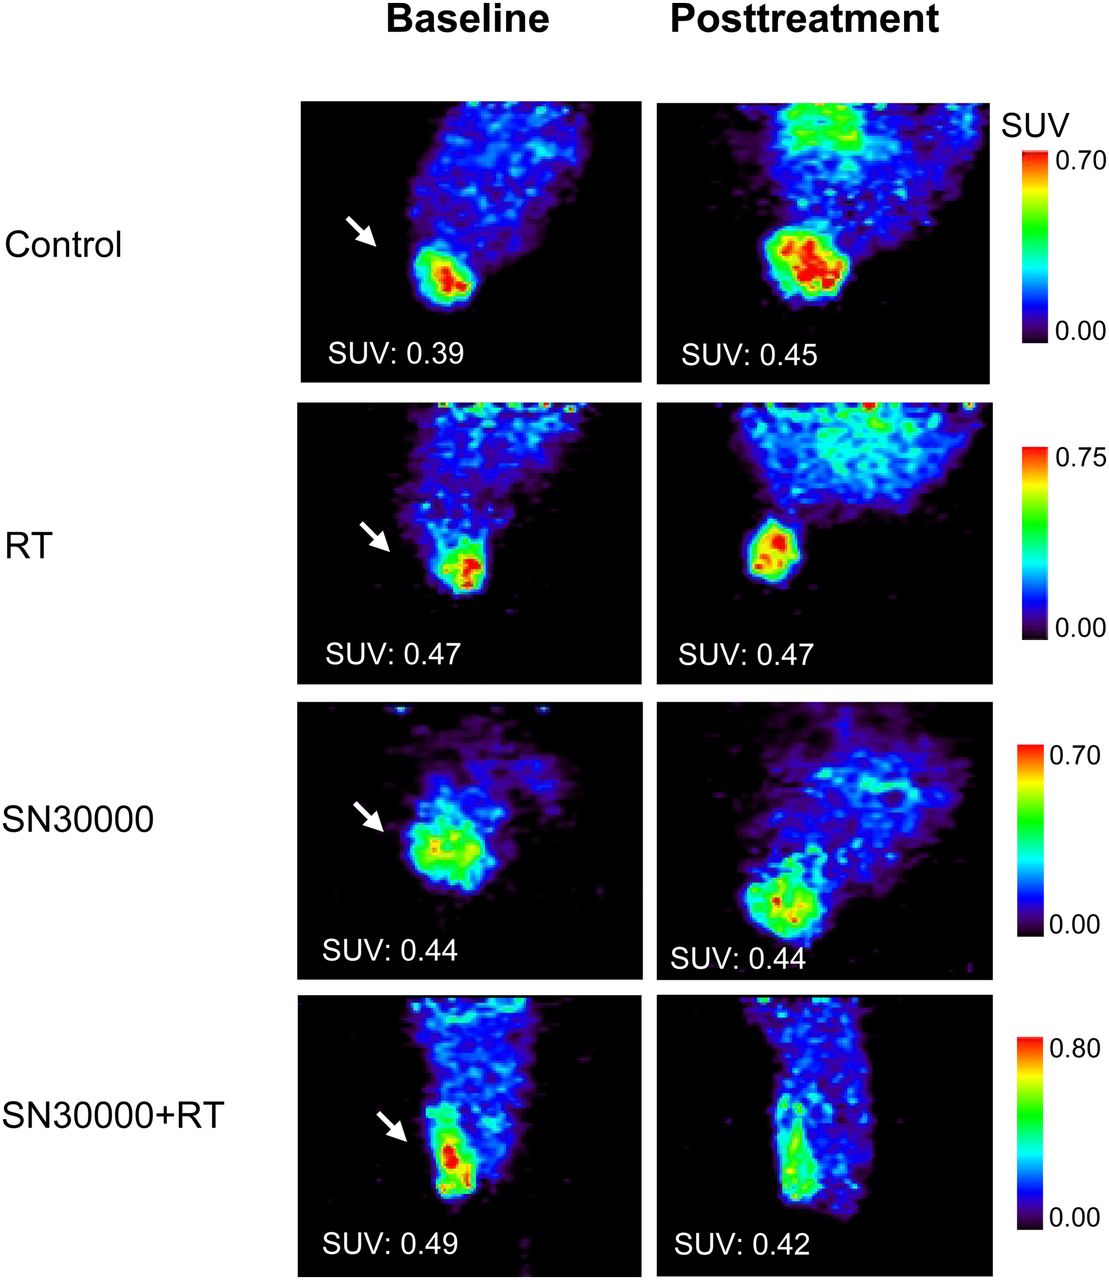
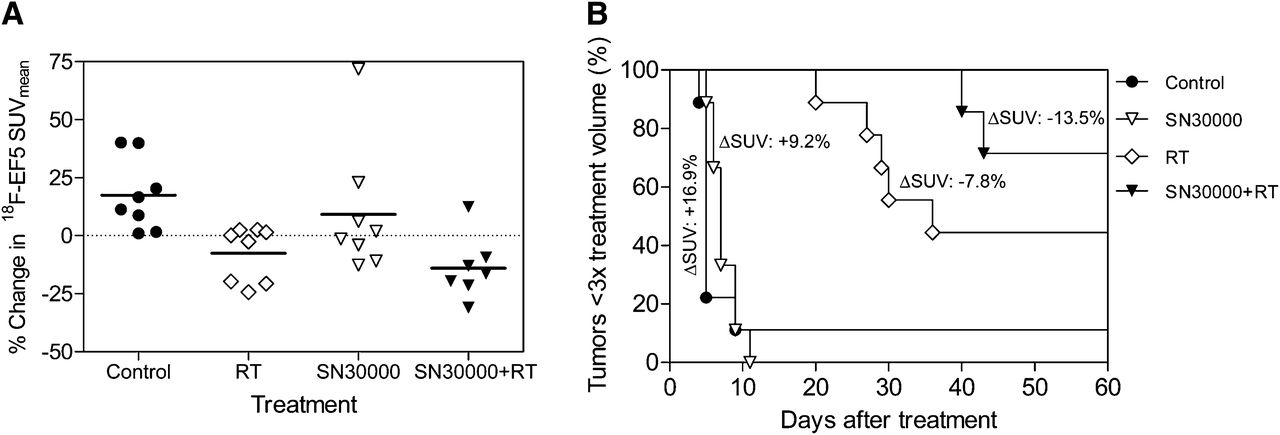
The pretreatment average SUVmean for all tumors in growth delay studies was 0.46 ± 0.10, and the mean tumor volume was 892 ± 464 mm3. The effect of treatment on 18F-EF5 uptake was assessed by measuring change in SUVmean after treatment (ΔSUV) for the different treatments and saline controls (Table 1). Examples of baseline and posttreatment 18F-EF5 PET images for size-matched tumors from different treatment groups are shown in Figure 3. Figure 4A shows the percentage change in SUVmean for individual tumors after the treatment. Tumors in the control group showed a significant increase in SUVmean (up to 40%; P < 0.05), suggesting an increase in hypoxia levels with time (Table 1). Five of 8 tumors in the RT-alone group exhibited little or no change in 18F-EF5 uptake, whereas the other 3 exhibited a decrease in SUVmean. Tumors in the SN30000-alone group showed variable response by 18F-EF5 PET imaging. In general, only tumors with higher initial SUVmean showed reduction in 18F-EF5 uptake after treatment. On the other hand, treatment with SN30000 plus RT decreased 18F-EF5 uptake in all but 1 tumor, with SUVmean decreases ranging from 9% to 31% (P < 0.05).
Changes in 18F-EF5 Uptake After SN30000 Plus RT in Tumor Growth Delay Studies Using H460 Human NSCLC Xenografts

Examples of 18F-EF5 PET images of female athymic rats bearing H460 human NSCLC xenografts at baseline and 1 d after treatment with RT (15 Gy), SN30000 plus RT (15 Gy plus 90 mg/kg), or SN30000 alone (90 mg/kg) in tumor growth delay studies. Arrow indicates tumors, and corresponding SUVmean is shown on images.

Comparison of early treatment-induced changes in 18F-EF5 PET imaging with tumor response observed in growth delay studies. (A) Percentage change in 18F-EF5 uptake for tumors relative to baseline. (B) Activity of SN30000 chemoradiotherapy against H460 tumor xenografts in tumor regrowth assays after PET studies. Average change in SUVmean for each treatment group is shown next to corresponding Kaplan–Meyer curve. SN30000 as single agent had no significant effect on tumor growth delay, compared with significant growth delay by RT alone (P < 0.01) and highly significant inhibition by combination therapy (P = 0.001).
In agreement with changes observed in 18F-EF5 PET imaging, RT and SN30000 plus RT had prolonged tumor growth delay, compared with controls (Fig. 4B; Table 1). SN30000 plus RT demonstrated the greatest antitumor effect, which resulted in a complete remission rate of 71% versus 44% in the RT-alone group. SN30000 alone did not exhibit a significant effect on growth delay, compared with controls. The median time for tumors to reach 3 times their pretreatment volume was 5 d for controls, 7 d for SN30000, and 36 d for RT alone (Fig. 4B). With SN30000 plus RT, only 2 of the 7 treated tumors reached 3 times the treatment volume (at 40 and 43 d); however, 1 of these 2 tumors eventually regressed.
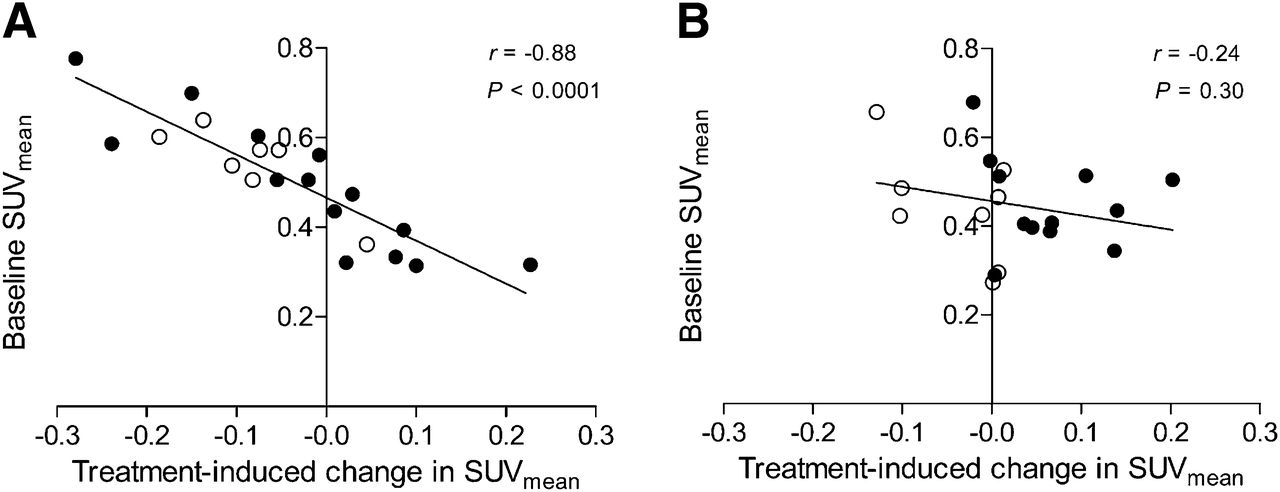
Consistent with the mechanism of hypoxia prodrug activation of SN30000, an inverse correlation was observed between pretreatment hypoxia levels (18F-EF5 SUVmean) and the magnitude of change (ΔSUV) observed in the posttreatment scan for SN30000-treated tumors with or without RT (Fig. 5A; r = −0.88, P < 0.0001). No such correlation was observed for tumors that did not receive SN30000 (Fig. 5B). Voxelwise analyses of the PET data were performed on pooled voxels for each treatment group to further examine the effects of treatments on the distribution and intensity of voxels in posttreatment scans (17). Percentiles of voxels were plotted against voxel intensity (SUV) as cumulative distribution curves (Fig. 6). Comparison of pre- and posttreatment curves shows a shift toward increasing SUV for control tumors, suggesting an increased level of hypoxia with time (Fig. 6A). The mean and median voxel intensities increased significantly for control tumors in the posttreatment scan (Supplemental Table 1). The percentile distribution of voxels in the SN30000-alone group remained nearly identical for the 2 scans, most likely as a result of balance between the SUV decreases observed in half of the treated animals versus increases in the others (Figs. 4A and 6B). The posttreatment curve in the RT-alone group displayed a left shift toward lower SUVs, possibly because of greater decrease in 18F-EF5 uptake (SUVmean) in 3 of the 8 treated tumors (Fig. 4A); however, the overall changes in voxelwise analysis were not statistically significant (Fig. 6C; Supplemental Table 1). The posttreatment curve in the SN30000-plus-RT group exhibited a significant left shift toward lower SUVs. In posttreatment scans, the SUVmean decreased from 0.54 ± 0.10 to 0.46 ± 0.05 (−13.5%; P < 0.05), and the median SUV decreased from 0.52 ± 0.10 to 0.44 ± 0.05 (−13.4%; P < 0.05). Similar decreases were also observed in maximal intensity values (−20%; P < 0.01), suggesting significant reduction or shift of preexisting higher hypoxic voxels to lower hypoxic voxels after SN30000 plus RT (Fig. 6D; Supplemental Table 1). Histogram plots of voxel intensity versus number of voxels for all treatment groups are presented in Supplemental Figures 4 and 5.

Association of treatment-induced change in 18F-EF5 uptake with pretreatment hypoxia level. (A) For tumors treated with SN30000 (• = SN30000 alone; ○ = SN30000 plus RT). (B) For tumors not receiving SN30000 (• = saline controls; ○ = RT alone tumors). Linear regression line, Pearson correlation coefficient (r), and P values are shown for associations in A and B.
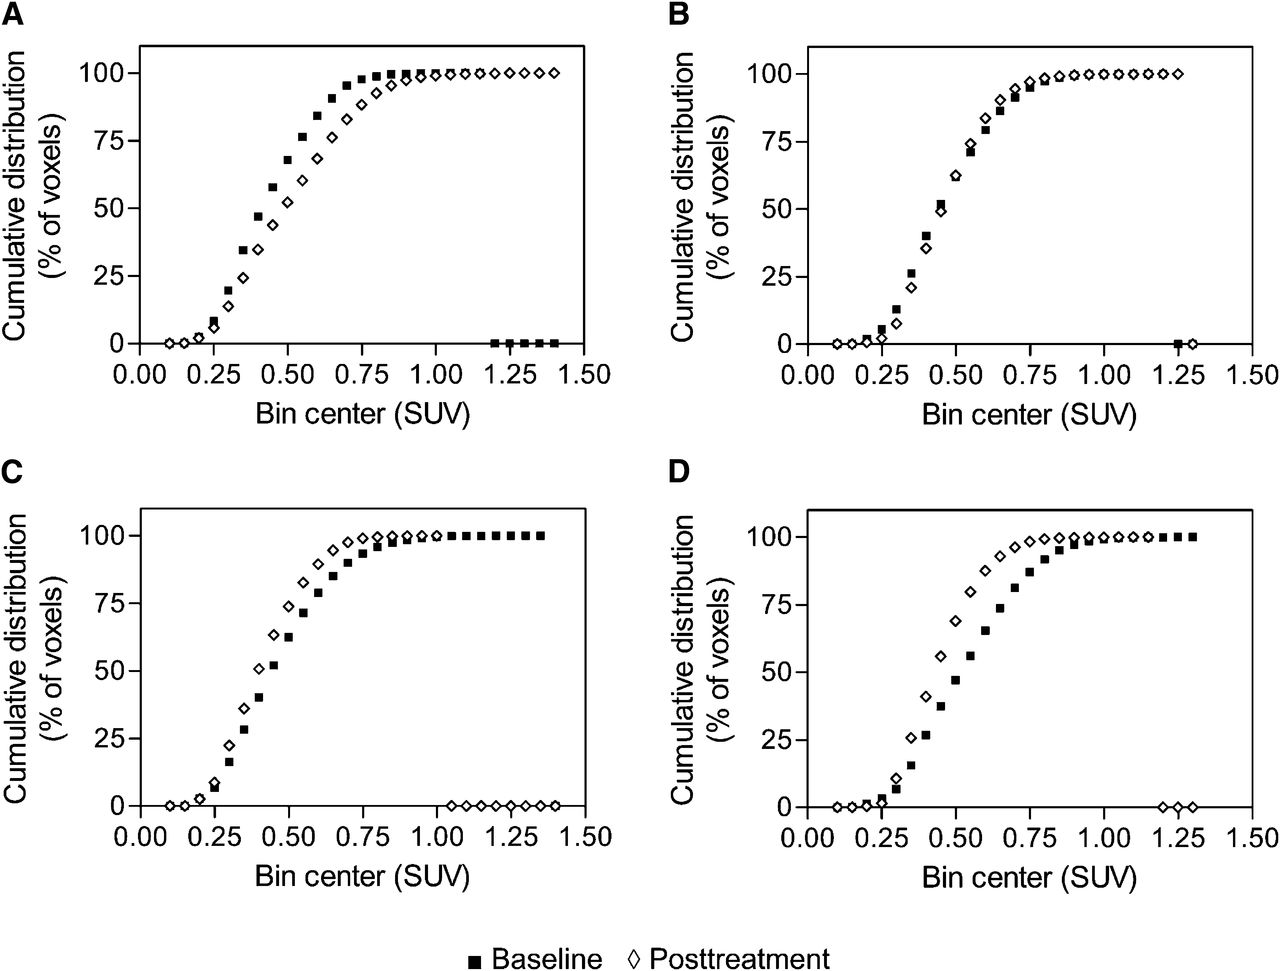
Voxelwise analyses of 18F-EF5 PET data from tumor growth delay studies. Individual voxel values within tumor ROIs were pooled for all animals in treatment group and rebinned according to voxel intensity (SUV) with bin width of 0.05. Cumulative percentile distribution of voxel intensities before and after treatment for control (A), SN30000 (B), RT (C), and SN30000-plus-RT (D) groups. Statistical comparisons are made for average voxel intensities and presented in Supplemental Table 1.
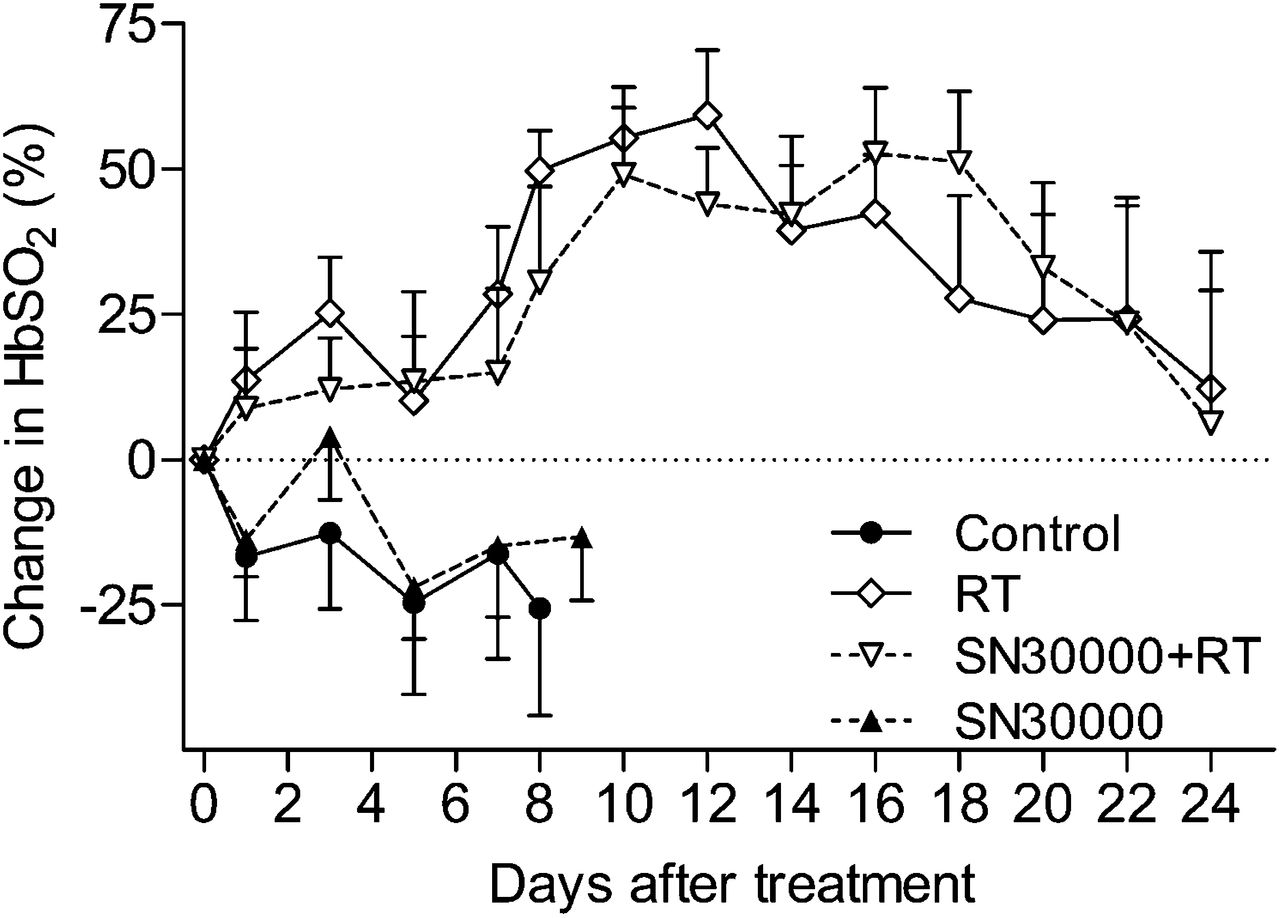
Figure 7 illustrates mean changes in tumor HbSO2 measured using optical spectroscopy after treatment. Radiation increased HbSO2 by 24 h after treatment, with increases persisting for more than 3 wk. The increase in HbSO2 was statistically significant on day 3 and days 7–16 for the RT-alone group and from days 10 to 16 for the SN30000 plus RT. These increases appear to be a consequence of increased HbO2 (Supplemental Fig. 6B) and hemoglobin content (Fig. 6C) in response to RT. Oxygen saturation in the SN30000-alone group decreased at 24 h but showed improvement at 72 h after treatment relative to baseline and untreated controls (Fig. 7). A moderate but significant inverse correlation was observed between hypoxia measured by 18F-EF5 PET and HbSO2 measured by optical spectroscopy (r = −0.41, P < 0.05; Supplemental Fig. 6D), corroborating the hypoxia dependence of 18F-EF5 uptake.

Posttreatment changes in tumor oxygenation status measured using quantitative optical spectroscopy and presented as mean changes in tumor HbSO2 relative to baseline.
DISCUSSION
Despite encouraging early-stage results with the most thoroughly studied hypoxia-activated prodrug tirapazamine (18), pivotal phase III studies in advanced NSCLC and head and neck cancer patients failed to demonstrate survival benefit with the addition of this agent to chemotherapy and RT (19). However, 18F-fluoromisonidazole or 18F-fluoroazomycin arabinoside hypoxia imaging and retrospective analysis in a subset of patients in these studies demonstrated clear benefits of tirapazamine treatment outcome in patients whose tumors were determined to be hypoxic by PET before treatment (20). These results and those from animal models suggest the value of hypoxia imaging with 2-nitroimidazole tracers for optimizing the potential utility of hypoxia-activated prodrug therapy (21). Herein, we have applied this hypothesis to evaluate SN30000, which—compared with tirapazamine—has a higher diffusion coefficient, has improved solubility, and is approximately 3-fold more toxic to hypoxic cells in human tumor xenografts, including the H460 tumor model used in this study (12).
Our experiments show for the first time, to our knowledge, that hypoxia imaging with 18F-EF5 can demonstrate reduction in hypoxia and provide early information on tumor response to SN30000-containing treatment regimens; however, our study has some limitations. First, because of logistical barriers in transportation of radioactive animals to the RT facility, drug and RT were administered on the day after the baseline PET scan. It is possible that hypoxia levels varied between baseline PET scan and treatment time; however, if present, this effect presumably would be similar for all treatment groups. Second, the group sizes and magnitude of the early changes in 18F-EF5 PET signal in response to treatment did not permit the evaluation of the correlation of early changes with tumor response at the individual tumor level. Finally, 24 h was selected as the posttreatment imaging time point based on our initial results using SN30000 alone (Fig. 1) and taking into consideration the rapid conversion of SN30000 to cytotoxic metabolites in hypoxic cells in vivo (12); however, the kinetics of SN30000-mediated hypoxic cell death are likely to depend on the duration of treatment and may vary between tumor models.
In this study, SN30000 treatment alone resulted in a mild to moderate decrease in posttreatment 18F-EF5 uptake primarily in tumors with higher pretreatment SUVmean, consistent with the expectation that more hypoxic tumors are likely to show greater response to SN30000 in 18F-EF5 PET imaging. However, there are several other factors that could alter 18F-EF5 uptake between the 2 imaging sessions such as the indirect dependence of hypoxia on tumor size. In this study, 18F-EF5 uptake was significantly correlated with tumor size (Supplemental Fig. 7A), and SN30000-treated tumors that exhibited a decrease in 18F-EF5 PET imaging were significantly larger and more hypoxic at baseline than those that did not (mean volume, 985 vs. 475 mm3, and P < 0.05; average SUVmean, 0.61 vs. 0.37, and P < 0.001).
Additionally, it is important to consider the complex nature of tumor hypoxia and the influence of other features of cellular microenvironment—such as the proliferation rate of nonhypoxic tumor cells at the time of treatment and rehypoxification effects—on the uptake of 18F-EF5 after treatment. For example, after treatment with the hypoxic cytotoxin tirapazamine, the tumor hypoxic cell fraction can return to pretreatment levels in only 3–5 h (22). Cycling hypoxia caused primarily by fluctuations in vascular pO2 due to changes in red cell flux can also contribute to the formation of new hypoxic cells and may influence 18F-EF5 tumor uptake in posttreatment scans (2,23). Immunohistochemistry experiments revealed significantly higher apoptosis in SN30000-treated tumors, even in animals in which reduction of 18F-EF5 uptake was not observed in the first experiments. Although this confirms the therapeutic activity of SN30000 in these tumors, the mismatch between the 18F-EF5 PET and apoptosis data also reflects differences in oxygen dependence between the 2-nitroimidazole radiotracers, which show accumulation in severely hypoxic cells, compared with SN30000 activation, also occurs under relatively mild hypoxic conditions (12).
Consistent with the decreased sensitivity of hypoxic cells to therapeutic radiation, pretreatment 18F-EF5 SUV was negatively correlated to tumor response in growth delay studies and showed a trend toward statistical significance (r = −0.701, P = 0.053) in the RT-alone group but not in the SN30000-plus-RT group (r = −0.49, P = 0.27). These results suggest that pretreatment 18F-EF5 uptake is predictive of tumor response to SN30000 chemoradiotherapy. At group levels, treatment-induced tumor growth delay was in accordance with early changes observed on 18F-EF5 PET (Fig. 4). Tumors treated with SN30000 plus RT showed the highest and most significant decrease in 18F-EF5 SUVs, with a mean decrease of 13.5%, compared with 7.8% for RT alone. However, differences in tumor growth delay between the RT and SN30000-plus-RT groups were not observed until 20 d after treatment (Fig. 4B), suggesting that 18F-EF5 PET can provide an earlier assessment of tumor response to combination therapy.
In the 6 of 7 animals with a decrease in 18F-EF5 uptake after SN30000 plus RT, a 9%–31% decline in SUVmean was observed. Using the assessment of early metabolic response to chemotherapy with 18F-FDG as a benchmark for comparison, Weber et al. reported that a reduction of tumor 18F-FDG SUV by 20% or more relative to baseline was an independent predictor of long-term survival in patients with advanced NSCLC (24). Similarly, Hoekstra et al. found that a decrease of 35% in 18F-FDG uptake was able to discriminate responders from nonresponders (25). On the basis of the test–retest reproducibility of 18F-FDG PET, it has been suggested that a decrease in tumor SUV by more than 20% could be used as the criterion for a metabolic response (26). Although such recommendations do not exist for the evaluation of antihypoxic tumor therapies with PET, determining even general criteria for hypoxia imaging agents will be challenging because of the spatial heterogeneity and temporal variability of hypoxia in tumors (23,27). In addition to the different uptake mechanisms for 18F-FDG and 18F-EF5, clinical posttreatment 18F-FDG scans are typically performed 3–4 wk after initiation, or after completion of treatment, compared with the 24 h used in this preclinical study.
Improved oxygenation during fractionated radiotherapy has been demonstrated in NSCLC patients by 18F-FMISO PET; however, these observations were inconsistent and unpredictable (28,29). In the current study, 5 of 8 tumors in the RT-alone group showed minimal change in 18F-EF5 uptake between the 2 scans, whereas 3 exhibited decreases comparable to those in the SN30000-plus-RT group. Because SN30000 is a hypoxic-cytotoxin and not a radiosensitizer, it was administered 5 min after RT to ensure that the effects of SN30000 were primarily due to its hypoxic cell cytotoxicity rather than hypoxic cell sensitization of RT. Nonetheless, the immediate effects of RT on tumor blood flow and consequent changes in tumor hypoxic fraction might also influence the bioreduction of SN30000 and thus tumor sensitivity to the combination therapy.
Although a single dose of SN30000 was used in the current study, clinical trials with hypoxia-activated prodrugs generally involve multidose regimens combined with fractionated radiation to maximize hypoxic cell killing. Posttreatment 18F-EF5 imaging was performed at 24 h because cytotoxic metabolites are generated quite rapidly after SN30000 treatment, and drug-induced apoptosis was detectable as early as 24 h after treatment. However, it is possible that a significant proportion of tumor cells that were targeted by SN30000 still had intact nitroreductases capable of accumulating 18F-EF5 at that time. Experiments are planned to investigate whether imaging at later time points after treatment or the use of multidose SN30000-plus-RT regimens would show greater reduction in 18F-EF5 uptake, thereby increasing the ability of 18F-EF5 PET to predict treatment outcome. Consistent with the hypoxia-activated mechanism of this prodrug, a strong inverse correlation was found between baseline 18F-EF5 uptake and the change in SUV in tumors treated with SN30000 with or without RT (Fig. 5), signifying the ability of 18F-EF5 to track the antihypoxic activity of SN30000 in tumors.
Longitudinal changes in tumor oxygenation after treatment were monitored by optical spectroscopy. These measurements revealed an increase in oxygen concentration and hemoglobin oxygen saturation in response to RT, suggesting that the stabilization or reduction in 18F-EF5 uptake seen in some tumors in the RT-alone group is presumably due to reoxygenation effects rather than hypoxic cell kill (30).
CONCLUSION
Tumor imaging with 18F-EF5 enables the measurement of early changes in tumor oxygenation status in response to treatment with the novel hypoxia-activated prodrug SN30000. In concordance with previous studies (12), the effects of SN30000 on tumor growth delay were greater when used in combination with RT. Our findings suggest that successful identification and elimination of hypoxic cells using a combination of hypoxia imaging and an hypoxic cytotoxin substantially improve overall tumor response to RT. Evaluation of 18F-EF5 in additional tumor models and with more clinically relevant multifraction SN30000-plus-RT regimens is needed to establish its potential as an early response biomarker for implementation in the clinical development of SN30000.
DISCLOSURE
The costs of publication of this article were defrayed in part by the payment of page charges. Therefore, and solely to indicate this fact, this article is hereby marked “advertisement” in accordance with 18 USC section 1734. This work was supported by grants from Varian Medical Systems and the NIH (CA40355, CA42324, and P41EB0015897). No other potential conflict of interest relevant to this article was reported.
Acknowledgments
We thank Joseph Herbert, Kevin Guley, and Carla Johnson for their assistance with animal experiments and Shawn Murphy and Michael Dailey for their assistance with 18F-EF5 production.
Footnotes
Published online Jun. 5, 2013.
- © 2013 by the Society of Nuclear Medicine and Molecular Imaging, Inc.
REFERENCES
- Received for publication November 5, 2012.
- Accepted for publication January 28, 2013.


