


Abstract
The introduction of fast scintillators with good stopping power for 511-keV photons has renewed interest in time-of-flight (TOF) PET. The ability to measure the difference between the arrival times of a pair of photons originating from positron annihilation improves the image signal-to-noise ratio (SNR). The level of improvement depends upon the extent and distribution of the positron activity and the time resolution of the PET scanner. While specific estimates can be made for phantom imaging, the impact of TOF PET is more difficult to quantify in clinical situations. The results presented here quantify the benefit of TOF in a challenging phantom experiment and then assess both qualitatively and quantitatively the impact of incorporating TOF information into the reconstruction of clinical studies. A clear correlation between patient body mass index and gain in SNR was observed in this study involving 100 oncology patient studies, with a gain due to TOF ranging from 1.1 to 1.8, which is consistent with the 590-ps time resolution of the TOF PET scanner. The visual comparison of TOF and non-TOF images performed by two nuclear medicine physicians confirmed the advantages of incorporating TOF into the reconstruction, advantages that include better definition of small lesions and image details, improved uniformity, and noise reduction.
The potential for PET to measure the difference in arrival times of a pair of photons from the annihilation of the positron was first explored during the early 1980s (1,2), and an improvement in signal-to-noise ratio (SNR) due to time-of-flight (TOF) information was expected. The scintillators that were available at that time were fast but had lower stopping power than bismuth germanate, the scintillator conventionally used for PET imaging because of its excellent stopping power for 511-keV photons. The low sensitivity of these early TOF PET systems could not be offset by the SNR improvement due to TOF, and thus interest in this approach declined. The introduction, during the late 1990s, of cerium-doped lutetium oxyorthosilicate (3), LSO(Ce), a scintillator that is both fast and has good stopping power for PET imaging, and the more recent development of very fast scintillators such as LaBr3, has reawakened interest in TOF PET (4–6), and the first commercial TOF PET scanners have been recently introduced (7,8). A fast scintillator can provide good timing resolution and therefore information on the position of the positron annihilation: the relationship between the spatial uncertainty (Δx) and the timing resolution (Δt) is given by the expression Δx = cΔt/2, where c is the speed of light. With LSO-based PET scanners, the time difference between the arrival times can be measured to be better than 600 ps, which corresponds to a spatial uncertainty of less than 9 cm. While insufficient to place the annihilation within a single voxel, such an uncertainty is better than having no localizing information and assigning equal probability to all voxels along the line of response (LOR).
When data are organized in sinograms, TOF data acquisition assigns each event to a sinogram depending on the measured time difference for that event. There is, therefore, a complete set of 3-dimensional (3D) sinograms for each time bin. This timing information is then taken into account during the fully 3D reconstruction of the data. The image obtained incorporating the timing information can be directly compared with the image reconstructed without timing information, and the improvement in SNR assessed. It is shown in (1) that the expected gain in SNR due to TOF can be estimated from the expression √(D/Δx), where D is the diameter of the positron-emitting distribution. Thus, for a 40-cm-diameter uniform distribution of radioactivity and a timing resolution of 600 ps, the SNR improvement is a factor of 2.1. The gain is greater for larger diameter distributions (bigger values of D), suggesting that the benefits of TOF will be more evident for larger patients than smaller ones. In an effort to verify this assumption and to assess the clinical impact of TOF, the SNR was estimated for some challenging imaging conditions of the National Electrical Manufacturers Association (NEMA) image quality phantom without and with TOF. These studies helped to define the appropriate reconstruction parameters that would result in the optimal image.
A series of 100 cancer patients was acquired on a prototype PET/CT scanner with TOF capability and the studies reconstructed both without and with the timing information. Image quality was assessed subjectively by two nuclear medicine physicians, who reviewed all studies without knowing which of the pair of images for each patient was reconstructed with TOF. A quantitative analysis was performed by estimating SNR as a function of the number of iterations in the reconstruction, and contrast as a function of noise for different numbers of iterations. The SNR gain due to TOF was measured for tumors in the abdomen, thorax, and head and neck, and the gain was plotted as a function of body mass index (BMI) for each body region. This paper will present both a subjective and a quantitative assessment of the impact of TOF for clinical imaging. The evaluation of the patient studies will be illustrated with some typical cases.
MATERIALS AND METHODS
PET/CT Scanner with TOF
All studies were acquired on a prototype TOF PET scanner developed at Siemens Healthcare, Molecular Imaging, and installed at the University of Tennessee Medical Center. The scanner is based on the Biograph 6 TruePoint PET/CT (Siemens Healthcare, Molecular Imaging) (9), with extended axial coverage (TrueV), and TOF capability added through modifications to the detectors and electronics. The PET scanner comprises 192 LSO detector blocks assembled in four rings, and each block is partitioned into 13 × 13 crystal elements (4 × 4 × 20 mm3). The four detector block rings cover a 21.8-cm axial field of view (FOV) with a 70-cm-diameter patient port. The TOF information is encoded in the list mode data with time bins of 78-ps width; the intrinsic system time resolution of the TOF PET scanner from the list mode data was measured to be 550 ps. After reorganization of the data into sinograms with 312-ps time bins, the system resolution was measured to be 590 ps. The energy resolution was 11%, and the accepted energy window was 435 keV to 650 keV.
Data were acquired in list mode and then rebinned into both conventional sinograms and TOF sinograms. Conventional non-TOF sinograms had two separate prompt and random coincidence sinograms; each of them consisted of 336 × 336 transaxial pixels for 559 planes. TOF prompt sinograms consisted of 336 × 336 × 559 pixels, for each of the 15 TOF bins (from −7 to +7), 312 ps wide, covering a total of 4.68 ns coincidence time window. Random events were summed into one TOF bin (336 × 336 × 559 voxels), covering the whole coincidence time window.
Reconstruction Methods
The reconstruction method was 3D ordinary Poisson (OP) ordered-subsets expectation maximization (OSEM) (10) with point spread function (PSF) (11) included in the projector. This non-TOF PSF method is also known as HD·PET (Siemens Healthcare, Molecular Imaging).
The non-TOF iterative reconstruction algorithm was modified to include the TOF information in the projector. The OP OSEM method updates the image iteratively, matching measured prompt data Yti with their modeled means, assuming and preserving Poisson statistics. The index t represents TOF bin and index i represents regular non-TOF projection bin. The prompt coincidences mean value  , at iteration n, is linearly related to the image estimate
  as follows:
 Eq. 1where the index j identifies the image voxel, A is the attenuation correction array, N the normalization correction array,
  is the scatter estimate array, and
  is the mean random estimation from measured delayed counts. While attenuation correction A, normalization N, and random estimate
  are independent of the TOF bin, the scatter estimate
  is obtained with a new TOF single scatter simulation (12).
Introducing the TOF information in the reconstruction, the OSEM update equation remains unchanged, but the forward and back projectors are extended to include the extra TOF dimension (13). The system matrix C is decomposed into a non-TOF spatial part c and a TOF profile p: Eq. 2
Eq. 2
The system matrix element cij is the probability that an event originating in voxel j is detected in projection i (including the PSF information), and ptij is the probability that the event originated in voxel j is detected in projection i with TOF index t. The forward projector preserves a TOF index in the estimated emission sinogram, while the back projector integrates also in the TOF dimension, when it produces an estimate of the image. A 590-ps-wide time resolution kernel was used in TOF reconstruction. This kernel was larger than the intrinsic time resolution of the system, measured from the list mode data, since rebinning the data into a sinogram with 312-ps-wide TOF bins results in blurring of the time resolution. The probability ptij is computed from a time spread function (TSF) along the direction of the line of response identified by i. The TSF is assumed to be a Gaussian with full width at half maximum equal to the effective time resolution. The TSF is sampled at TOF bin values, and the resulting probability is normalized such that
In iterative reconstruction techniques such as OSEM, the choice of subset and iteration number affects the degree of convergence and the noise level in the image, both of which are related: an increased number of iterations achieves better convergence (and contrast recovery) but at the cost of a higher level of noise. For all the images reconstructed in this work, 14 subsets were used. The choice of iteration number should be tailored to the desired convergence level or noise level, data statistics, and diagnostic task and should be optimized separately for each specific method (TOF or non-TOF). Some of the phantom studies presented here, and described in detail in the next section, were aimed at estimating the appropriate number of iterations for both non-TOF and TOF methods, to optimize the depiction of small lesions (<2 cm) in oncology patients, with statistics typical of oncology scans acquired for 2–3 min per bed position.
Most of the reconstructed images were 168 × 168 pixels (transaxial), corresponding to a 4-mm transaxial pixel size, which is the clinical standard for oncology. The number of axial slices was correlated to the number of bed positions needed to cover the field of view of interest. A single bed position has 109 planes, corresponding to a 2-mm slice thickness. Some images were reconstructed at higher resolution, 336 × 336 pixels (transaxial), corresponding to a 2-mm transaxial pixel size. No post-reconstruction low-pass filters were used on the images. The measured spatial resolution on the PET scanner is less than 6 mm if a larger pixel size is used (4 mm) and less than 4.5 mm if a smaller pixel size is used (2 mm).
Lesion SNR, Contrast, and Noise
Complete evaluation of reconstruction algorithm performance requires task-based assessment of image quality under broad imaging conditions. We previously performed an in-depth evaluation of TOF effects upon oncologic lesion detection in a complex phantom (14); this paper builds upon that work by assessing TOF effects with the NEMA phantom and an oncologic patient population with a range of body sizes. Quantitative figures of merit for lesion SNR, contrast, and noise were used as described here. The lesion SNR was computed as the difference between the lesion and background compared to the noise in the background: Eq. 3where the signal is defined as the mean value in a region of interest (ROI) well inside the lesion, the background is defined as the mean value in a ROI localized in a fairly uniform area outside the lesion, and the noise in this formula is defined as the SD of the value in the background ROI. In particular, for both phantom and patient studies, we used an ROI including about 50% of the visible lesion. The use of a noise estimate from a location such as the liver that is distant from the lesion is a limitation of the method. However, in most cases it is difficult to find a reasonably homogeneous region close to the lesion—hence the necessity to use the liver, where the uptake is expected to be reasonably uniform. Thus, while this methodology does not measure the SNR of the lesion directly it does characterize the effect of TOF on a relatively uniform region while accounting for the corresponding effects on the lesion.
The contrast, or contrast recovery if the input contrast is known a priori, is a measure of the convergence of an iterative algorithm, and contrast tends to increase and converge toward an asymptotic “true” value. In this work the contrast was defined as: Eq. 4
Eq. 4
The noise, or normalized noise, is the undesired effect of convergence, since the noise increases monotonically with each iteration. The noise is computed in this work as: Eq. 5
Eq. 5
Phantom Study A: Optimizing Reconstruction for Lesion SNR
A phantom study was performed in order to assess how many iterations are required (using 14 subsets) to optimize lesion SNR. The results of this study were later confirmed with actual lesions identified in patient images. A NEMA image quality phantom was filled with 18F liquid solution. The four smaller spheres (diameter 10, 13, 17, and 22 mm) were filled with a concentration 8 times the background. The two largest spheres, 28 mm and 37 mm, were filled with water. The central lung insert was left with no activity. The total activity in the FOV was about 37 MBq (1 mCi). A 30-min list mode scan was acquired that comprised 461 × 106 prompt counts and 63 × 106 delayed randoms. The reconstruction, TOF and non-TOF, was performed with 14 subsets, and the results of up to 8 iterations were analyzed. Image matrix size was 168 × 168 × 109 voxels. Lesion SNR, contrast, and noise were studied as a function of iteration number for the 10-, 13-, and 17-mm spheres (i.e., those spheres smaller than 2 cm).
Phantom Study B: Evaluating the Ability of TOF Reconstruction to Recover Low Input Contrast
While the NEMA standard requires the assessment of the image quality of a PET scanner using phantoms with high contrast of 4:1 and 8:1, clinical practice usually has to face more challenging situations of lower contrast. In this experiment, the same image quality phantom described in the section above was used with all six spheres filled with an 18F liquid solution corresponding to a 2:1 contrast between the hot spheres and the background. The central lung insert was left with no activity. A 1-h list mode scan was performed acquiring 623 × 106 prompt counts and 72 × 106 delayed randoms. The first 5 min of data were extracted from the list mode file in order to also have a low-statistics sample. The purpose of this study was to assess the recovery of small lesions (<2 cm) when lesion-to-background contrast was very low (2:1). Data were reconstructed with a matrix size of 168 × 168 corresponding to a voxel size of 4 mm, and with a high-resolution mode, 336 × 336 pixels per transaxial section for a 2-mm pixel size.
Patient Studies: Assessment of the Impact of TOF on Image Quality
Over 100 clinical oncology studies were acquired with TOF information. For each study, data acquisition began approximately 90 min after intravenous injection of 370 MBq (10 mCi) of 18F-FDG. Data were acquired at 4 or 5 bed positions (depending on the patient) for 2 min per bed position; for larger patients, in excess of 110 kg (250 lb), acquisition was for 3 min per bed position. All studies were reconstructed with 3D OP OSEM with PSF. A conventional version of the algorithm without TOF information was used to reconstruct non-TOF images, and a version incorporating a 590-ps TOF time resolution kernel was used to reconstruct the TOF images. The image matrix for the patient studies was 168 × 168 corresponding to a 4-mm in-plane pixel size, with a plane thickness of 2 mm. No low-pass, smoothing filter was applied to the images after reconstruction, and hence all reconstructed images are unsmoothed.
Optimization was performed using both phantoms, as described in the previous section, and patient studies. For the patient studies, optimization of the reconstruction methodology was achieved using two separate approaches. The first approach was a subjective assessment of image quality by two experts, including a physicist and a nuclear medicine physician. The experts examined a series of four patient studies reconstructed with 14 subsets and with 1–8 iterations for both non-TOF and TOF; the experts did not know whether TOF information had been incorporated. After a careful review it was agreed that a choice of 2 iterations for TOF and 4 iterations for non-TOF gave near-optimal image quality in each case. It is important to realize that these conclusions apply only to the whole-body oncology studies that are the subject of this work; different conclusions may apply to other types of studies.
A second approach consisted of reviewing a small series of five patients, randomly selected, for which both non-TOF and TOF reconstructions were performed for 1–8 iterations and 14 subsets. For each patient, a lesion less than 2 cm in diameter was identified and a volume of interest (VOI) of diameter between 4 mm and 10 mm was drawn, located within the lesion; the mean counts within the VOI was taken as a measure of the signal (S). The noise was estimated from a VOI drawn in the liver with a diameter greater than 2 cm; the SD (σB) was taken as a measure of the noise. The background (B) was estimated as the mean counts in the liver VOI. The liver was selected for this purpose because it is an organ of large size, moderate uptake, and good uniformity. The signal to noise was then defined by Equation 3 above. In addition, contrast and noise were defined according to Equations 4 and 5, respectively. For each patient, SNR was plotted as a function of iteration number, and contrast as a function of noise for different numbers of iterations. Once the optimal reconstruction parameters had been identified, the basis of this work consisted of a quantitative and a qualitative evaluation of the TOF and non-TOF images in terms of SNR and other image quality features. The TOF information is known to reduce image noise by better localization of the annihilation point for each event. There is, therefore, a gain in SNR (GSNR) due to TOF compared with non-TOF that can be computed as the ratio SNRTOF/SNRnonTOF.
A first quantitative study was performed on 100 patients. For each patient, a lesion (or lesions) was identified of size less than 2 cm in diameter. For each patient, the BMI was calculated and then GSNR plotted as a function of BMI. Since in general a large patient diameter is likely to correspond to a patient of large BMI, the GSNR is expected to increase with BMI. Also, since the gain will be different for different body regions, the lesions were grouped according to their location in head and neck, lungs, and upper and lower abdomen. Linear regression analysis was applied to the data points for each group separately.
A final subjective assessment was performed on a different subset of about 50 patient studies by two physicians, one an experienced nuclear medicine physician and the other a radiologist board-certified in nuclear medicine. The pairs of non-TOF and TOF reconstructions were randomized and the physicians were unaware of the reconstruction method. Each image set was evaluated in terms of a number of independent criteria including uniformity of liver uptake, definition of detail in the mediastinum, spine, kidneys, and lesion; the resolution of small lesions was also assessed. A score from 1 to 5 (1 = worst; 5 = best) was assigned to each of the criteria mentioned above, allowing the quality of the non-TOF and TOF reconstructions to be compared. The results were then compiled as the number of images for which non-TOF was considered superior to TOF, and vice versa. When it was not possible to assess whether one method outperformed the other, the score was randomly assigned to one of the two.
RESULTS
Phantom Study A: Optimizing Reconstruction for Lesion SNR
The SNR for the lesions of size less than 2 cm was studied and the results are shown in Figure 1, where lesion SNR is plotted as a function of iteration number. The maximum SNR was reached earlier for the large spheres, because the larger structures converge quickly while noise continues to increase. The smaller structures take longer to reach a value consistent with convergence. In fact, as mentioned before, the choice of iteration number should ideally be matched to the statistics of the data and diagnostic task, and theoretically each small lesion in each patient has a different optimal number of iterations, although this cannot be implemented clinically. The iteration number that maximized lesion SNR for the smallest (10 mm) sphere was selected as a practical standard for all reconstructions. As can be seen in Figure 1, the maximum SNR for the 10-mm sphere using non-TOF reconstruction occurred at iteration 4. When TOF is used, the maximum occurred at iteration 2.
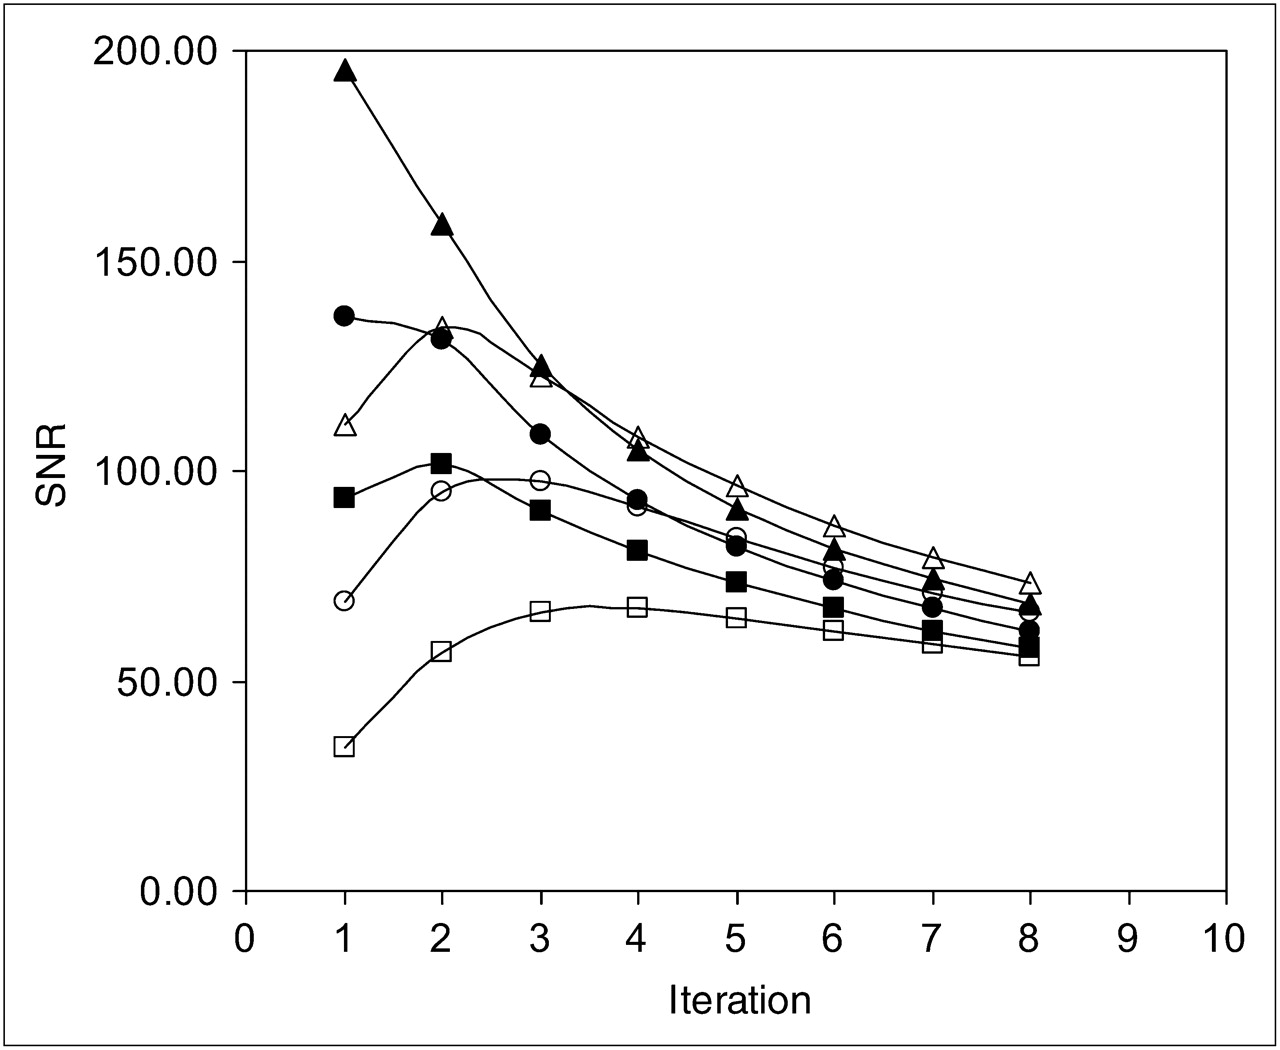
Lesion SNR vs. number of iterations, for TOF (solid symbols) and non-TOF (empty symbols). Results for spheres of 10-mm diameter (squares), 13-mm diameter (circles), and 17-mm diameter (triangles) are plotted.
In Table 1, the noise and contrast are presented as a function of iteration number for the 10-mm, 13-mm, and 17-mm spheres, for non-TOF and TOF reconstruction. It can be observed that for a given iteration number, both contrast and noise level are higher for TOF compared with non-TOF, a consequence of the faster convergence of TOF reconstruction. When the optimal number of iterations for lesion SNR is selected, a similar value for contrast is reached with the two methods. For example, the 10-mm sphere had a measured contrast of 4.35:1 for 4 iterations non-TOF and 4.32:1 for 2 iterations TOF, whereas the noise level was lower in TOF reconstruction: the non-TOF image at iteration 4 shows a background noise of 5.0% while the TOF image at 2 iterations shows a background noise of 3.3%. The cells of the table that are shaded correspond to the optimal iteration number for a given reconstruction method.
Contrast and Background Noise for Each Iteration
Phantom Study B: Evaluating the Ability of TOF Reconstruction to Recover Low Input Contrast
The image quality phantom with a contrast ratio of 2:1 was used to evaluate the small lesion detection capability of the TOF PET scanner under two different conditions: high statistics, low noise, medium spatial resolution; and low statistics, high noise, high spatial resolution.
The former set of conditions corresponds to a 1-h scan duration, reconstructed into an image matrix of 168 × 168 (4-mm pixels); the latter conditions correspond to a 5-min scan duration, reconstructed into a 336 × 336 matrix (2-mm pixel size). In Figure 2, a central section through the hot spheres is shown for the high-statistics scan for the first 5 iterations of both non-TOF and TOF reconstructions. Even though the high-count statistics present in the 1-h scan are not realistic of a typical oncology study, they nevertheless allow a clear assessment of the superior imaging performance of TOF reconstruction in terms of lesion visualization. Of the six hot spheres, the smallest 10-mm sphere cannot be clearly identified against the background noise in any of the five non-TOF images, but it is visible after the first iteration of TOF reconstruction. The 13-mm sphere can be easily localized in all TOF images but becomes clearly visible with non-TOF reconstruction only at higher numbers of iterations.

Reconstructed images of a high statistics (1-h scan) image quality phantom, with 2:1 contrast between the spheres and the background. The first 5 iterations (1 to 5 from left to right) are shown (A) for non-TOF reconstruction and (B) for TOF reconstruction. The shown slices are 168 × 168 pixels with 4-mm pixel size.
The 5-min scan is a more realistic simulation of a typical oncology study. This scan was reconstructed at the best spatial resolution possible, using a 336 × 336 image matrix corresponding to a 2-mm pixel size. A 4-mm pixel size is generally used in PET oncology studies in order to lower the noise level, but at the cost of poorer spatial resolution and contrast. The intrinsic noise reduction in TOF images allows higher spatial resolution to be exploited. The 10-mm sphere is not visible in either TOF or non-TOF images, whereas the 13-mm sphere is visible only in TOF images, and the 17-mm sphere is visible with both reconstruction methods (images not shown).
As expected, shorter scans suggest reduced detectability of small lesions, particularly when the contrast is low. Shorter scans have higher noise levels, and larger pixels degrade spatial resolution. Nevertheless, the TOF reconstruction consistently offered better detection capability than non-TOF: particularly remarkable is the ability of TOF reconstruction to recover, in conditions of high noise, a 13-mm lesion with a low contrast (2:1), which is a challenging situation potentially more relevant for oncology imaging.
Patient Studies: Assessment of the Impact of TOF on Image Quality
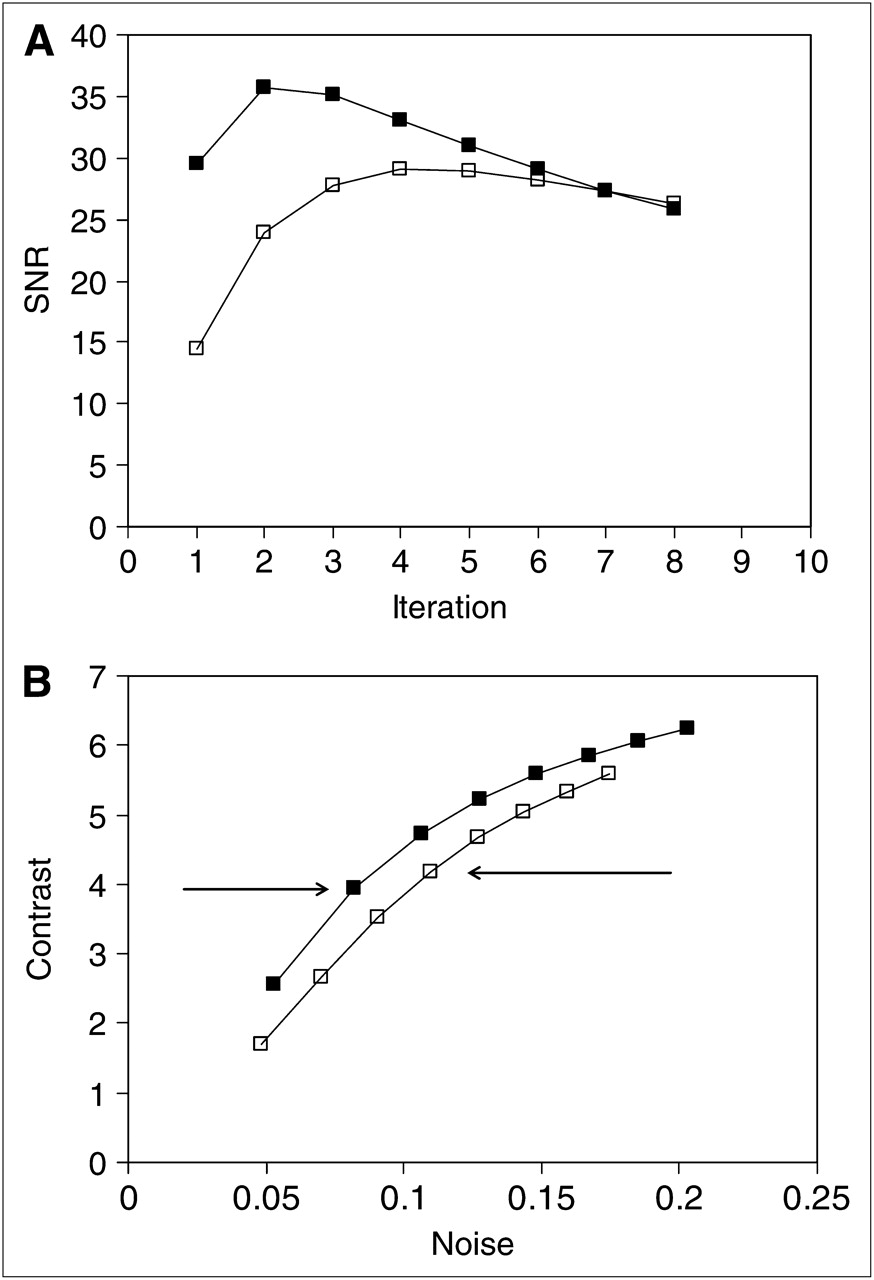
The result of a preliminary visual inspection of TOF and non-TOF patient images by an experienced physicist and a nuclear medicine physician subjectively confirmed that the best image quality, in terms of the trade-off between noise level and contrast, was obtained (in most of the cases) for 4 iterations of non-TOF and 2 iterations of TOF reconstruction. This result was further confirmed by the quantitative study of small lesions in a selected set of 5 patient studies. The plot of SNR as a function of iteration number is shown in Figure 3A for one illustrative patient. The TOF reconstruction reaches a maximum at 2 iterations compared with 4 iterations for the non-TOF. In addition, a greater SNR is achieved with TOF than with non-TOF, reflecting an improved image quality. With the exception of lesions in the head and neck, similar behavior was observed regardless of the location of the lesion within the body. A plot of contrast as a function of noise is shown in Figure 3B for the same lesion as in Figure 3A; the TOF images demonstrate better contrast with a more rapid increase. For TOF, 2 iterations (also with 14 subsets) show the same contrast as 4 iterations, 14 subsets, with non-TOF, but at a lower noise level. This behavior is again typical for most lesions.

SNR and contrast analysis for a patient with a small lesion (<2 cm) in the liver, in a comparison of TOF (solid symbols) and non-TOF (empty symbols) reconstructions: (A) SNR as a function of iteration number, (B) contrast as a function of noise level (each data point corresponds to one iteration). The arrows indicate the selected iteration number for TOF and non-TOF.
While 2 iterations with TOF and 4 iterations with non-TOF seem to optimize SNR for most lesions in the thorax and abdomen, lesions in the head and neck exhibit a different behavior. In general, TOF and non-TOF curves, for both SNR and contrast, are comparable and the improvement due to TOF is somewhat reduced. Also, the maximum SNR seems to be reached at an earlier number of iterations in these cases. Nevertheless, 4 iterations of non-TOF and 2 iterations for TOF reconstructions were also chosen as the default reconstruction parameters for the head and neck region.
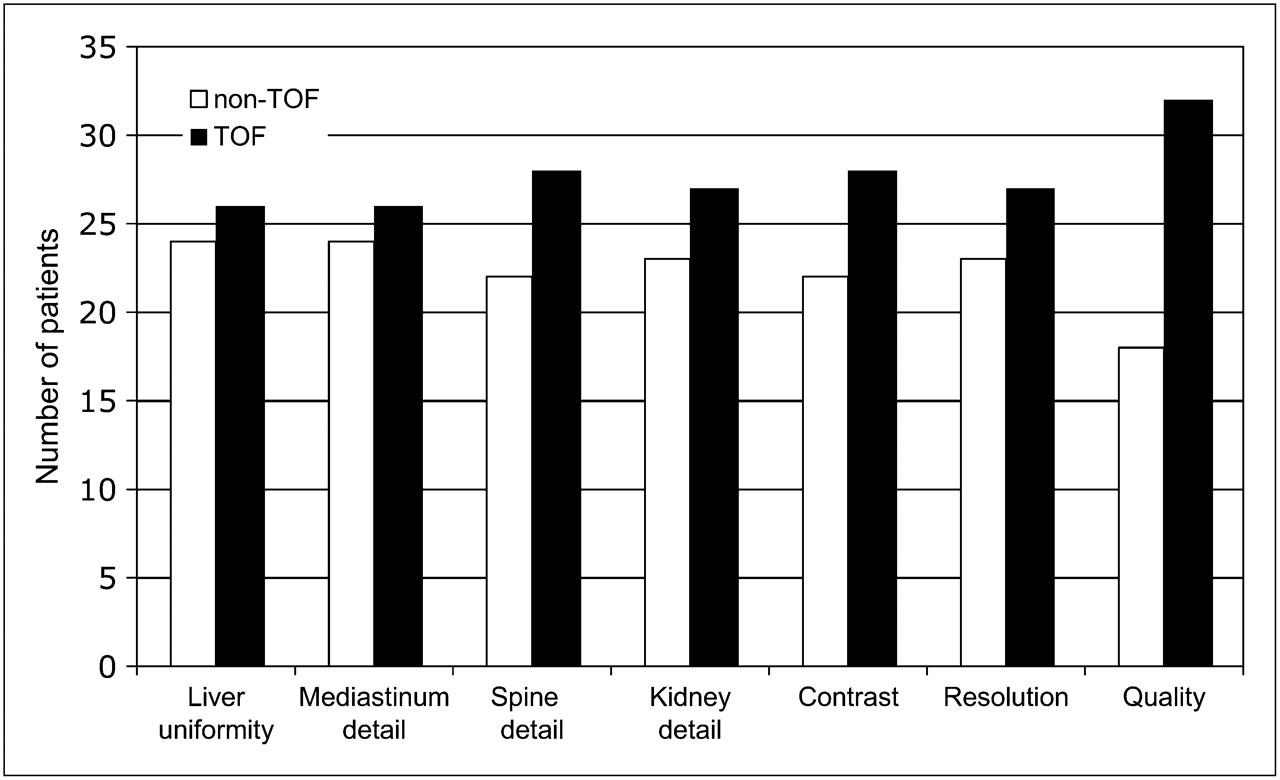
Once the optimal parameters for the reconstruction were established, the selected TOF and non-TOF images were analyzed in terms of TOF SNR gain for small lesions identified in 100 patients. The SNR gain due to TOF was plotted as a function of the BMI for different body regions, as shown in Figures 4A–4C. Each plot includes a linear regression line showing the trend of the data points; the plots in Figure 4 are for lesions in (A) upper and lower abdomen, (B) lungs, and (C) head and neck. Figure 4A shows a total of 144 abdominal lesions with a clear increase in SNR gain as a function of increasing BMI. This is to be expected as the diameters of the patients increase. The gain factor varies from about 1.1 at low BMI values up to 1.8 at high BMI values (BMI = 45). The same plot for 67 lesions in the lungs, Figure 4B, shows no correlation with BMI and an average SNR gain of about 1.4. In the head and neck region, Figure 4C, where little gain is to be expected for the reasons discussed previously, a total of 30 lesions show a slight trend from a gain factor of 1.0 at low BMI up to 1.4 at high BMI values. The slight increase in SNR with BMI for head and neck lesions may be due to the fact that the patients were imaged with arms up: the dimensions of the neck and arms in the FOV increase the effective diameter of the region and can be correlated with BMI. As long as the patient does not move between the CT and PET scans, the attenuation correction and scatter correction can still be accurately estimated. The final assessment of the data required two experienced physicians, unaware of the reconstruction methods, to review a pair of images for each patient study, one of the pair reconstructed without TOF and the other with TOF. The results for this assessment of TOF image quality compared to non-TOF are summarized in Figure 5, which shows that TOF image quality is superior to non-TOF for the liver and mediastinum in 4% of cases, in 12% for details of the spine, and in 8% for details of the kidneys. TOF is superior in image contrast in 12% of cases and for small lesion resolution in 8% of cases.

Measured SNR gain factor vs. BMI, for small lesions (<2 cm) located in different parts of the body for a group of 100 patients: (A) 144 lesions located in the abdomen, (B) 67 lesions located in the lungs, and (C) 30 lesions located in the head and neck.

Evaluation of TOF and non-TOF images according to different criteria: uniformity in the liver, clarity of definition of detail in mediastinum, spine, and kidney, lesion contrast, resolution of small lesions, overall image quality. The bars indicate the number of patients with combined criteria score that is superior for either of the two methods.
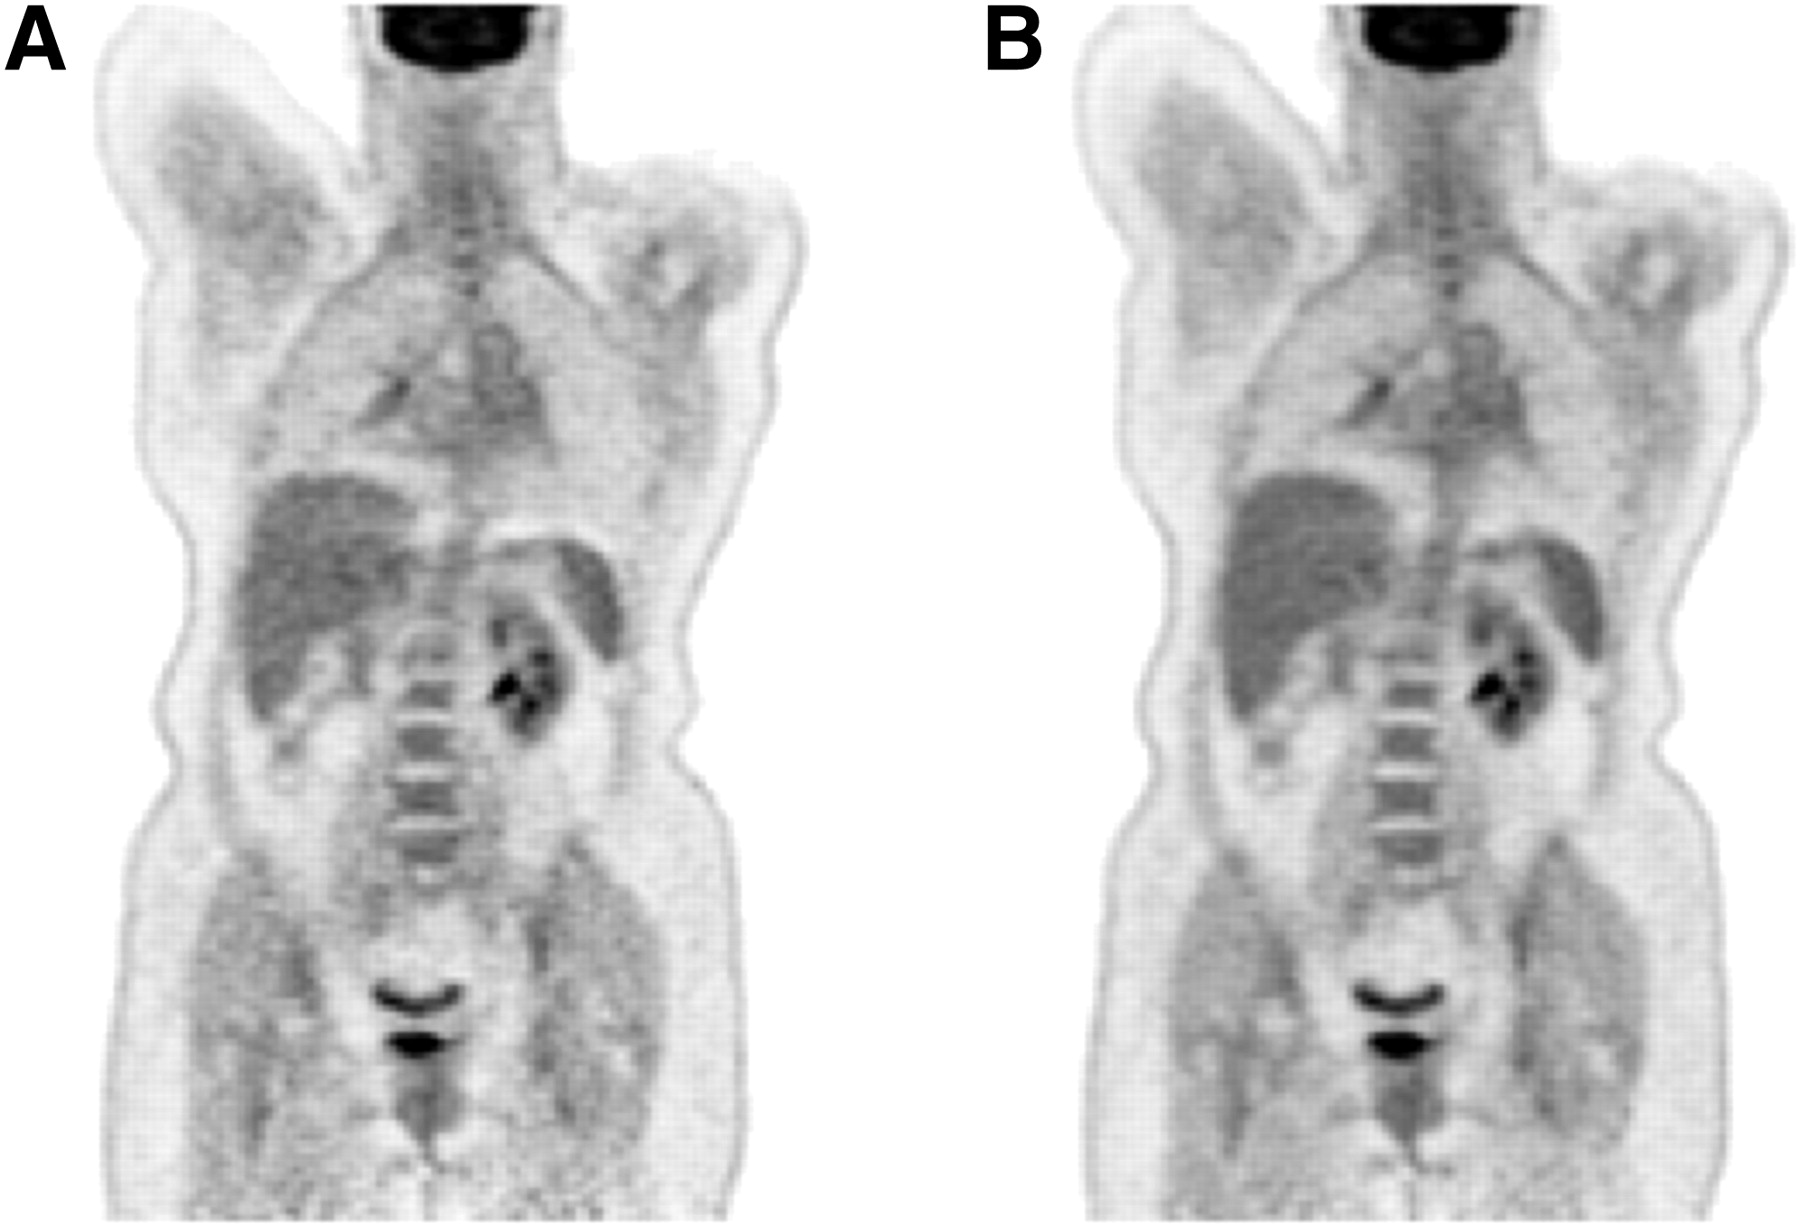
Finally, a few patient cases are presented that illustrate some of the image quality improvements due to incorporating TOF information into the reconstruction. In Figure 6, images of a 79-kg patient (BMI 34.2) with lung cancer were reconstructed without (A) and with (B) TOF information. This study had an average of 41 × 106 prompt counts per bed position and 17 × 106 random counts per bed position, for a total of 5 bed positions. It is evident that Figure 6B demonstrates lower noise and better defined details than the non-TOF image in Figure 6A. This study is typical of the improvement in image quality achieved by lowering the noise through incorporating TOF information. In addition to an overall improvement in image quality with TOF, there is evidence that certain artifacts due to inconsistent projection data can be reduced, using the additional localization capability intrinsic to the TOF information. In particular, the photopenic artifact that can appear above the liver and spleen due to the CT and PET respiration mismatch is less visible on a TOF image, as shown again in Figure 6. The obvious, banana-shaped artifact above the spleen seen in Figure 6A is much less evident in Figure 6B where TOF information has been used: the respiration artifact and resulting incorrect attenuation correction factors have been partially mitigated by the TOF information. This effect has been observed in a number of other patient studies.

A 79-kg patient (BMI 34.2) with lung cancer reconstructed (A) without TOF information and (B) with TOF. Note the almost complete disappearance of the photopenic artifact above the liver and the spleen in B.
As a final illustration of the potential image quality and diagnostic improvements due to TOF, Figure 7 shows two examples of possible liver lesions, in two different slices, which can be seen on the non-TOF images, Figure 7A (upper and lower). Both slices are from the same, 107-kg, patient (BMI 30.2). This study had an average of 22 × 106 prompt counts per bed position and 10 × 106 random counts per bed position, for 5 bed positions total. Both non-TOF images appear to be positive for liver disease. However, in the TOF reconstruction, the lesion in the upper row is visible (Fig. 7B, upper) whereas the lesion in the lower study is no longer visible (Fig. 7B, lower). The accuracy of the TOF reconstruction was verified from the corresponding CT scans (Fig. 7C) confirming that the upper image is a true positive, whereas the lower image is a false positive, probably a noise artifact from the non-TOF reconstruction that becomes a true negative from the TOF reconstruction. Thus, the reduction in noise level due to the TOF information can result in the reduction or elimination of such artifacts and may even affect the diagnostic accuracy of the scan.

The upper row shows a true positive liver lesion (red arrow) that was seen on both the non-TOF (A) and TOF (B) reconstructions in a 107-kg (BMI 30.2) patient. The lesion was subsequently verified as positive from the corresponding CT scan (C). The lower row shows an apparent liver lesion on the non-TOF (A) that is not visible on the TOF reconstruction (B). The corresponding CT scan (C) showed no evidence of a lesion, demonstrating that this was a false positive finding from the non-TOF, which became a true negative with the incorporation of TOF information.
DISCUSSION
This study, performed on a prototype Siemens TOF PET scanner with a 590-ps TOF time resolution kernel, focused on the assessment of image quality obtained with TOF incorporated into the reconstruction, with particular attention to oncology and small lesions (<2 cm). The reconstruction method was 3D OP OSEM with PSF, without and with the incorporation of TOF information.
It is well known that, for iterative algorithms, a trade-off must be found between contrast recovery and the acceptable level of noise. Choosing an iteration number or stopping criterion for an iterative algorithm is arbitrary, since it depends on the acceptable level of noise. We decided to select an iteration number that optimizes the SNR. This is dependent on several factors, including the lesion size and the scan statistics, and in theory each patient and each lesion may need an individual assessment of the appropriate number of iterations. Thus, for the 3D OP OSEM reconstruction algorithm, it was found that the number of iterations required to achieve optimal SNR differed between non-TOF and TOF reconstructions. This is to be expected owing to the better localization of the annihilation events when TOF is included. The appropriate number of iterations that offer a good trade-off between contrast recovery and noise was explored with both phantom and patient data. TOF reconstruction converged faster and resulted in lower image noise. The iteration number which maximized the SNR for small lesions was identified to be 2 for TOF and 4 for non-TOF reconstruction when 14 subsets are used. It is interesting to note that this criterion provided images that demonstrated similar contrast recovery, but the TOF image had the advantage of a lower noise level. As a result of this investigation, patient studies obtained using 2 iterations of TOF and 4 iterations of non-TOF reconstruction were compared.
The gain in SNR due to incorporation of TOF was measured and assessed as a function of the BMI of the patients. As expected, for lesions in the abdomen, where the effect of high BMI is most evident, the SNR gain due to TOF was the most significant. Even at low BMI values, an SNR gain of 1.1 was observed, whereas at a BMI of 40 or above the gain approached a factor of 1.8. This agrees well with the estimated gain given by √(D/Δx) (1) which, for a 40-cm-diameter disk of uniform activity and a TOF resolution of 590 ps, predicts an SNR gain of 2.1. This study confirms that the greatest benefits of TOF will be for the larger patients. For lesions in other parts of the body, the benefit is reduced. In the lung, where low background activity results in good contrast irrespective of the BMI of the patient, the increased gain due to TOF was a factor of 1.4 with no dependence on BMI. For the head and neck the increase was less, around 1.2, with a weak dependence on BMI for the reasons discussed above. These results are consistent with other studies, recently published, which also measured improved SNR and detection capability in TOF images (14,15).
These quantitative findings were confirmed by a careful but subjective assessment of image quality by two experienced nuclear medicine readers. The TOF reconstruction consistently resulted in improved image quality in most of the parameters used for the assessment, particularly resolution of image detail, definition of small lesions, and image uniformity. Finally, some specific illustrative patient studies demonstrated a reduced level of noise and artifacts that could have significant diagnostic implications.
CONCLUSION
This work has demonstrated with both phantom studies and in a clinical setting that the incorporation of TOF information results in more rapid convergence of the reconstruction algorithm, better image contrast, and lower noise. It has been shown quantitatively that the SNR gain due to TOF has the greatest effect in patients with higher BMI. A qualitative assessment by experienced physicians identified improved resolution of image detail, definition of small lesions, and image uniformity in studies incorporating TOF information.
Acknowledgments
The authors acknowledge William C. Howe for developing the reconstruction graphical interface used in this work. The contribution from one of the authors (DJK) is supported in part by award R01 CA107353 from the National Cancer Institute; the content is solely the responsibility of the author and does not necessarily represent the official views of the NCI or NIH.
Footnotes
-
COPYRIGHT © 2010 by the Society of Nuclear Medicine, Inc.
References
- Received for publication July 8, 2008.
- Accepted for publication October 7, 2008.


