


Abstract
Most new PET scanners have the capability to collect data in 3-dimensional (3D) (septa removed) mode. This allows many more detected events at the cost of increased random events and scatter. In the case of 82Rb imaging, the injected dose might have to be limited to avoid saturating the scanner. We present a comparison of 2-dimensional (2D) and 3D data collection for 82Rb cardiac studies using the ECAT EXACT scanner. Methods: Resting 82Rb cardiac studies were collected in 2D and 3D modes for 33 consecutive patients. Four experienced physicians rated the images to determine if the different acquisition methods would lead to different patient care. A separate quantitative analysis was performed on data from multiple scans of a thoracic phantom filled to simulate cardiac and background radioactivity corresponding to 82Rb injections between 37 and 1740 MBq. Results: The 2D and 3D studies were significantly different, with the image quality being poorer in the 3D studies. The scanner collected data at near its maximal counting rate for either 1480-MBq 2D or 37-MBq 3D acquisitions. Because the data collection was counting rate limited in either mode, and there are more random and scatter events in 3D mode, the 2D acquisitions resulted in more detected true events and a better signal-to-noise ratio. Conclusion: Cardiac 82Rb studies should be performed in 2D mode when using the ECAT EXACT scanner.
Myocardial perfusion imaging with 82Rb has been well established for 2-dimensional (2D) PET (1–4). With the advent of newer scanners, the question of whether 82Rb is as effective when imaged with 3-dimensional (3D) PET is an open question. Because many current state-of-the-art scanners are being sold with only 3D capability, this question should be investigated before using the same 2D-based criteria to interpret 3D studies.
An advantage of 3D mode is that collecting many more lines of response permits injecting far less radioactivity, which has the dual benefit of reducing the radiation exposure to the patient and reducing the amount of 82Rb needed. Because the counting rate in 3D mode is several times greater than that in 2D mode for equal radioactivity in the field of view, potentially less than half as much 82Rb could be used. The cost of a 82Rb generator is determined primarily by the amount of 82Sr (parent isotope of 82Rb) that the generator contains, so the cost to obtain a 3D 82Rb scan could be substantially less than that of a 2D scan. This may lead to cheaper and more widespread use of myocardial imaging with 82Rb.
Disadvantages of 3D scanning are the counting rate limit of the scanner, increased random events, and increased scatter. The counting rate in 2D mode after injecting 1480 MBq 82Rb approaches the limit of the ECAT EXACT 921 scanner (CTI/Siemens, Knoxville, TN). In 3D mode the radioactivity must be scaled back so as not to saturate the camera. When the radioactivity is scaled back so that the scanner is counting at near its maximal rate in 3D mode, the number of detected true events may not be much more than that of the higher dose 2D study. Therefore, the potential benefit of collecting more data in a 3D study may be small.
One limitation of scanning in a high counting rate environment is that the random counting rate increases much more rapidly than does the true counting rate as a function of radioactivity in and near the field of view. The random counting rate is the product of the counting rates in each of the 2 responding detectors and the coincidence time window (5). Hence, whereas the true counting rate scales linearly with radioactivity in the field of view, the random rate scales as the square of radioactivity in and near the field of view. The 3D case is worse because removal of the septa allows the detectors to view radioactivity further outside the field of view so more radioactivity contributes to the background rate. Because of this, the counting rate for which the true and random counting rates are equal is generally less in 3D scanning than in 2D scanning. Above this rate, the detected events are dominated by random events.
When the septa are removed, each individual detector is sensitive to radiations from a much larger area. For a given total counting rate, the fraction of random events recorded will be greater when scanning in 3D mode (6). The number of random events can be estimated and subtracted from the dataset. Comparing 3D with 2D scanning at the scanner’s maximal counting rate, the number of detected true events in 3D scanning will be less because the rate of detecting prompt events (true events + random events + scatter) is limited by the maximal counting rate of the scanner, and uncertainty in the estimate of random events will have a greater effect on the noise in the final 3D images. These effects can be quantified by calculating noise equivalent counting rates (NECs) (7). DeGrado et al. (8) have shown that the peak NEC is greater in 2D than in 3D scanning for a uniform phantom scanned with an Advance scanner (a Bi4Ge3O12 [BGO]-based scanner similar to the one we used) (General Electric Medical Systems, Milwaukee, WI). Badawi et al. (9) showed that the peak NEC and relative performance between 2D and 3D scanning on a 951R scanner (CTI/Siemens) are dependent on the geometry of the object being scanned and the amount of radioactivity in the field of view. These works suggest that 2D scanning will be superior in high counting rate scanning, but it is necessary to perform a direct comparison between 2D and 3D scanning for the current scanner and cardiac application with 82Rb.
In 3D mode, the number of scattered events approaches half of all recorded events (6). Because of this, for proper quantitation, a scatter correction must be applied to the 3D data. A large literature relating to 3D scatter correction methods exists (10–12). Some of these methods, particularly the dual-energy window technique, should be applicable to cardiac imaging but none has been specifically tested in the very high counting rate situation of 82Rb cardiac imaging.
The authors of 2 reports have concluded that, under the proper conditions, 3D scanning is advantageous for high counting rate H215O neuroactivation studies (13,14). However, large differences between the size of the object in the field of view and the distribution of background radioactivity make inferring 3D performance for the current cardiac application difficult. This study was initiated to determine if the potential benefit of increasing the number of true counts in 3D mode would offset the detriment of increased random and scattered events. Of primary interest is to determine whether the same clinical information can be obtained from a 3D protocol as from the standard 2D protocol.
MATERIALS AND METHODS
All scans were acquired on an ECAT EXACT scanner (6), which is based on 8 × 8 BGO block detectors and a 12-nS coincidence window. This scanner can collect data in either 2D (septa extended) or 3D (septa removed) mode over an axial field of view of 16.2 cm. For detected events in 2D mode, at least 1 of the annihilation photons is scattered about 15% (50% in 3D mode) of the time. The maximal prompt coincident counting rate in either mode is limited by the data storage system (rather than by the detectors or detector electronics) to approximately 750 kHz. The intrinsic resolution (measured with 18F) is approximately 6 mm at the center of the field of view, although the reconstructed resolution with 82Rb is much less, as described below.
All images were reconstructed with segmented attenuation correction derived from a 7-min measured transmission scan (15). Images were reconstructed with filtered backprojection using a Hahn smoothing filter cutoff at 1 cycle per centimeter. The recommended scatter correction supplied by the scanner manufacturer (CTI/Siemens software, version 7.1b) was used. The final reconstructed resolution was measured by scanning a 82Rb line source (5 cm off center) in a water-scattering medium and found to be 12.3 mm tangentially and 15.3 mm radially.
Thirty-three consecutive patients who were scheduled for resting 82Rb scans at the Nuclear Medicine Department were studied. Our standard 82Rb protocol calls for a preview scan for positioning the patient in the scanner, followed by the resting 82Rb scan, and then a transmission scan. Because the preview scan can be done equally well in either 2D or 3D mode, the preview scan was collected in 3D mode so that it could be compared with the resting scan collected in 2D mode. Between 1300 and 1850 MBq were injected for the resting scan (depending on the age of the Rb generator). Nineteen patients were injected with 740 MBq and 14 patients were injected with 370 MBq for the 3D preview scan. The duration of each scan on each patient was 7 min.
After reconstruction, all images were oriented into short-axis views and then loaded into the Emory Cardiac Toolbox (Emory University, Atlanta, GA). The toolbox was used to create polar maps of the 2D and 3D scans, which were displayed side by side for comparison. The 2D scan was taken as the gold standard. Four physicians who were experienced in reading 82Rb studies reviewed the polar maps. The display included the raw polar map data and a blackout image in which all pixels >2.5 SDs from the mean were blacked out. The blackout was relative to the normal 82Rb database included in the Emory Cardiac Toolbox. The physicians were asked 3 questions: Is there a defect in either or both of the polar maps? Would the findings in your dictation be different between the 2 scans? Would your impression and recommendations for future patient care be different? All physicians viewed the images independently. No attempts were made to reconcile differing opinions.
Phantom studies were performed to simulate the human 82Rb studies. The thoracic phantom (Data Spectrum Corp., Hillsborough, NC) with the cardiac insert and lungs filled with Styrofoam beads (Dow Chemical Co., Midland, MI) was used. Regions of interest were drawn on the 2D images from a healthy subject who was administered 1480 MBq 82Rb to determine typical radioactivity concentrations for filling the phantom. The total system counting rates for true and random events were also noted from the human study. The quantity of radioactivity added to the background was estimated to be that necessary to make the true counting rates match in the human and the phantom experiments. In addition, to account for sources out of the field of view, two 3-L cylinders were filled with radioactive solution and placed on the scanner bed in roughly the location of the head and the bladder. The amount of radioactivity in these containers was intended to produce the same random counting rate in the phantom studies as in the human study.
The beginning of the first experiment was delayed, which caused the measured region-of-interest values to undershoot the desired radioactivity levels as well as the number of recorded true and random events. The experiment was also suboptimal in 2 other areas: The measured radioactivity in the cardiac wall was less than the true radioactivity because of the partial-volume effect (16,17), and the radioactivity concentration was reduced more than expected because of the Styrofoam beads in the lungs. Because of these limitations, a second experiment was performed with the radioactivity in the phantom chambers adjusted accordingly. The number of detected true events was adjusted by adding additional radioactivity to the background of the phantom. Moving the head and body cylinders closer to the phantom increased the number of detected random events. The radioactivity concentrations and other parameters for the 2 experiments are detailed in Table 1.
Parameters for 2 Phantom Experiments
The phantom and cylinders were filled with 18F, and the scan duration was set to 106 s. This duration was chosen because the number of counts expected from the decay of 18F in 106 s is equal to the number of counts expected from the decay of 82Rb over the 7-min imaging period used in the human studies. Scans (without moving the phantom or background radioactivity) were acquired every 90 min to simulate injected 82Rb doses between 1740 and 37 MBq.
After reconstruction, the images were analyzed quantitatively by evenly spacing 100 points over the defect-free portion of the myocardial wall. Each point was approximately 1 cm from its nearest neighbor. Because the true radioactivity concentration at these points was equal, the mean divided by the SD of the measured values is the signal-to-noise ratio (SNR) in the images. This measure takes into account all sources of noise.
RESULTS
No adverse effects were observed in any patient. As expected, the fraction of random events was much higher in the 3D studies. No significant difference was found between the 3D fraction of random events at injected doses of 370 and 740 MBq. In 2D studies, the average true-to-random ratio was 1.6 with an average of 8.4 million true events detected. In 3D studies, at 370 MBq injected, the average true-to-random ratio was 0.54 with 11.6 million true events detected.
The physicians’ evaluations are summarized in Table 2. On average, their impressions differed between the 2D and 3D studies in 53% of the cases. The most noticeable difference between the 3D and 2D studies was decreased uptake in the apex area on the 3D scans. Defects generally appeared much larger on the 3D scans. No significant difference in physicians’ attitudes was found between injecting 370 or 740 MBq when scanning in the 3D mode. The physicians recommended, on average, different follow-up care for 10 of the 33 patients. For 8 patients, a consensus of the physicians (3 or 4 in agreement) believed that subsequent treatment would be different. Three of the 4 physicians did not believe that the 3D studies could be used as a replacement for the 2D studies without further investigations. Transaxial images of representative cases are shown in Figure 1, and the corresponding polar maps are shown in Figure 2.
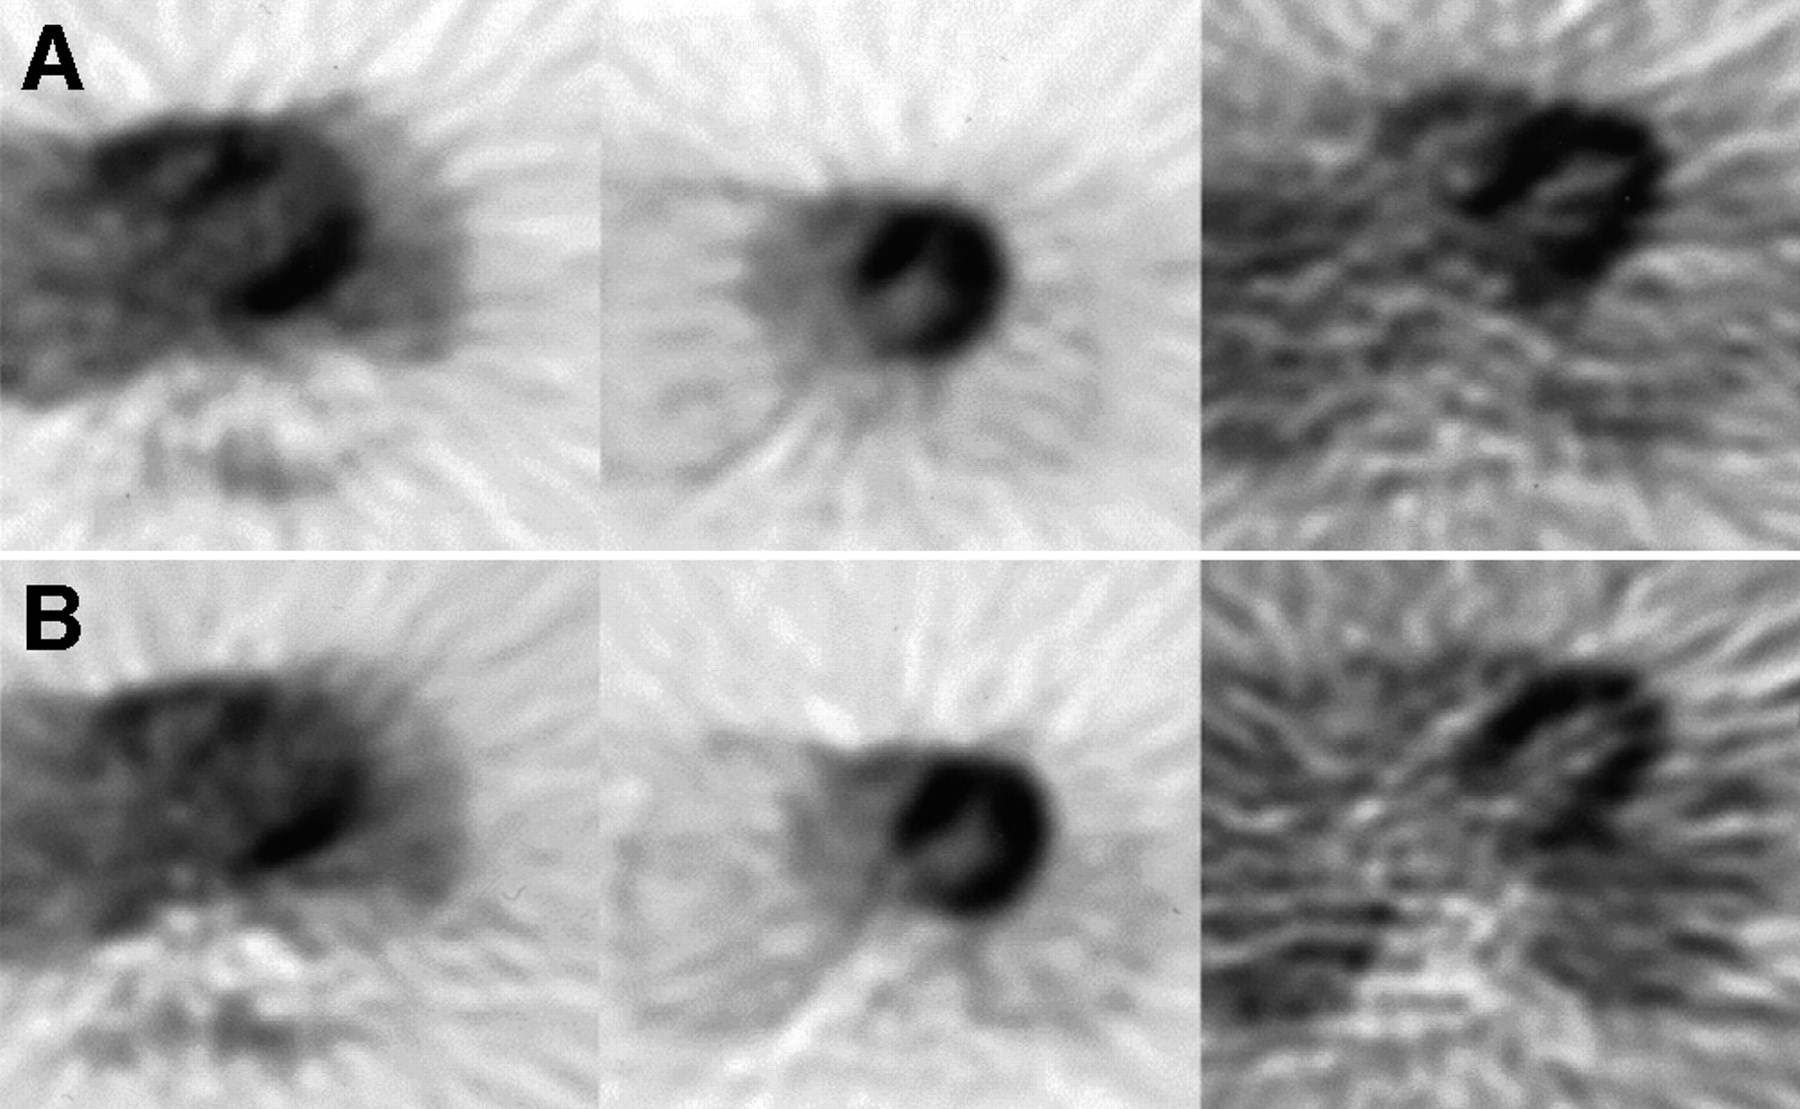
Two-dimensional (A) and 3D (B) images of 3 subjects show range of results. Left pair represents better-than-average agreement between 2D and 3D scans of 73-kg male with major defect. Note, however, that septal wall is decreased and apex is noisier in 3D study. Middle pair is from 60-kg female and represents best agreement between 2D and 3D scans. Right pair is from 125-kg male. Both images are noisy but apex is decreased in 3D study.
Physicians’ Comparison of 3D and 2D 82Rb Scanning
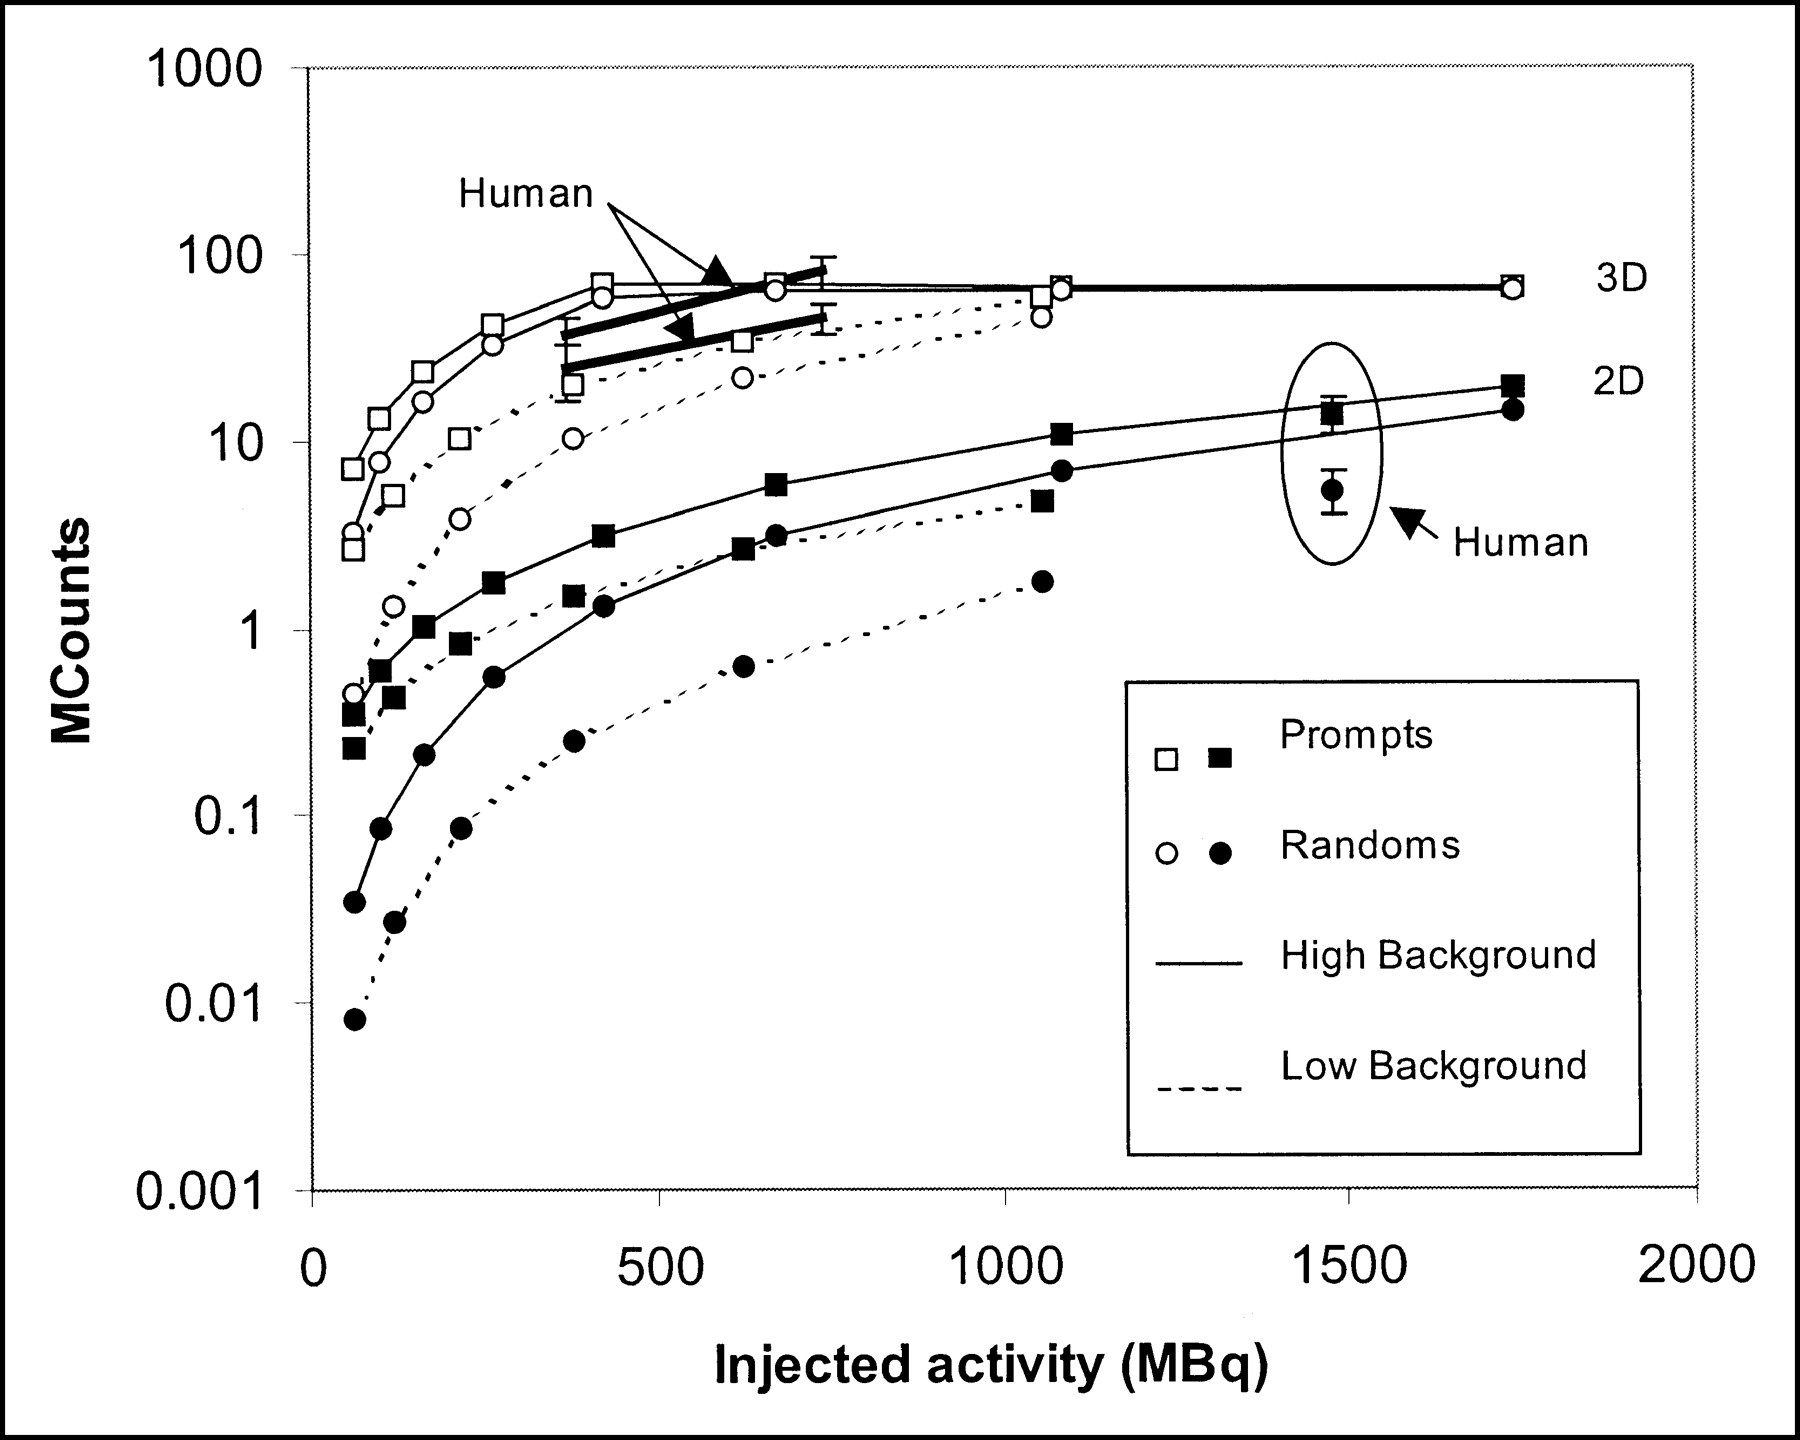
Counting rates for the phantom and the human experiments are shown in Figure 3. The human data represent average results for the humans studied. The 2 phantom experiments bracket the counting rate observed in the human studies. Injecting 560 MBq saturates the scanner when collecting data in the 3D mode. The 2D counting rates are still increasing at the highest tested injection (1740 MBq).

Number of prompt events (true events + random events + scatter) and random events recorded during phantom and human studies. All data are from phantom experiments except 6 separately indicated data points with error bars, which represent mean ± SD of prompt and random events from human studies. Solid lines indicate results from high-background phantom experiments, and dashed lines indicate results from low-background phantom experiments. Top group of curves is from data collection in 3D mode, and bottom group of curves is from data collection in 2D mode.
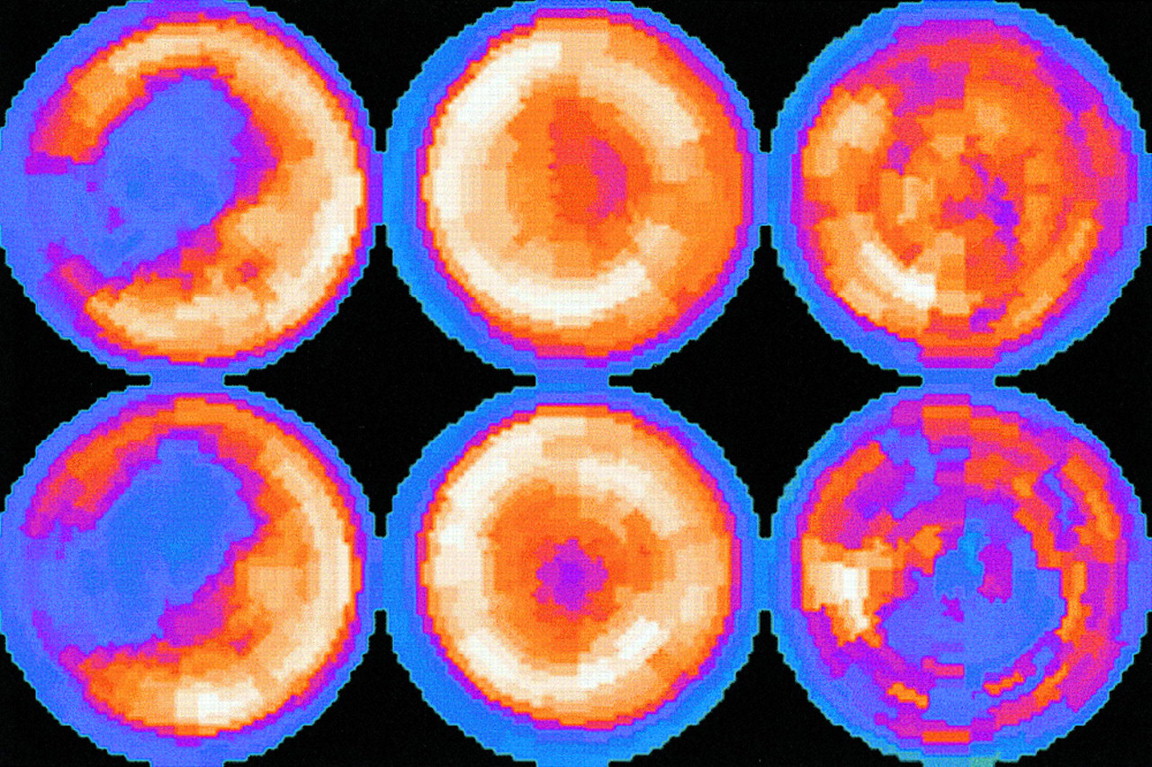
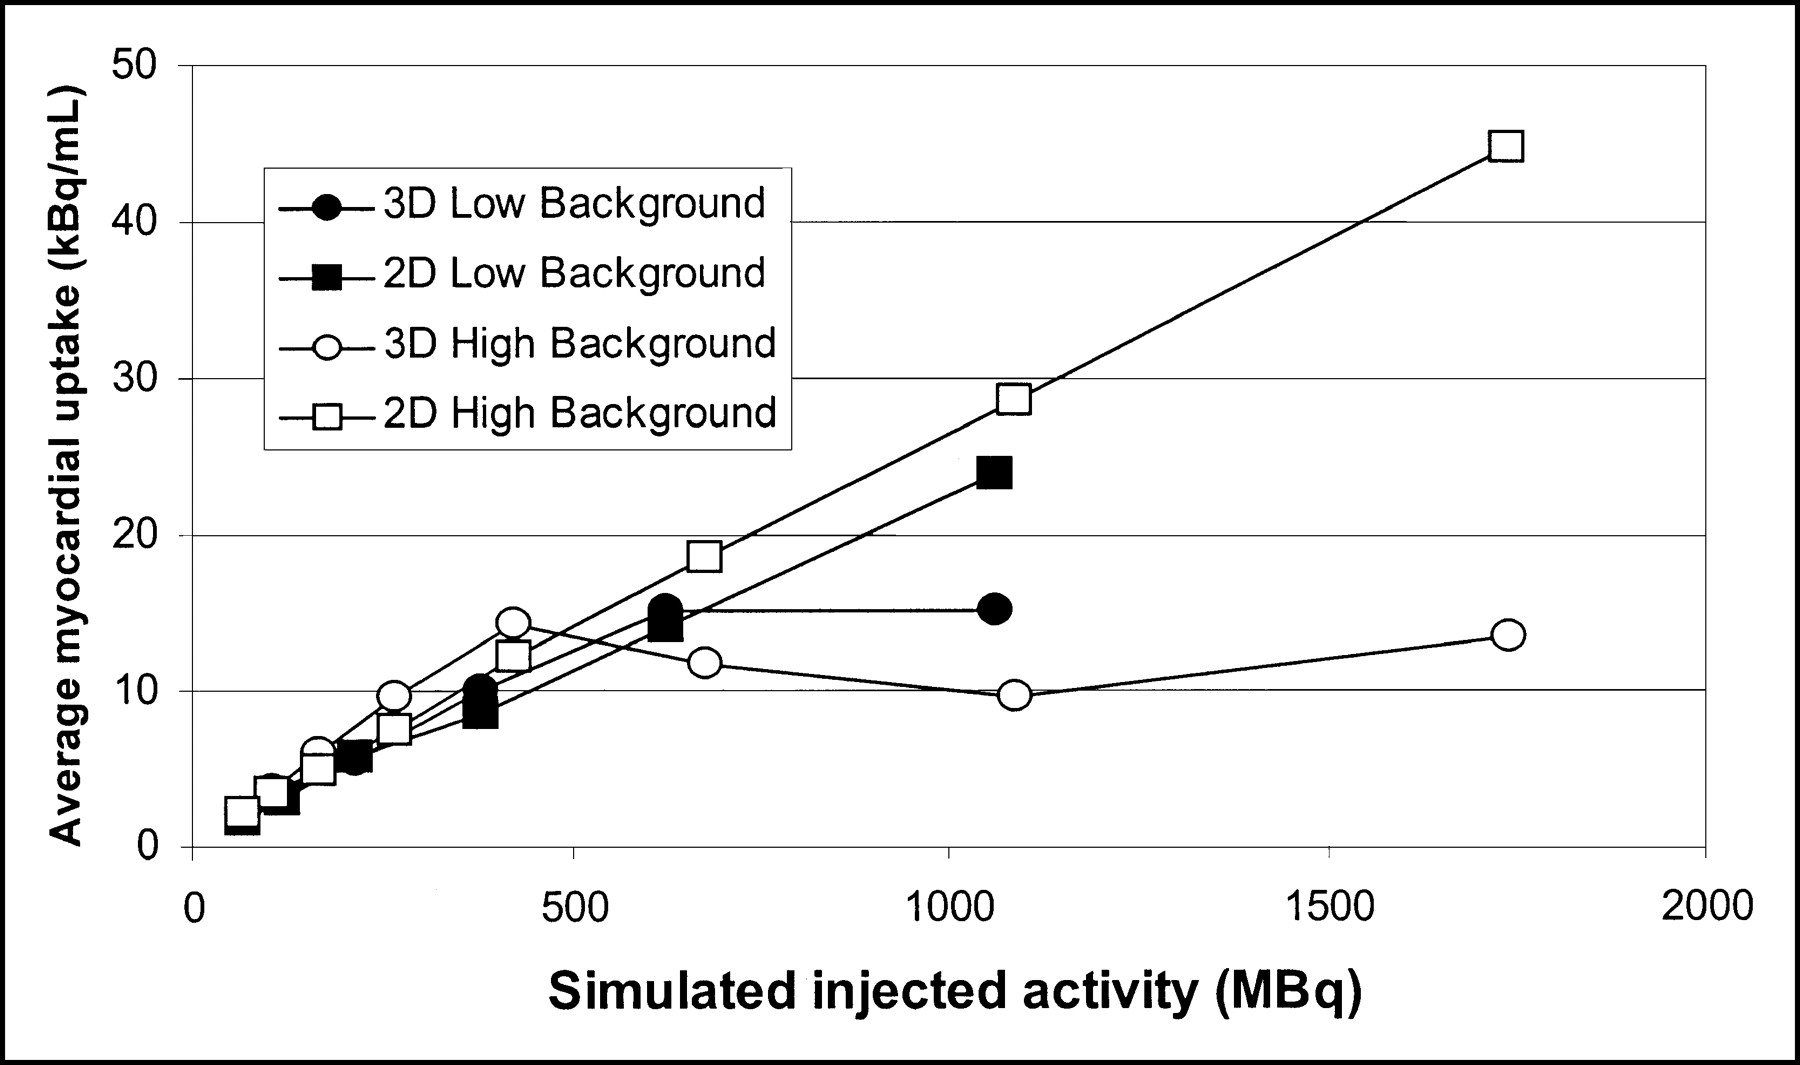
Phantom images are shown in Figure 4. Visual inspection of the images indicates that the 3D images are worse than the 2D images at higher injected activities and are about equal at 260 MBq; at lower activities, 3D studies are better than 2D studies. However, the best 3D study is inferior to the best 2D study. The average myocardial uptake in the phantom studies is shown in Figure 5. Note that the 3D values saturate at a simulated injected dose of 370 MBq. The SD is much larger for the 3D studies, in agreement with the visual impression of the images. SNR values (average/SD) are plotted in Figure 6. In both the high- and the low-background experiments, the highest SNR is achieved with 2D scanning.

Images from same phantom experiments as those depicted in Figure 3. Top 2 rows are from low-background experiment, and bottom 2 rows are from high-background experiment. Within each experiment, first row is 2D study and second row is 3D study. Numbers represent simulated amount of 82Rb injected (in MBq).

Myocardial uptake values from phantom experiments. Differences between low- and high-background curves at low injected radioactivity are attributed to slight differences in preparing phantom for 2 experiments. Quantitative accuracy breaks down in 3D scans because of excessive radioactivity in field of view (approximately 370 MBq 82Rb injected).
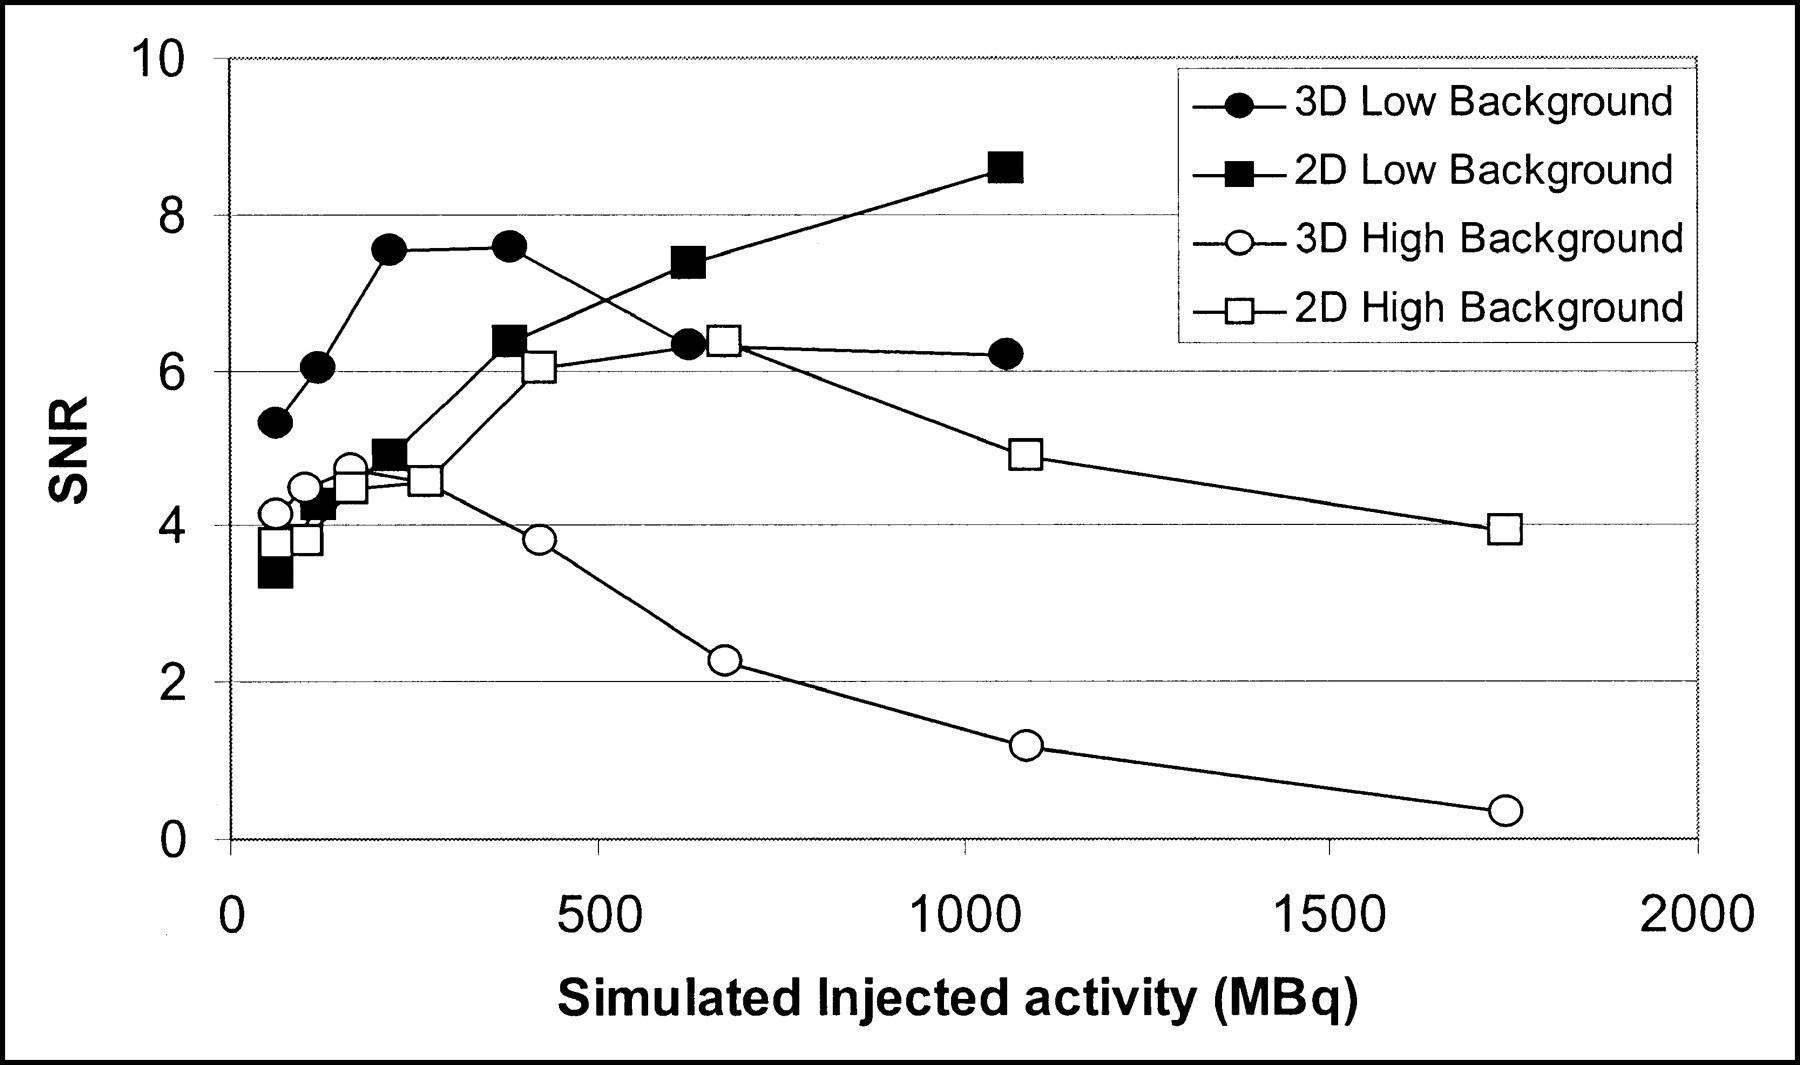
SNR observed during 2 phantom experiments. Random counting rate was slightly higher in high-background experiment and slightly lower in low-background experiment than that seen in human experiments.
DISCUSSION
A study has been performed to compare 2D and 3D data collection in 82Rb cardiac studies. The impressions of the physicians and the physicist involved in reviewing the studies along with the quantitative assessment indicate that the results from the 3D studies are inferior to those of the 2D studies. The cause of the disparity in image quality is the much higher fraction of random events in the 3D study. The counting rate during 1480-MBq 2D or 370-MBq 3D scanning is similar and is near the saturation limit of the scanner. But the fraction of random events is much greater for the 3D study. After correction for random events, the 3D study contains much more noise. This is evident from Figure 4, in which the best 3D scan is not as good as the best 2D scan, and from Figure 6, in which the highest SNR is achieved with 2D scanning.
Because the scanner is near the saturation limit, injecting a greater amount of 82Rb would be detrimental to image quality, and the potential advantage of switching to 3D scanning to collect additional counts is not supported. The situation would be improved if the random counting rate were decreased. The coincidence window is 12 nS for the scanner used in this study. If this window could be reduced to 6 nS, the number of recorded random events would be cut in half and the number of prompt events would be reduced as well. This would improve images from both scanning modes, but the improvement would be greater for the 3D acquisitions because cutting the random events in half would reduce the 3D total counting rate by 40% and the 2D rate by 28%. It is not clear which acquisition method would be preferable in this case.
In addition to greater noise in the 3D studies, half of the images were read as being significantly different. The primary difference was a new defect, or a larger defect, at the apex on the 3D scans. The image quality at the edge of the thorax is particularly bad in the 3D studies, as is seen in Figure 1. The reason for this is not known but a possibility is the scatter correction. The scatter correction algorithm relies on the estimated emission and attenuation images. If these images have artifacts, then the scatter correction may be erroneous and lead to strong lateral streak artifacts (18). The situation may be improved by iterating the reconstruction but this was not tried. In any case, the unacceptable noise level on the 3D images renders investigation of 3D scatter correction moot for this project.
CONCLUSION
Three-dimensional 82Rb scanning will not produce a study of equal or better quality than the current 2D technique using the ECAT EXACT scanner. The studies are counting rate limited in either 2D or 3D mode. Because the total counting rate is the same for 2D and 3D modes but the fraction of random events is greater in 3D mode, 2D scanning results in superior images. This situation might be different in newer generation scanners. Lu2SiO5(Ce) (LSO) crystals have the potential for better coincidence time resolution and for detecting events at much higher rates than BGO crystals (19). The better coincidence time resolution could reduce the random counting rate by a factor of 2. The higher total counting rate could change the scanner from being the limiting factor for injected dose. The maximal counting rate would need to be high enough so that the limit to the injected dose is 82Rb availability or radiation dose to the patient. If such were the case and a scanner with a much higher counting rate is realized, this study should be repeated to determine whether 2D or 3D acquisitions are preferred for use in cardiac imaging with 82Rb.
This study supports a general rule of thumb for PET scanning. If there are sufficient counts to perform a study in 2D mode, then that study should be performed in 2D mode. Three-dimensional scanning is advantageous when the counting rate is much lower and the benefit from additional events far outweighs any loss attributed to increasing the fraction of random and scatter events. This may be (and often is) the case when the amount of injected radioactivity is limited for nonscanner-related reasons (e.g., radiation safety concerns). However, this is not the case with 82Rb and the ECAT EXACT scanner. We recommend that 82Rb scanning continue to be performed in 2D mode until improvements in the scanner allow greater counting rate or a method is developed to shield radioactivity outside the field of view (or both).
Acknowledgments
The authors appreciate the input and opinions of Drs. Ernest Garcia, Raghu Halkar, John Vansant, Andrew Taylor, and Rod Pettigrew. This work was supported in part by Bracco Diagnostics.
Footnotes
Received Oct. 23, 2000; revision accepted Mar. 16, 2001.
For correspondence or reprints contact: John R. Votaw, PhD, Department of Radiology, Emory University School of Medicine, 1364 Clifton Rd., N.E., Atlanta, GA 30322.


