


Abstract
This study evaluates the 2-dimensional (2D) and 3-dimensional (3D) performance characteristics of a newly developed PET/CT scanner using the National Electrical Manufacturers Association (NEMA) NU 2-1994 (NU94) and NEMA NU 2-2001 (NU01) standards. The PET detector array consists of 10,080 individual bismuth germanate crystals arranged in 24 rings of 420 crystals each. The size of each crystal is 6.3 × 6.3 × 30 mm in the axial, transaxial, and radial dimensions, respectively. The PET detector ring diameter is 88.6 cm with axial and transaxial fields of view (FOVs) of 15.7 and 70 cm, respectively. The scanner has a uniform patient port of 70 cm throughout the PET and CT FOV, and the PET scanner is equipped with retractable septa to allow 2D and 3D imaging. Methods: Spatial resolution, scatter fraction, sensitivity, counting rate, image quality, and accuracy as defined by the NEMA protocols of NU94 and NU01 for 2D and 3D modes are evaluated. The 2D mode data were acquired with a maximum ring difference of 5, whereas the 3D mode acquisition used ring differences of 23. Both 2D and 3D mode data were acquired with an energy window of 375–650 keV. Randoms estimation from singles counting rate was applied to all relevant analysis. In addition, images from 2 clinical whole-body oncology studies acquired in 2D and 3D modes are shown to demonstrate the image quality obtained from this scanner. Results: The 2D NU94 transaxial resolution is 6.1-mm full width at half maximum (FWHM) 1 cm off center and increases to 6.9 mm tangential and 8.1 mm radial at a radius (R) of 20 cm. NU01 2D average transaxial (axial) FWHM resolution measured 6.1 (5.2) mm at R = 1 cm and 6.7 (6.1) mm at R = 10 cm. The NU94 scatter fraction for 2D (3D) was 13% (29%), whereas the NU01 scatter fraction gave 19% (45%). NU01 peak 2D (3D) noise equivalent counting rate (T2/[T + R + S]) was 90.2 (67.8) kilocount per second (kcps) at 52.5 (12) kBq/mL. Total 2D (3D) system sensitivity for true events is 8 (32.9) kcps/kBq/mL for NU94 and 1.95 (9.2) kcps/Bq for NU01. Conclusion: The results show excellent system sensitivity with relatively uniform resolution throughout the FOV, making this scanner highly suitable for whole-body studies.
- performance characterization
- PET/CT
- National Electrical Manufacturers Association standards
- 2-dimensional mode
- 3-dimensional mode
In the short span since the introduction of the first PET/CT scanner, dual-modality imaging is quickly influencing patient management. PET images from a PET/CT scanner are becoming the benchmark for the best interpretation of CT, while CT images are adding the anatomic detail that a dedicated PET scanner has always lacked. Several combined PET/CT scanners are now available on the market. Most currently available PET/CT systems have been designed by integrating off the shelf dedicated PET and CT scanners into one dual-modality tomograph. The majority of the design integration has been focused on image visualization, data transfer between subsystems, and patient couch, with little attention given to the scanner (PET or CT) design optimization. The General Electric Discovery ST PET/CT scanner is unique in that the PET component has been newly designed as an integrated PET/CT scanner. One of the main design features of this scanner is its ability to scan in both 2-dimensional (2D) and 3-dimensional (3D) modes.
In this article, the performance characteristics of the PET component of the Discovery ST PET/CT scanner are investigated. The investigation was conducted according to the National Electrical Manufacturers Association (NEMA) NU 2-1994 and NU 2-2001 standards in 2D and 3D modes (1,2). In addition, 2D and 3D images from 2 patient studies of different body habitus are shown to demonstrate the image quality obtained from this scanner. The NU 2-2001 standard supersedes the 1994 standard and takes into consideration the PET scanner performance in 2D as well as 3D modes, with emphasis on being more representative of whole-body clinical studies. From here onward, the NEMA NU 2-2001 and NU 2-1994 standards are referred to in this article as NU01 and NU94, respectively.
MATERIALS AND METHODS
System Description
The Discovery ST PET/CT scanner is a full ring bismuth germanate (BGO) system. Mechanical design integration provides a wide 70-cm bore, short tunnel length, and compact scanner design. The system is comprised of block-based detectors (6 × 6 array) of BGO crystals measuring 6.3 × 6.3 × 30 mm in the tangential, axial, and radial directions, respectively. Each crystal block is coupled to a 4-channel square photomultiplier tube. The average crystal energy resolution of the block is 17%. The full detector array comprises 4 rings of 70 blocks, resulting in an 88.6-cm ring diameter and a 157-mm axial field of view (FOV). Light shielding for the individual block elements has been designed to minimize gaps between blocks. This, combined with a very low intercrystal separation (no saw cuts or thick reflector materials), results in an improved packing fraction of 92%. The scanner has tungsten retractable septa, 54 mm in length and 0.8 mm thick, to provide both 2D and 3D acquisition functionality. The 2D mode is operated with an axial acceptance of ±5 crystal rings, whereas the 3D mode accepts axial combinations between any of the 24 rings. The 2D and 3D modes are both operated with an energy window of 375–650 keV and an 11.7-ns coincidence time window. Traditional PET transmission scans are not supported; however, an auto-loading rotating 68Ge (50 MBq) rod source is included for system calibration and quality control. Measured attenuation correction is based entirely on CT with no restriction on the CT kilovolt setting to transform CT numbers to PET attenuation factors. Image reconstruction in 2D mode can be formed with either filtered backprojection (FBP) or ordered-subset expectation maximization (OSEM) (3), whereas the 3D image reconstruction supports both 3D reprojection (4) and Fourier rebinning (FORE) (5) followed by either FBP or a weighted least-squares OSEM iterative reconstruction (WLS) (6–8). Both 2D and 3D iterative reconstructions include attenuation compensation within the model to more accurately preserve the statistical nature of the input data. Scatter correction is calculated with the Bergstrom convolution in 2D (9) and an analytic model-based technique in 3D (10–12). Randoms correction can be conducted with delayed-event coincidence measurements or from an estimate of randoms generated from the crystal singles rate (13).
Performance Measurements
A subset of NEMA NU94 (1) and NU01 (2) tests was conducted. The tests that were performed for the NU94 standard were transverse resolution, scatter fraction (SF), sensitivity, and counting rate performance; those for the NU01 standard are resolution, sensitivity, image quality, SF, and counting rate performance. This subset of the standards was chosen since it reflects the parameters primarily used to represent a PET scanner’s performance.
The spatial resolution tests measure the spatial response function within the final image. The SF tests measure the fraction of annihilations that have been detected with false information regarding the radiation source localization due to a scattering medium. The sensitivity tests measure the detected coincidence event rate in the presence of low radioactivity levels where counting rate losses are negligible. The counting rate performance tests measure the ability of the scanner to detect true and random events under varying activity concentrations. Finally, the NU01 image quality test is an attempt to measure the scanner’s image contrast and signal-to-noise ratios under conditions that simulate a clinical whole-body study. For all performance tests, the scanner coincidence window setting, lower γ-energy discriminator, and upper energy discriminator were 11.7 ns, 375 keV, and 650 keV, respectively. 18F in an aqueous soluble form of either 18F ion or 18F-FDG was used in all performance measurement tests.
A typical patient scan on the Discovery ST scanner begins with a scout scan that is used for defining the tomographic scan range. Helical CT is then performed. As the CT images become available, they are automatically processed for use as PET attenuation correction data. CT attenuation correction is performed by first converting the CT Hounsfield units to 511-keV attenuation coefficients with a trilinear lookup table. The CT attenuation image is then blurred to match the PET system’s resolution characteristics and is then forward projected into sinogram space for application during the reconstruction process. Upon completion of the helical scan the PET acquisition can be initiated. As each FOV of the PET scan is completed, the reconstruction will automatically proceed with user-defined prescriptions. Therefore, the full PET image volume is available for review shortly after the scan completes. Automatic networking of PET and CT data is supported to remote review workstations and picture archiving and communication systems.
NEMA NU94 Measurements
Transverse Resolution.
The transverse resolution was measured with a stainless steel line source (1.2-mm inner diameter [ID], 1.65-mm outer diameter) filled with 17.2 MBq of 18F. The line source was suspended in air, parallel to the long axis of the scanner, and imaged at 5 different locations (1, 5, 10, 15, and 20 cm) from the center of the FOV along the vertical axis (y-direction). Data were acquired for 1 min in 2D and 3D modes in each position and reconstructed into a 256 × 256 matrix using a ramp filter with a cutoff of 6.3 mm (where the filter length expresses the spatial period of the frequency cutoff). The reconstruction FOV was centered at the line source location and set to 6.4-cm diameter in all cases. Spatial resolution was then determined by measuring the tangential and radial full width at half maximum (FWHM) of the line profiles drawn through the center of the point images at different locations.
SF.
The SF was determined by imaging a radioactive line source in a water-filled cylindric phantom (20-cm ID, 19-cm length). The line source was the same as that used for the transverse resolution but filled with only 11.1 MBq of 18F to minimize dead time and random events. The phantom with the line source was positioned centrally in the FOV of the scanner and data were acquired in 2D and 3D modes for 15 and 5 min per acquisition, respectively. The acquisition was repeated with the line source positioned at 0, 4, and 8 cm from the center of the phantom to determine the average scatter over the object. Sinograms were then reconstructed with only dead time, randoms, and geometric corrections applied. For the 3D acquisition, the data were formatted using the single-slice rebinning (SSRB) technique before further processing. For both 2D and 3D data, the sinogram profiles were then used to calculate the number of scatter events within a radius of 12 cm from the center of the cylindric phantom. For that purpose, the scattered events under the peak were estimated for each of the 3 source positions using linear interpolation between the ±2-cm points from the source center. From these data, the average SF over the whole area of the phantom was calculated by weighting the data for each position of the line source by the area of the annulus at that radius (1). A plot showing the SF per slice across the axial FOV was then generated. The system’s SF was calculated as the average SF of all slices.
Sensitivity.
Scanner sensitivity was determined by imaging the water-filled cylindric phantom after injecting it with an activity concentration of only 2.5 kBq/mL (14.8 MBq total) to minimize dead time and random events. The phantom was positioned centrally in the FOV of the scanner and data were acquired in 2D and 3D modes for a duration of 15 min each. Sinograms were reconstructed without any corrections except for dead time and randoms. The 3D data were first processed using the SSRB technique before its reconstruction into sinograms. Sensitivity was measured by determining the trues counting rate within a radius of 12 cm from the center of the phantom divided by the average injected activity concentration. The trues counting rate was determined by multiplying the total counting rate in the 24-cm region by (1 − SF). The SF was determined in the previous test. A plot showing the sensitivity of the scanner across the axial FOV was then generated. The total system sensitivity was obtained by summing all slice sensitivities.
Counting Rate Performance.
The counting rate performance of the PET scanner was evaluated by injecting 2.55 GBq of 18F in the water-filled cylindric phantom and imaging it repeatedly over a period of 12 h. Data acquisition was alternated between 2D and 3D modes and recorded with and without delayed-events acquisition. Each data acquisition frame was set to 15 min with no delay between consecutive acquisitions, giving a total of twenty-four 2D and twenty-four 3D frames. The raw data were then reconstructed into sinograms with no corrections applied. The 3D data were preprocessed using SSRB before reconstructing them into sinograms. The system’s percentage dead time, trues rate, and randoms rate as a function of activity concentration were then calculated according to the NU94 standard and the results were plotted. Randoms sinograms were generated from the detector singles rate for frames acquired without delayed event. The SF value used for these calculations was obtained from the previous section on SF.
NEMA NU01 Measurements
Spatial Resolution.
Spatial resolution was determined by imaging point sources at different locations in the FOV of the scanner. The point sources were made by pipetting a 1-μL drop of 18F having a concentration of 74 MBq/mL onto a slide. The radioactive drop was then pulled into a hematocrit capillary tube by capillary action to form a point source of activity. Three such sources were made and placed at x = 0 cm, y = 1 cm; x = 0 cm, y = 10 cm; and x = 10 cm, y = 0 cm in the center of the axial FOV of the scanner. Data were then acquired in 2D and 3D modes with each acquisition set for 60 s. For the 2D data, the images were reconstructed using the FBP algorithm into a 256 × 256 matrix with a ramp filter and a 6.3-mm cutoff. The reconstruction FOV was set to 25 cm and centered at x = 5 cm, y = −5 cm. The 3D data were processed in a similar manner but with FORE followed by FBP. The spatial resolution was then determined by measuring the FWHM and full width at tenth maximum of the point spread functions in all 3 directions through the peak of the activity distribution in the 3 orthogonal directions. This experiment was repeated by placing the 3 point sources at a distance of one-fourth the axial extent of the FOV (4 cm from the edge of the FOV). Spatial resolution (FWHM) along the 3 orthogonal directions was reported as the average of values obtained from these 2 axial locations.
Sensitivity.
A 70-cm plastic tube was filled with a total of 9.25 MBq of 18F and placed inside an aluminum sleeve (3.9-mm ID, 70 cm long). The tube and sleeve were then suspended in the center of the FOV and oriented parallel to the long axis of the scanner. A small amount of radioactivity was used to minimize counting losses. Data were then acquired in 2D and 3D modes. The source and sleeve were then placed at 10 cm off the central axis and the acquisition was repeated. At the end of the acquisition, a second aluminum sleeve was added to the initial setup and the scanning was repeated at 0 and 10 cm off axis. This process was repeated for a total of 5 aluminum sleeves (ID: 3.9, 7.0, 10.2, 13.4, and 16.6 mm) imaged at both locations and in both modes (2D and 3D). Each data acquisition was set for a duration of 1 min. The total system sensitivity at each radial position was then calculated by dividing the total counting rate in the absence of any attenuating material by the injected activity. The total counting rate was determined by fitting the measured counting rates, after correction for activity decay, as a function of sleeve thickness as defined in the NU01 standard. Plots showing the slice sensitivity across the axial FOV as well as the fit to determine the total counting rate at both radial locations were generated.
SF and Counting Rate Performance.
The performance evaluation of both of these tests was conducted using a 70-cm plastic tubing (ID, 3.1 mm; 5.2-mL volume) filled with 2.59 GBq of 18F. The tubing was inserted into a hole threaded parallel to the long axis of a 70-cm-long by 20-cm-diameter solid polyethylene cylinder. The hole is located at a radius of 4.5 cm off the central axis of the phantom. The phantom was then positioned centrally across the FOV of the scanner with the line source at the lowest position (i.e., nearest to the patient bed). The phantom was then imaged repeatedly over a period of 12 h. Data acquisition was alternated between 2D and 3D modes and recorded without delayed-event randoms data. Each data acquisition frame was set to 15 min with no delay between consecutive acquisitions, giving a total of twenty-four 2D and twenty-four 3D frames. The raw data were then reconstructed into sinograms with no corrections applied. The 3D data were preprocessed using SSRB before its reconstruction into sinograms. The SF was then measured according to the NEMA NU01 standard and plotted for each slice across the axial FOV of the scanner. The average system SF was also calculated.
The counting rate performance of the scanner was evaluated using all data acquisition time points. The total system counting rate; trues, randoms, and scatter event rates; as well as noise equivalent counting rates (NECR) were calculated and plotted versus the activity concentration in the plastic tube. Peak values and corresponding activity concentration for these rates were also determined according to the NU01 standard.
Image Quality.
Image quality was evaluated by imaging a torso phantom (NEMA/IEC 2000; Biodex) containing 6 spheres (1-mm wall thickness). The spheres IDs were 1, 1.3, 1.7, 2.2, 2.8, and 3.7 cm. The spheres were positioned around the circumference of a 11.5-cm-diameter circle with their centers lying in the same transverse plane. A 5-cm-diameter cylindric insert filled with foam pellets with an average density of 0.3 g/mL was also positioned in the center of the torso phantom to simulate lung tissue. The smallest 4 spheres (hot spheres) and background volume were filled with water with an activity concentration of 32.5 kBq/mL and 7.4 kBq/mL, respectively, giving a sphere-to-background ratio of 4.4. The 2 remaining spheres (cold spheres) were filled with nonradioactive water. To simulate a typical human study with radioactivity present outside the FOV of the scanner, the scatter and counting rate performance phantom was placed with its 70-cm long axis directly behind the torso phantom. The plastic tubing inside the scatter phantom was filled with 123.2 MBq of activity. The torso phantom was then positioned centrally in the FOV of the scanner, whereas the scatter phantom was positioned directly behind it and extending outside the FOV of the scanner. Data were then acquired in 2D and 3D modes using the acquisition prescription described by the NEMA protocol. The frame duration of the 2D and 3D acquisition modes was set to 8.5 and 7.5 min, respectively, since attenuation correction was performed using a CT scan. The 2D and 3D data were then reconstructed using OSEM and FORE-OSEM, respectively, after applying all corrections. The 2D reconstruction parameters were 30 subsets, 2 iterations, loop filter (1-dimensional gaussian smoothing across the distance bins in sinogram space) and postfilter (2D gaussian smoothing on the final image array) of 6- and 5.47-mm FWHM, respectively, whereas those for the 3D reconstruction were 32 subsets, 3 iterations, post and loop filters of 4.29- and 3.91-mm FWHM, respectively. To quantify the image quality, regions of interest (ROIs) with diameters equal to the actual ID of the spheres were then drawn on the transverse slice bisecting the center of the spheres. Twelve additional ROIs were also drawn in the warm background of that slice as well as on slices ±10 and ±20 mm away, adding to a total of 60 background ROIs. The hot and cold sphere contrast for each sphere size as well as the percentage background variability was then calculated according to the NU01 standard.
To evaluate the accuracy of attenuation and scatter correction, ROIs of 30-mm diameter were drawn on the lung insert of the central slice as well as on slices ±10 and ±20 mm away. The average ROI values across these slices were then used to calculate the residual lung error as defined by the NU01 standard.
RESULTS
All the performance evaluation tests were repeated several times to ensure the accuracy of the reported results. None of the repeated tests produced significant differences from the data presented here.
NEMA 1994
Resolution.
The results of the 2D and 3D radial and tangential transverse resolution averaged across the axial FOV are summarized in Table 1.
NU94 Transverse Resolution in 2D and 3D Modes
SF.
The SF for 2D and 3D across the axial FOV of the scanner are shown in Figure 1. The average 2D and 3D SFs are 13% and 29%, respectively. During phantom placement, the activity did not extend completely through the FOV. As a result, true events detected for the end slices were greatly decreased. Therefore, the SF for these slices was reported inappropriately high. These slices have been removed from the average system response.

SF across axial FOV of scanner in both 2D and 3D modes, measured according to NEMA NU94 standard.
Sensitivity.
The 2D and 3D sensitivity across the axial FOV of the scanner are shown in Figures 2A and 2B, respectively. The measured volume sensitivity with a ring difference of ±5 (default for 2D mode) was 9.58 kilocounts per second (kcps)/kBq/mL (trues + scatter) and 8 kcps/kBq/mL (trues only). The measured volume sensitivity using a ring difference of ±23 (3D mode) was 47.1 kcps/kBq/mL (trues + scatter) and 32.9 kcps/kBq/mL (trues only).
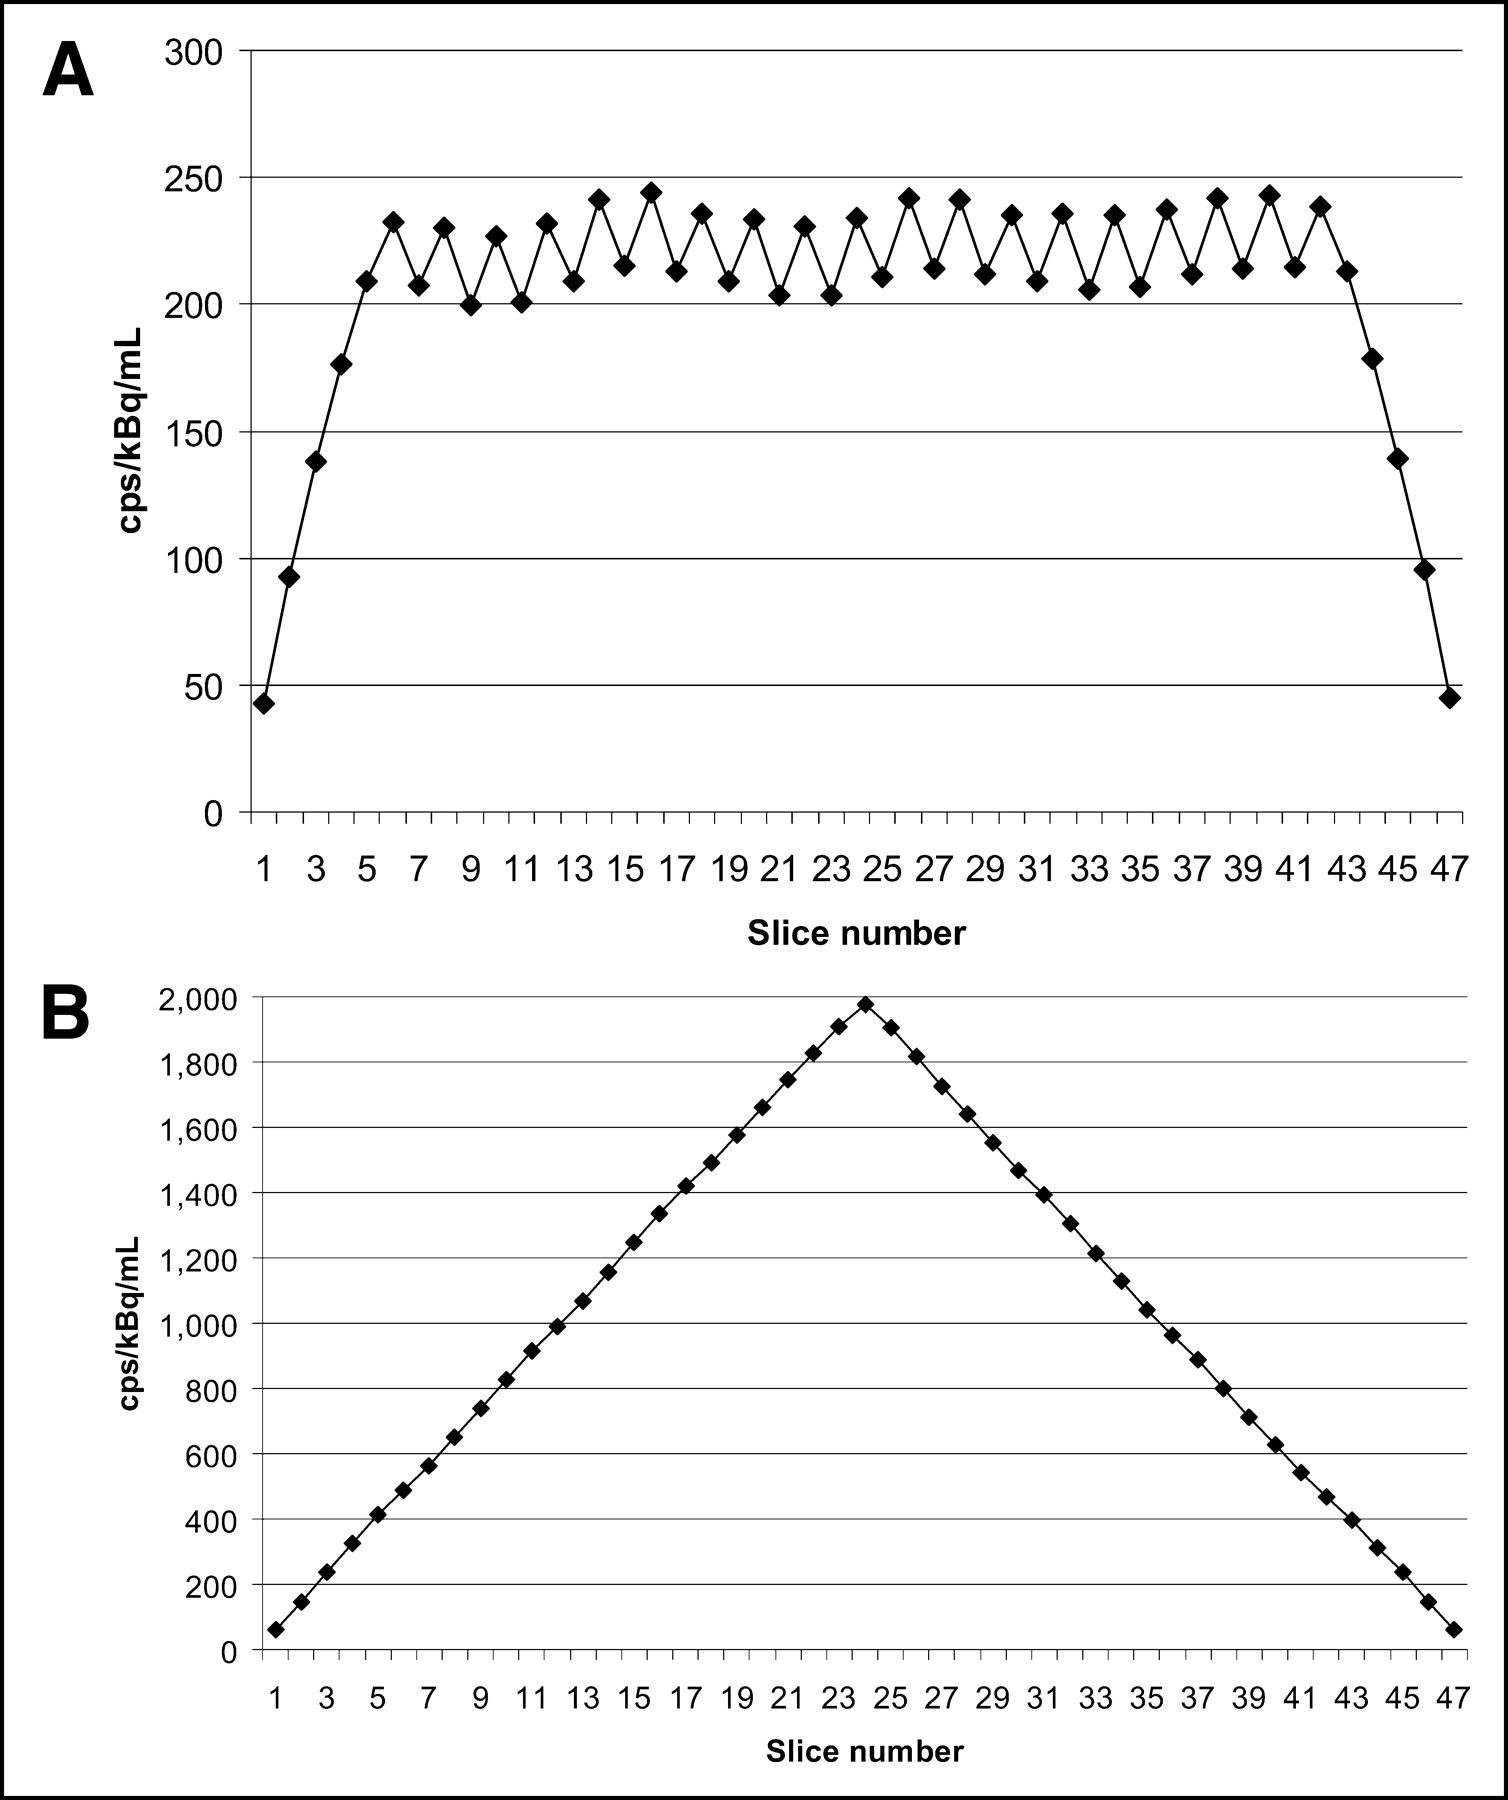
Sensitivity across axial FOV of scanner measured according to NEMA NU94 standard. (A) Results for 2D data acquisition mode. (B) Results for 3D data acquisition mode.
Counting Rate Performance.
Figure 3 shows the 2D and 3D counting rate performance and percentage dead-time curves of the scanner. Figure 3A shows that the 2D trues peak rate is 729 kcps at a corresponding activity concentration of 221 kBq/mL. The 3D trues peak rate (Fig. 3B) is 906 kcps at a corresponding activity concentration of 53.6 kBq/mL. The 2D trues counting rate and activity concentration at 50% dead time are 707 kcps and 169.5 kBq/mL, respectively, and the corresponding 3D values are 828 kcps and 70.9 kBq/mL, respectively (Fig. 3C). NECR was not measured since it was not part of the NEMA NU94 standard. The plots shown in Figure 3 were generated with delayed-event randoms acquisition. Because the data acquisition stream must process the randoms events, there is a counting rate limitation at high activities for this mode. However, as the delayed-events subtraction (DST) system supports randoms from singles, acquisition of the delayed-event channel is not required. Data acquisition without randoms acquisition was conducted and the analysis was repeated. The 2D and 3D results generated for the randoms from singles (RFS) analysis are shown on the same figures respectively.
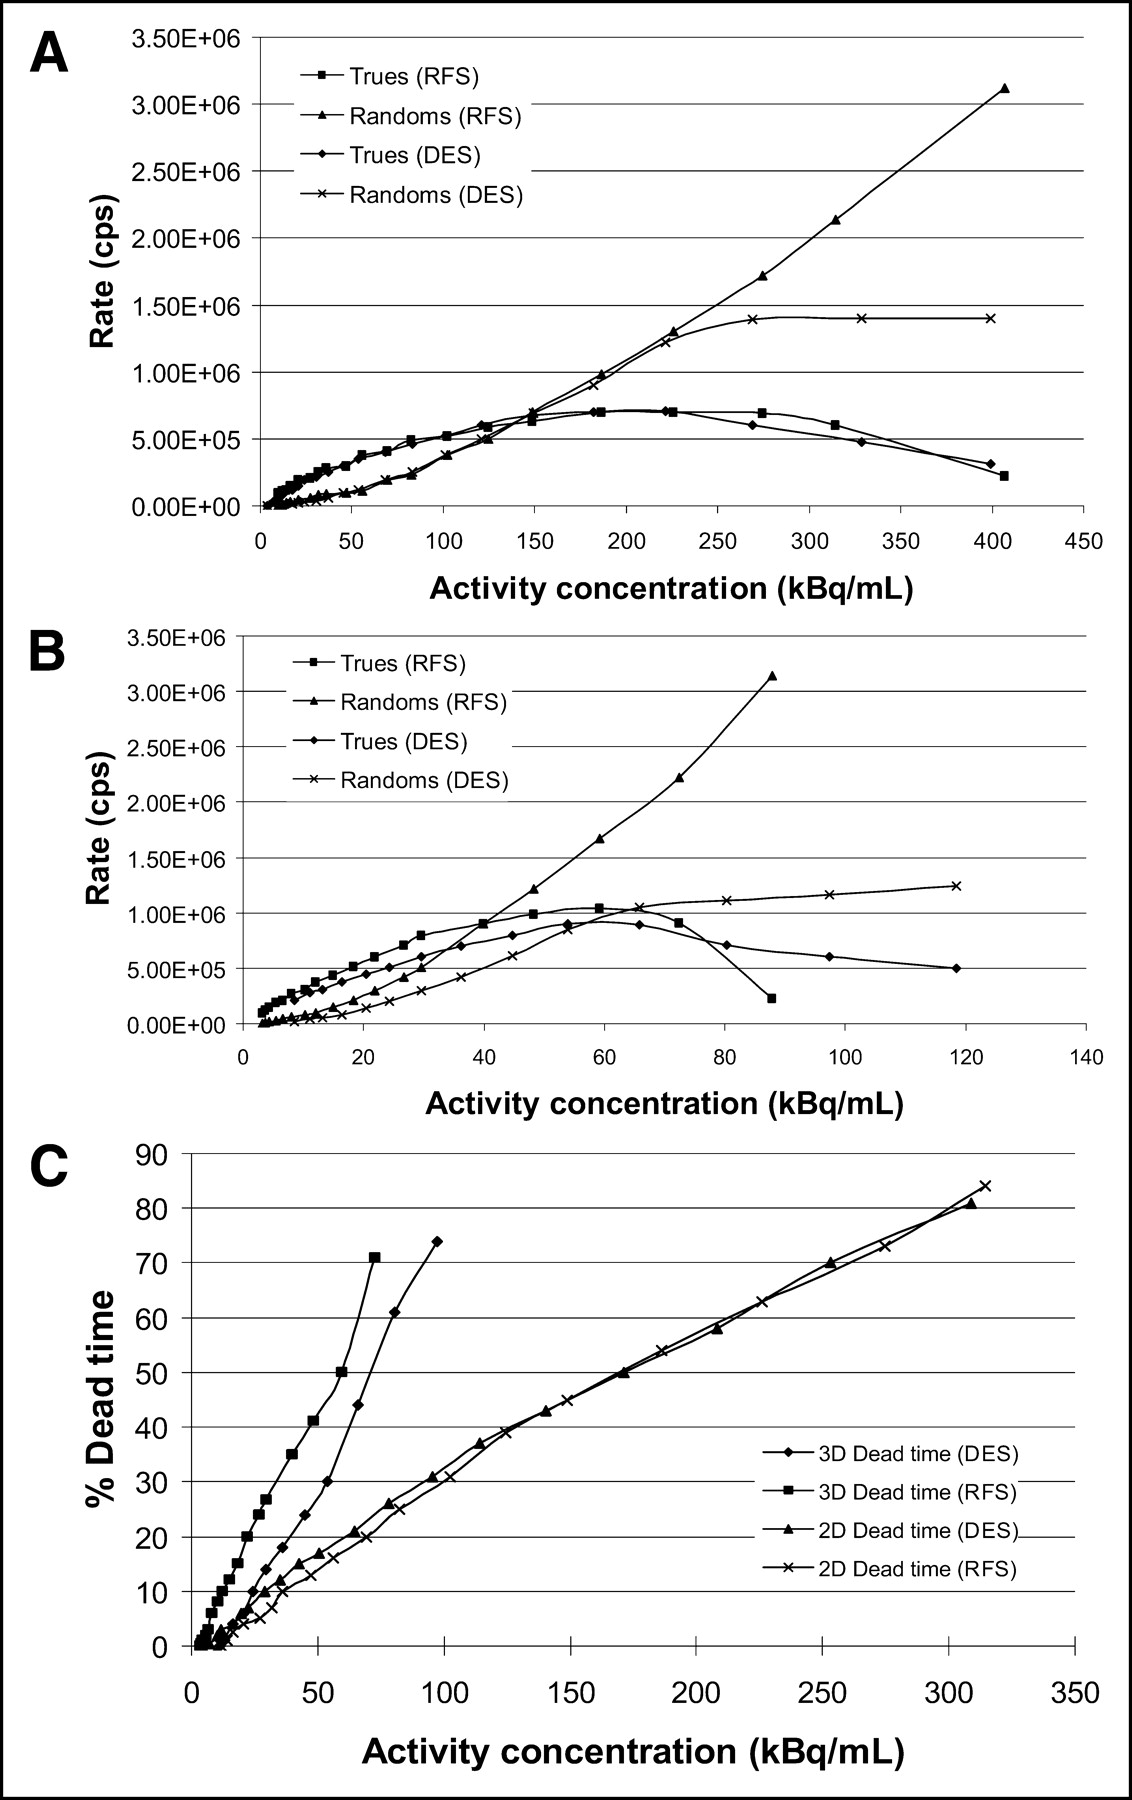
System counting rate performance (A and B) and percentage dead time (C) of scanner in 2D and 3D modes at various levels of activity within phantom, measured according to NEMA NU94 standard. Plots show true and random counting rates processed with delayed-events subtraction (DES) as well as randoms from singles (RFS).
NEMA 2001
Resolution.
The 2D and 3D transverse and axial resolution are summarized in Tables 2 and 3.
NU01 Transverse Resolution in 2D and 3D Modes
NU01 Axial Resolution in 2D and 3D Modes
Sensitivity.
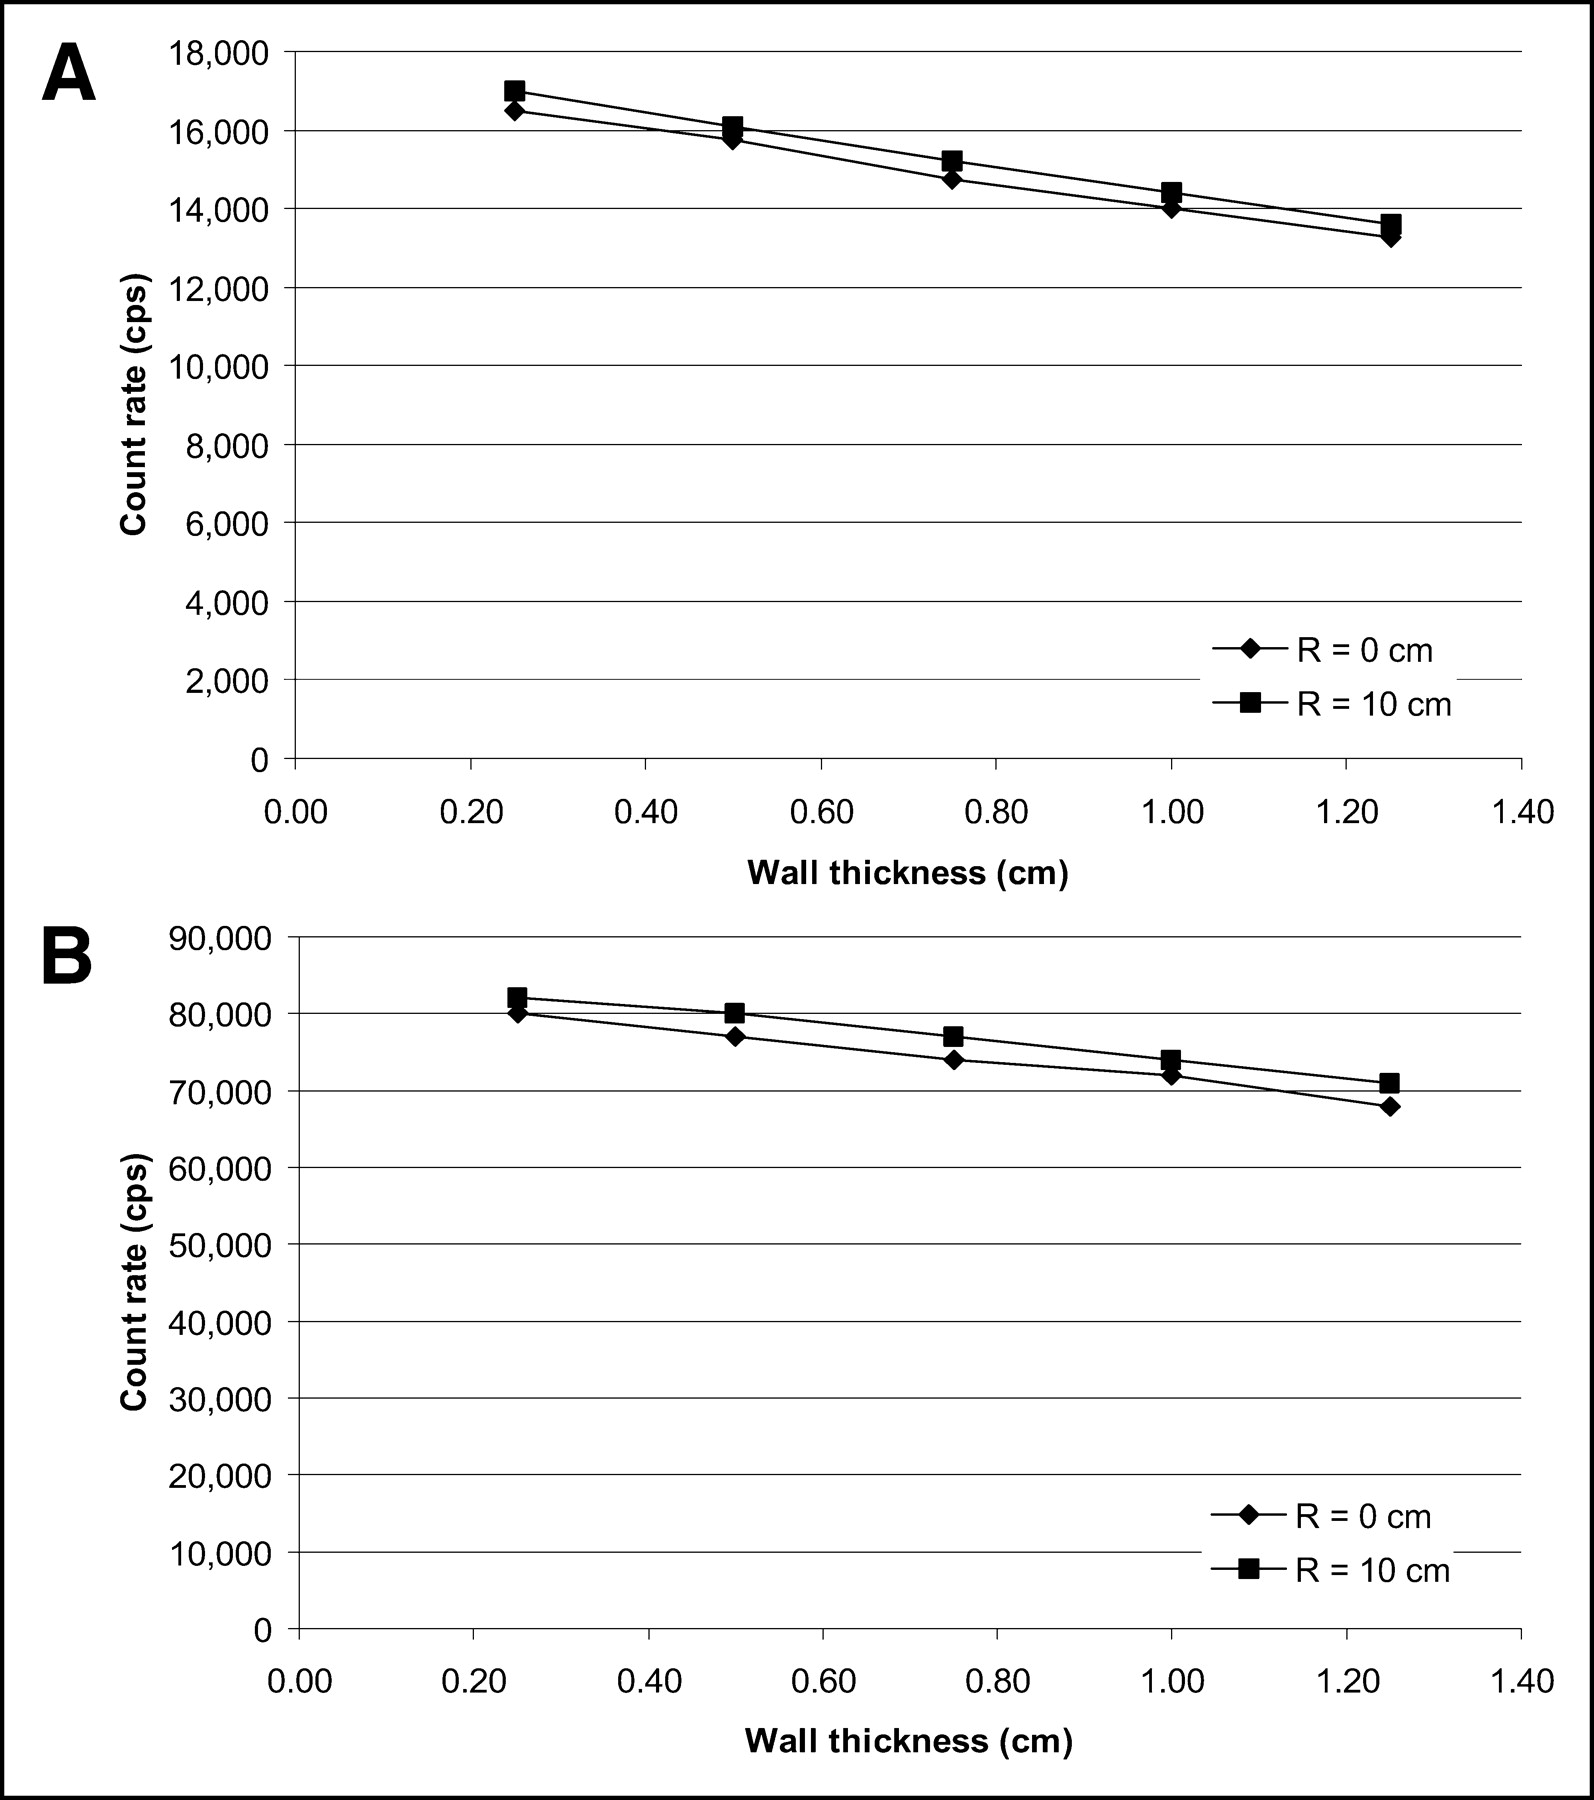
The system’s 2D and 3D sensitivity at both radial locations (R = 0 and R = 10 cm) are given in Table 4. Figures 4A and 4B show the 2D and 3D sensitivity profiles across the axial FOV of the scanner for both R = 0 and R = 10 cm. The attenuation coefficient of the aluminum sleeve was found to be 0.11/cm in 2D mode and 0.07/cm in 3D mode. These results were determined by extrapolating the system events counting rate to calculate the total counting rate in the absence of any attenuating material (wall thickness = 0) (Figs. 5A and 5B).

Sensitivity across axial FOV of scanner measured according to NEMA NU01 standard. (A) Results for 2D data acquisition mode. (B) Results for 3D data acquisition mode.

System event rate at R = 0 and 10 cm. (A) Results for 2D data acquisition mode. (B) Results for 3D data acquisition mode.
NU01 Sensitivity in 2D and 3D Modes
SF and Counting Rate Performance.
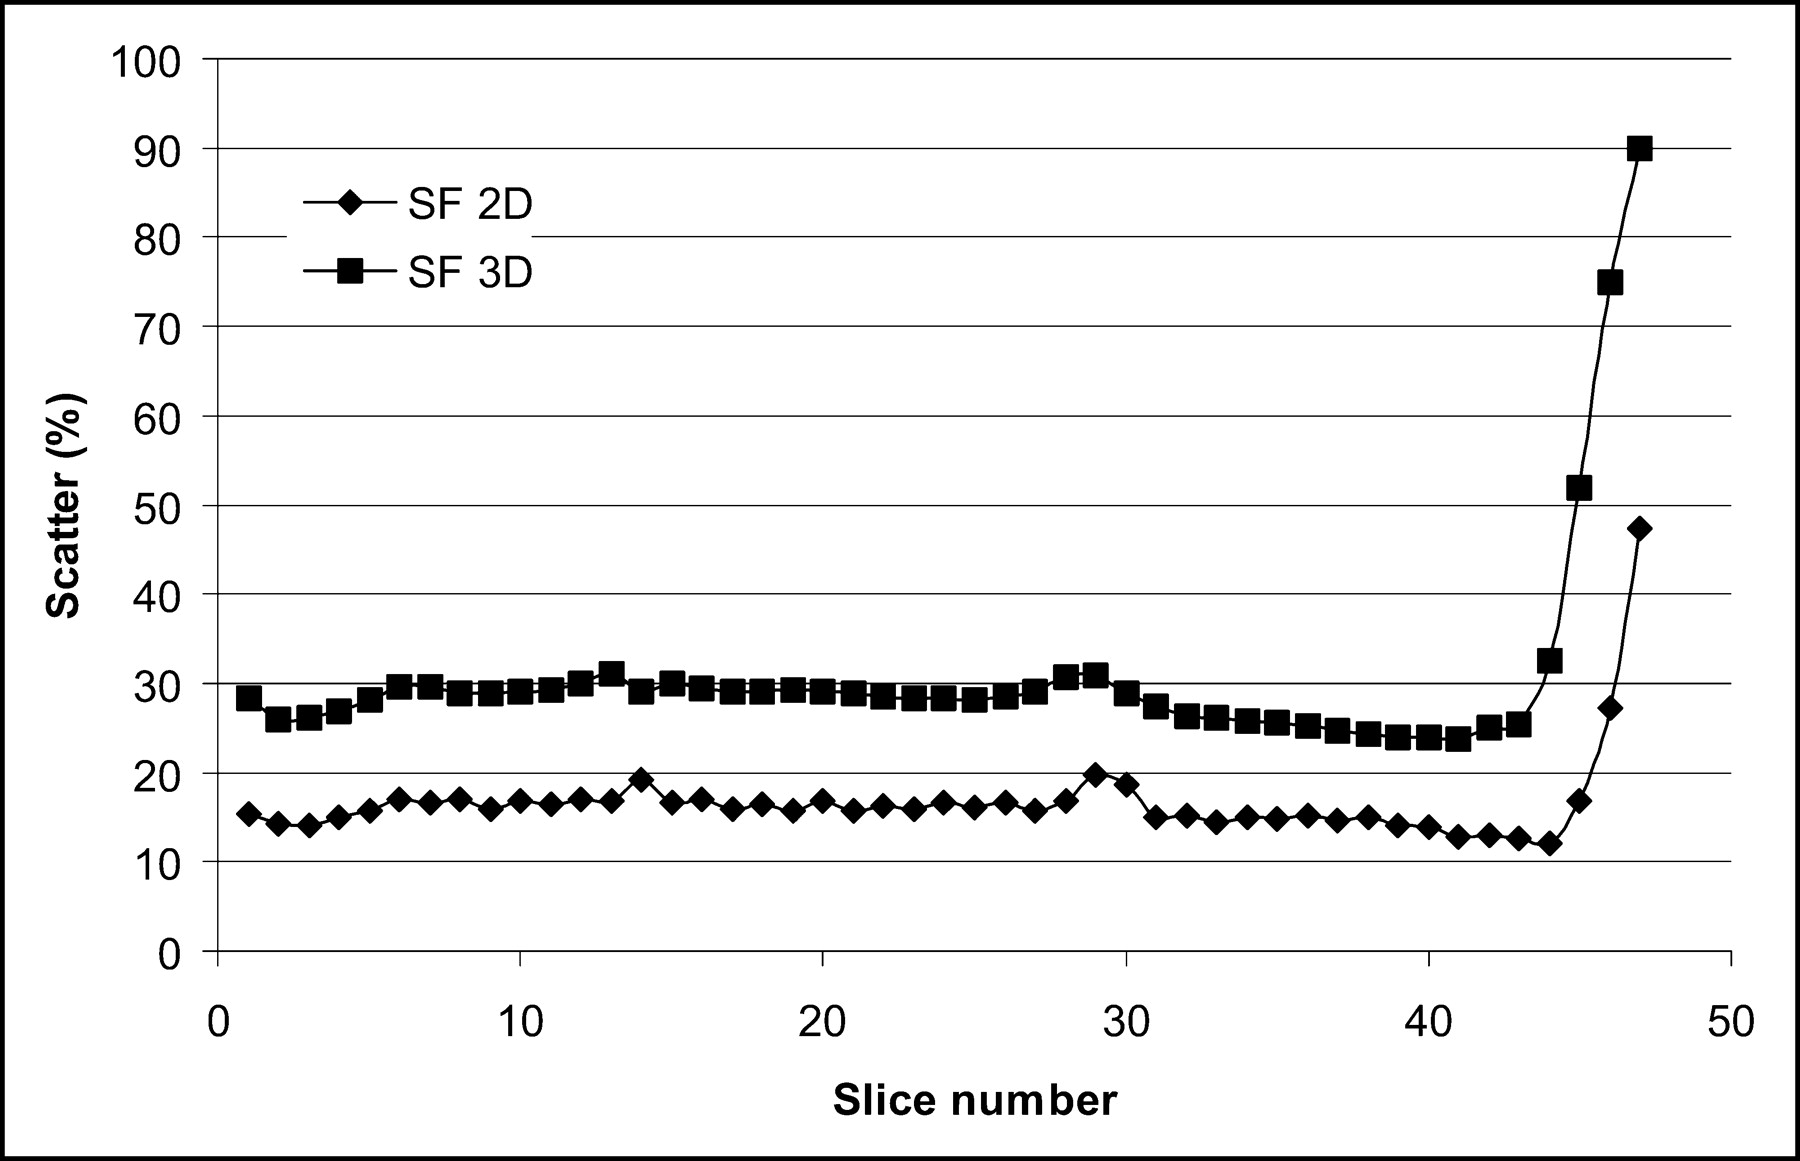
Figures 6 and 7A and 7B show the SF and counting rate performance of the scanner in 2D and 3D modes, respectively. The average SF across the axial FOV of the scanner in 2D and 3D was 19.1% and 45.1%, respectively. For the 2D data acquisition mode, the peak trues rate was 300 kcps and occurred at 115.2 kBq/mL, whereas the peak randoms rate was 1,127.3 kcps at 115.2 kBq/mL. The peak NECR evaluated with singles randoms subtraction was 90.2 kcps at 52.5 kBq/mL, whereas the NECR with delayed randoms subtraction was 61.5 kcps at 43.1 kBq/mL. For the 3D data acquisition mode, the peak trues rate was 338 kcps and occurred at 104.4 kBq/mL, whereas the peak randoms rate was 2,381.8 kcps at 85.7 kBq/mL. The peak NECR evaluated with singles randoms subtraction was 67.8 kcps at 12 kBq/mL, whereas the NECR with delayed randoms subtraction was 47.3 kcps at 9.8 kBq/mL.

SF of PET scanner in 2D and 3D modes across axial FOV of scanner measured according to NEMA NU01 standard.
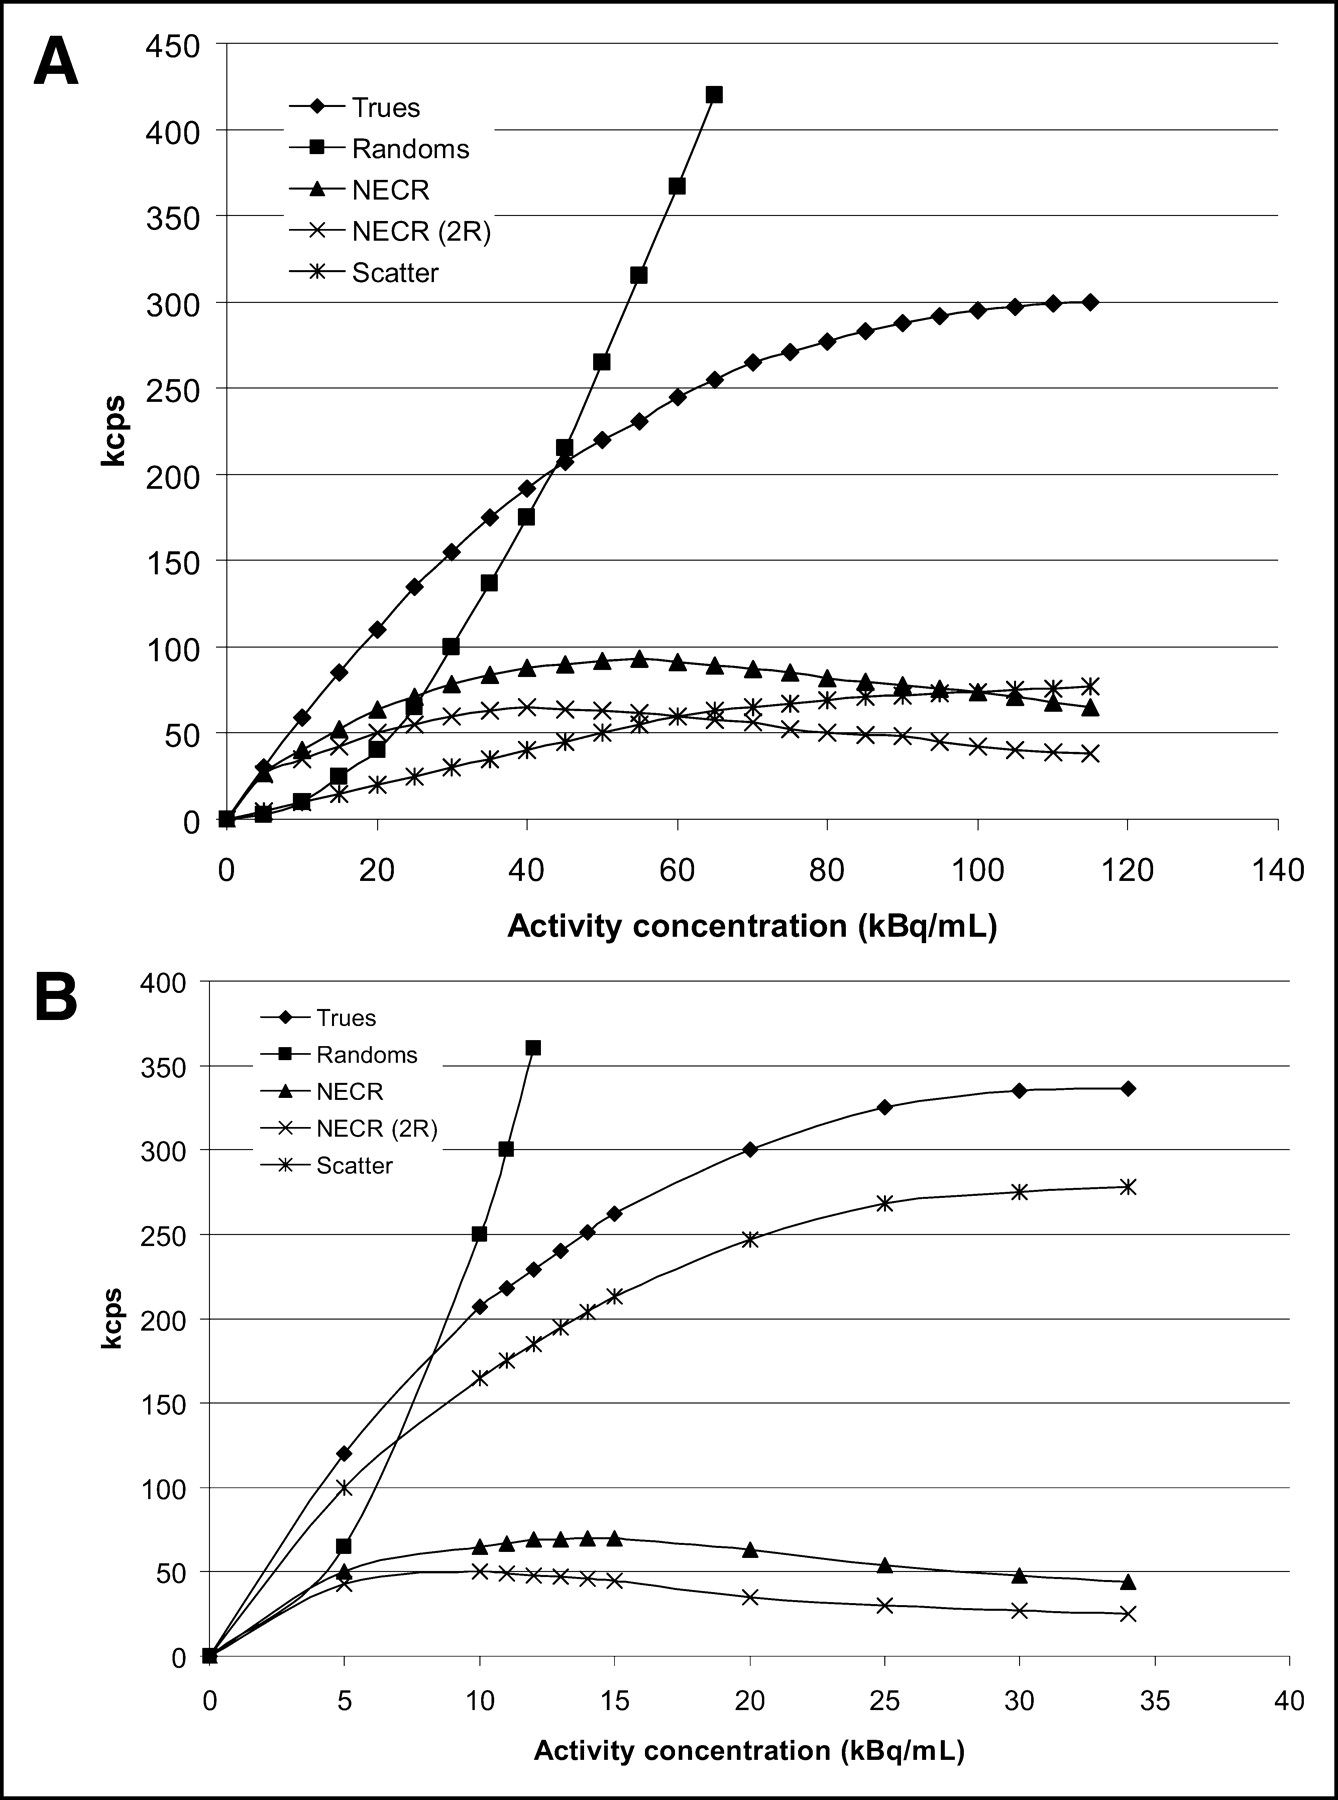
Counting rate performance of PET scanner at various levels of activity within phantom, measured according to NEMA NU01 standard. (A) Results for 2D mode. (B) Results for 3D mode. NECR (2R) is NECR evaluated with randoms correction from DES.
Image Quality.
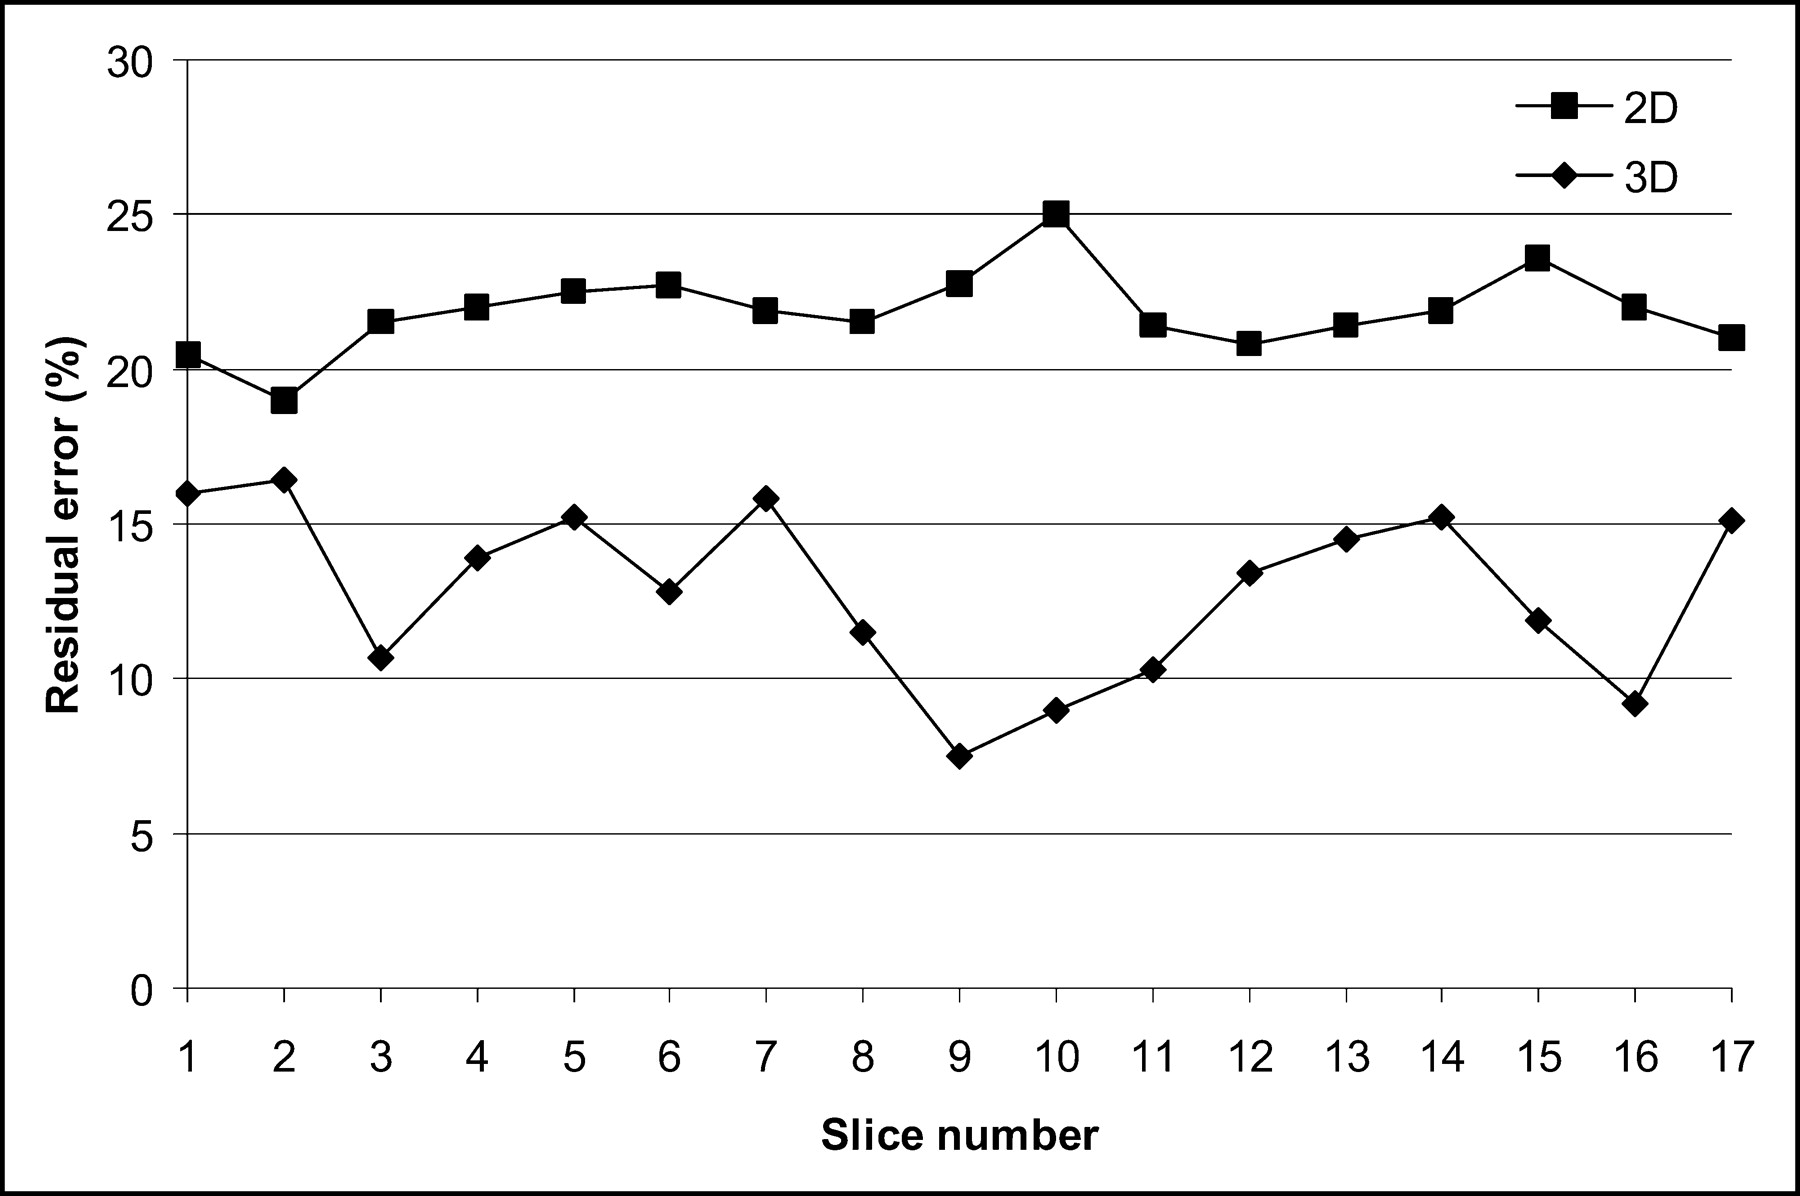
The results of the image quality test in 2D and 3D modes are summarized in Tables 5 and 6, respectively. The 2D and 3D percentage residual lung error in each slice within ±20 mm from the transverse slice passing through the center of the spheres is shown in Figure 8. The average 2D percentage residual error was 21%, whereas that for 3D was 14%.

Residual lung error in 2D and 3D modes for each slice within ±20 mm from transverse plane passing through center of spheres in torso phantom.
NU01 Image Quality in 2D Mode
NU01 Image Quality in 3D Mode
Clinical Imaging.
Since the installation of the scanner, >1,800 clinical studies have been conducted with an average daily throughput of 16 patients per day. Two representative image sets, acquired in 2D and 3D modes, are provided to demonstrate the image quality of the Discovery ST scanner when imaging patients with different body weight. The first dataset (Figs. 9A and 9B) shows a 52-y-old, 112-kg male patient with non–small cell lung cancer (NSCLC) imaged in 2D (Fig. 9A) and 3D (Fig. 9B) modes. The patient was injected with 666 MBq of 18F-FDG and scanned in 2D mode 94 min after injection. The 3D imaging was performed at the end of the 2D scan (118 min after injection). The second dataset (Figs. 9C and 9D) is from a 44-y-old, 50-kg female patient with NSCLC also imaged in 2D and 3D modes. This patient was injected with 732 MBq of 18F-FDG and scanned in 2D and 3D modes, 91 and 110 min after injection, respectively. For both patients, the acquisition time per FOV for both 2D and 3D emission data was 3 min. Slice overlap for 2D and 3D modes was 3 and 7, respectively. The 2D reconstruction parameters were 30 subsets; 2 iterations; post and loop filters of 6- and 5.47-mm FWHM, respectively; those for the 3D reconstruction were 32 subsets; 3 iterations; post and loop filters of 4.29- and 3.91-mm FWHM, respectively. CT attenuation correction was done for both 2D and 3D PET data. The CT acquisition parameters were 140 kV, 120 mA, 0.8 s/rot, and a pitch of 1.35. Scatter correction was performed for both studies in both 2D and 3D modes using the manufacturer’s supplied software. The patients were asked to hold their breath at midexpiration during the CT acquisition.

Quality of axial, sagittal, and coronal images obtained from 2 clinical whole-body oncologic studies acquired on Discovery ST scanner. (A and B) 2D and 3D images of 52-y-old, 112-kg male patient with NSCLC. (C and D) Same set of images for 44-y-old, 50-kg female patient with NSCLC and metastasis in liver.
Figures 9A and 9B show axial, coronal, and sagittal images of the same slice in 2D and 3D modes, respectively, of the male patient. Figures 9C and 9D show corresponding images for the female patient. The 2D and 3D images of the male patient clearly show a large centrally located left lung mass associated with hilar and mediastinal adenopathy. The images of the female patient show metastases in the liver. These 2 patient image sets suggest that even with a large patient weight (which result in an increased SF), the Discovery ST is capable of generating good-quality images.
DISCUSSION
The transverse resolution across the FOV of the scanner is fairly constant, changing from ∼6 to ∼7.5 mm only over a radial distance of 0–20 cm. This is an important feature since lesions at any location within the body could be identified with the same resolution. As such, the accurate quantification of these lesions is dependent on their size only rather than on size and location. Furthermore, the axial resolution results using the NU01 standard show that the axial resolution is similar to the transverse resolution, giving an isotropic volume imaging. PET images can, hence, be reformatted into any direction without loss of resolution.
The results of the NU94 and NU01 SF in 2D (3D) mode are 16% (30%) and 19% (45%), respectively. The 2D results are higher than the previous General Electric scanner design (2D, 9%; 3D, 34%) (14) due to the wider bore and shorter septa. However, the 2D SF is still a relatively small percentage of the true events, and the effect is offset by the increased true sensitivity that the shorter septa provide. Furthermore, the wider bore has not significantly impacted the 3D SF.
The system sensitivity results derived from the NU94 are substantially different from those obtained from the NU01 measurement. This is attributed to the difference in source geometry and analysis methods between the 2 tests. Both standards showed good results for both 2D and 3D modes. In particular, the NU01 test reported high results at both radial locations, making this scanner very suitable for whole-body imaging at very low activity concentrations. The high sensitivity values are mainly due to the reduced ring diameter as well as a high detector packing fraction obtained by minimizing the gaps between detector blocks and intercrystal separation (no saw cuts or thick reflector materials).
The peak trues rates and peak NECR rates for the NU94 and NU01 tests demonstrate the counting rate capability of the Discovery ST scanner in both 2D and 3D modes. As expected, high-activity studies with large randoms fractions show improved NECR with randoms correction based on singles acquisition. Additionally, the NU94 counting rate results obtained with randoms from singles estimation showed performance advantages at high activities relative to delayed-event randoms acquisition (Fig. 3A). As a result, randoms estimated from the singles measurement is the recommended mode of accidental coincidence correction for general operation.
The image quality tests in 2D and 3D modes showed that the small spheres are easily detectable with a target-to-background ratio of 4, although accurate quantification of the small sphere activity concentration is problematic due to a significant partial-volume effect. Residual lung error was lower in 3D than in 2D. This is attributable to improved scatter correction accuracy in areas of low tissue density with the 3D analytic model-based scatter algorithm. The results of the clinical imaging studies show that both imaging modes (2D and 3D) have high image contrast leading to good visual image quality, even when the imaging is performed on large patients (Fig. 9).
CONCLUSION
The performance characteristics of the Discovery ST PET/CT scanner have been evaluated. The evaluation was performed using both NEMA standards—NU94 and NU01—in both 2D and 3D imaging modes to cover the scanner’s performance under all imaging conditions and to provide a benchmark for comparison with other PET systems. The results indicate that the scanner has a nearly uniform and isotropic resolution across the FOV and a high sensitivity and counting rate performance, making this PET scanner very suitable for clinical whole-body imaging.
Footnotes
Received Oct. 24, 2003; revision accepted May 21, 2004.
For correspondence or reprints contact: Osama Mawlawi, PhD, Department of Imaging Physics, M.D. Anderson Cancer Center, 1515 Holcombe Blvd., Box 56, Houston, TX 77030.
E-mail: Omawlawi@mdanderson.org


