


Abstract
Skeletal muscle glucose utilization (SMGU) can be measured by dynamic PET imaging with 18F-FDG to characterize insulin resistance. The aim of this study was to determine the validity of simple methods to quantify SMGU by static PET imaging. Methods: Ten patients underwent dynamic 18F-FDG PET of the femoral region during hyperinsulinemic euglycemic clamping. SMGU was determined by Patlak graphical analysis using data from dynamic imaging with frequent arterial blood sampling. Standardized uptake values (SUVs) were calculated at 45 and 55 min after tracer injection. Skeletal muscle-to-background ratio (SM/B ratio), tissue count divided by venous plasma activity, was also computed at 45 and 55 min. These simple indices were compared by linear regression with the SMGU measured as above, and an estimated SMGU was obtained using the regression equation thus generated, together with a simple index. Results: SMGU was highly correlated with SUVs (r = 0.941 at 45 min, r = 0.951 at 55 min) and SM/B ratios (r = 0.968 at 45 min, r = 0.984 at 55 min). Although SMGU was almost proportional to SM/B ratios, the y-intercepts of the regression lines for SUVs significantly differed from zero. The residual in estimating SMGU using the regression equation was marginally smaller for SM/B ratios than for SUVs and for indices at 55 min than at 45 min, but these differences did not reach statistical significance. Correction for plasma glucose level slightly elevated the correlation coefficients between SMGU and these simple indices. Conclusion: It is proposed that the simple quantitative indices, SUV and the SM/B ratio, are reliable indicators of SMGU during hyperinsulinemic euglycemic clamping. Static imaging with or without a single venous blood sampling may therefore be able to replace dynamic imaging with frequent arterial blood sampling, offering substantially greater convenience in evaluating insulin resistance.
Insulin resistance is defined as a decreased glucose utilization response to the stimulatory effect of insulin. It is widely accepted that insulin resistance plays an important role in the development of ischemic heart disease as well as noninsulin-dependent diabetes mellitus (NIDDM) (1), hypertriglyceridemia (2–4), essential hypertension (5), and other diseases. Because insulin resistance was found to be closely related to the occurrence of coronary artery disease in persons with common underlying coronary risk factors (6,7), investigation of the pathophysiology of and therapeutic strategies for insulin resistance is important for the early prevention of coronary artery disease. Several factors, including impaired skeletal muscle glucose utilization (SMGU) (1), reduced peripheral blood flow (8), and altered fatty tissue metabolism (9,10), have been shown to contribute to insulin resistance. Among these factors, SMGU is thought to be the most important in determining whole-body insulin resistance because it can account for approximately 70%–80% of the whole-body glucose disposal rate (GDR) in normal humans. However, due to technical difficulties, the percentage of SMGU that would contribute to the whole-body GDR in several diseases with whole-body insulin resistance has not been determined. In addition, it is important to distinguish the effects of skeletal muscle glucose metabolism and other factors separately for a much more precise understanding of insulin resistance syndrome in subjects with coronary risk factors.
PET with 18F-FDG allows the measurement of SMGU in vivo (5,11–21). Unlike the whole-body GDR, PET provides an index of regional insulin resistance. Sequential measurement of myocardial glucose utilization (MGU) and SMGU has been reported using a single injection of 18F-FDG (5,11,20). It is possible that glucose utilization varies between skeletal muscle and myocardium and among skeletal muscles of different compositions. 18F-FDG PET has the potential to provide detailed insights into the pathophysiology of insulin resistance in clinical settings.
In previous studies, dynamic imaging was performed to evaluate skeletal muscle insulin resistance by 18F-FDG PET (5,11–20). A 3-compartment model has been used to successfully describe the kinetics of 18F-FDG in human skeletal muscle (21), like that in the brain. Because dephosphorylation of 18F-FDG-6-phosphate is negligible in skeletal muscle (22), SMGU can be calculated by Patlak graphical analysis of the acquired dynamic data (23). However, dynamic PET imaging is time-consuming and represents a substantial burden for both the patient and the PET laboratory. Patient movement during the imaging process may degrade the acquired data, which is a serious problem, especially in estimating SMGU of the extremities. In oncology, 18F-FDG uptake in the target region is often estimated by static imaging instead of dynamic imaging. The standardized uptake value (SUV) is calculated from tissue counts on static images, injected dose, and body weight, and its utility is well accepted as an indicator of 18F-FDG uptake in clinical PET studies (24). Use of the SUV has also been reported for the evaluation of skeletal muscle activity in runners (25); however, it has not been validated as an indicator of SMGU. A similar index, the 18F-FDG uptake index, was described in cardiology and shown to correlate with MGU (26). The myocardium-to-background ratio (M/B ratio) is another simple index of MGU and is derived from static imaging and a single venous blood sampling (27). Substituting static imaging for dynamic imaging increases convenience and appears to facilitate the sequential assessments of glucose utilization in different regions. In this study, we performed dynamic 18F-FDG PET of the femoral region with frequent arterial blood sampling to calculate SMGU. The SUV and the skeletal muscle-to background ratio (SM/B ratio), an analog of the M/B ratio, were defined as simple indices of 18F-FDG uptake and compared with SMGU. The aim of the study was to examine the validity of simple quantification of SMGU by static 18F-FDG PET.
MATERIALS AND METHODS
Subjects
18F-FDG PET during hyperinsulinemic euglycemic clamping was performed in 11 patients to evaluate SMGU of the femoral region. They were selected based on the fact that they had diseases with the possibility of associated insulin resistance, and no other specific inclusion criteria were used. One patient was excluded from the analysis because of considerable body movement during the PET imaging. Consequently, 10 patients participated in the study (3 women, 7 men; age range, 27–77 y; mean age, 57.8 ± 18.2 y). Four had NIDDM, 2 hyperlipidemia, 3 both NIDDM and hyperlipidemia, and 1 had hypertension. The general characteristics of study subjects are summarized in Table 1. The investigative nature of the study was fully explained to each patient before informed consent was obtained. The University of Tokyo’s Human Subject Protection Committee approved the study protocol.
General Characteristics of Study Group
PET
18F was synthesized using the Cypris 370 cyclotron (Sumitomo JYUKI Industries, Ltd.), and 18F-FDG was synthesized with an automated system based on the method reported by Ehrenkaufer et al. (28). Radiochemical purity was >95%. Skeletal muscle 18F-FDG images were obtained using a Headtome IV PET scanner (Shimadzu Corp.). This PET scanner has 7 imaging planes; in-plane resolution is 4.5 mm at full width at half maximum (FWHM), and the z-axial resolution is 9.5 mm at FWHM. Effective in-plane resolution was 7 mm after using a smoothing filter. The sensitivities of the Headtome IV scanners are 378 and 649 kcps (kBq/mL) for direct and cross planes, respectively.
Before the injection of 18F-FDG, hyperinsulinemic euglycemic clamping was undertaken to keep the plasma glucose concentration around 100 mg/dL by simultaneous infusion of insulin at a fixed rate (6 pmol/kg/min) and glucose at a variable rate. When the plasma glucose concentration became constant, 18F-FDG (185–370 MBq) was injected intravenously over 60 s. Dynamic imaging of the midthigh region was started at commencement of tracer injection and continued for 60 min 45 s. Five 15-s frames were acquired, followed by the collection of three 30-s frames, four 120-s frames, four 300-s frames, and three 600-s frames. An arterial blood sample for the measurement of plasma radioactivity was taken at the midtime of each frame during the entire imaging period, and a total of 19 arterial blood samples were obtained. In addition, radioactivity in venous plasma was assayed at the midtime of each frame for the last 7 frames. Arterialization of venous blood was not undertaken.
Data Analysis
All data were corrected for dead time, decay, and measured photon attenuation, and transaxial images were reconstructed. Fifteen circular regions of interest (ROIs) of 5 mm in diameter were placed within the femoral muscles of each side. Tissue activity was determined from the mean counts for the 30 ROIs and used for the calculation of SMGU, SUV, and SM/B ratio. Arterial plasma and tissue time–activity curves were analyzed by the graphical method described by Patlak et al. (23) to determine the fractional rate of tracer uptake and phosphorylation (K complex [Ki]). In the graphical analysis, the slope of the linear portion of the plots, which is equal to Ki, was calculated by linear regression of the last 7 points. Ki is equal to k1 × k3/(k2 + k3), where k1 is the transfer coefficient from intravascular space into the tissue, k2 is the initial clearance and efflux coefficient, and k3 is the phosphorylation rate constant. The dephosphorylation rate constant, k4, is assumed to be zero in the Patlak method. SMGU was calculated by substituting Ki in the equation SMGU = Ki × Glp/LC, where Glp is the mean of the plasma glucose level measured every 5 min during imaging, and LC is the lumped constant. The LC represents the differences in the transport and phosphorylation of 18F-FDG and glucose and was assumed to be 1.0 in skeletal muscle cells (5,11–20). To calculate SMGU, we used an Ultra 30 high-speed image-processing system (Sun Microsystems Japan) with Dr. View software (Asahi Kasei Information System Co. Ltd.).
The SUV and the SM/B ratio were defined as simple indices of SMGU. SUV was calculated by the equation SUV = (Ct × BW)/(ID × CF), where Ct is tissue count (counts per second [cps]/mL), BW is body weight (g), and ID is injected dose (MBq). CF is the calibration factor between the dose calibrator and PET. Tissue counts were determined on the last 2 frames of dynamic imaging. The midtime of the last frame was 55.75 min, and the SUV at 55 min was calculated using the tissue count on this frame. The SUV at 45 min was obtained from the next to last frame. The tissue count on the last frame (cps/mL) was divided by venous plasma activity (cps/mL) at the corresponding time, and the SM/B ratio at 55 min was defined. The SM/B ratio at 45 min was calculated in a similar fashion. SMGU was plotted against the SUVs and SM/B ratios, and linear regression analysis was performed. SMGU was estimated using the regression equation thus obtained and the SUV or SM/B ratio and was compared by linear regression with the SMGU measured by Patlak graphical analysis. The residual, absolute difference between measured and estimated SMGUs was calculated as the indicator of estimation error.
Moreover, SUVs and SM/B ratios were corrected for plasma glucose level. The SUVs and SM/B ratios were multiplied by the plasma glucose level (in mg/dL) and divided by 100 to obtain corrected indices. The corrected indices were compared with SMGU, in a manner similar to the uncorrected indices.
Statistical Analysis
Data are expressed as mean ± SD. Linear regression analysis was performed by the least-squares method. A paired t test was used to compare the errors in estimating SMGU. A P value < 0.05 was considered significant.
RESULTS
SMGU was successfully calculated by Patlak graphical analysis in the 10 patients and determined at 43.8 ± 29.2 μmol/min/kg (range, 6.5–85.2 μmol/min/kg). A significant negative correlation was found between SMGU and venous plasma activity at 45 min (Fig. 1, r = −0.659, P < 0.05). The relationship between SMGU and venous plasma activity at 55 min was similar, although it did not reach statistical significance (r = −0.632, P = 0.05).
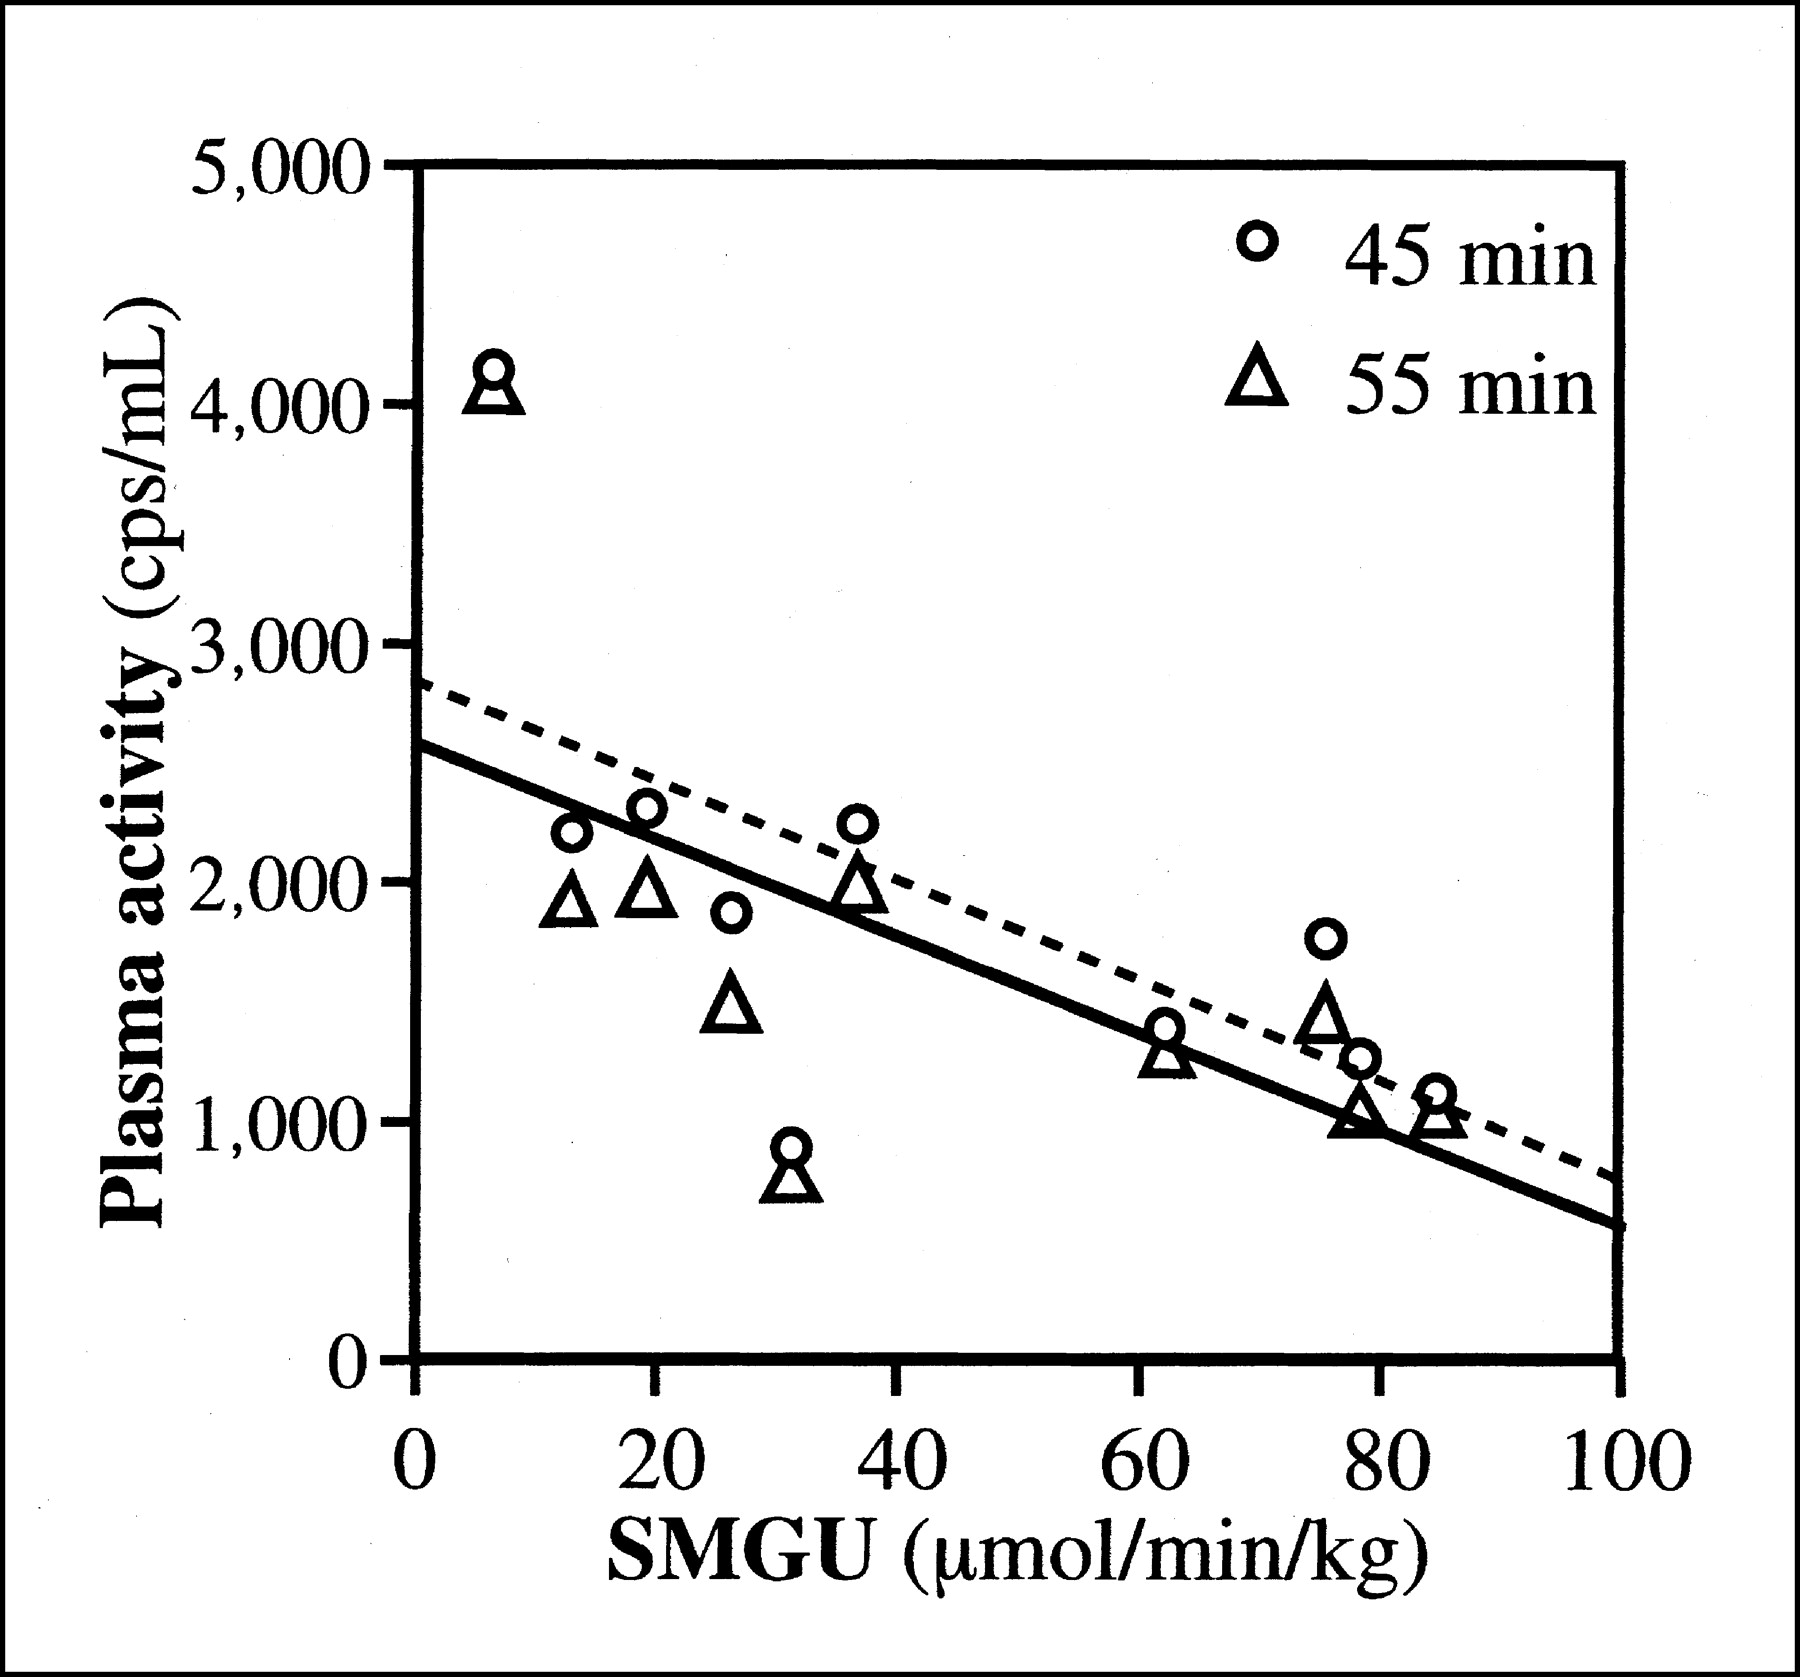
SMGU and venous plasma activities at 45 and 55 min. Broken and solid lines represent regression lines for plasma activities at 45 min (y = −20.9x + 2839.0, r = −0.659, P < 0.05) and 55 min (y = −20.1x + 2591.3, r = −0.632, P = 0.05), respectively.
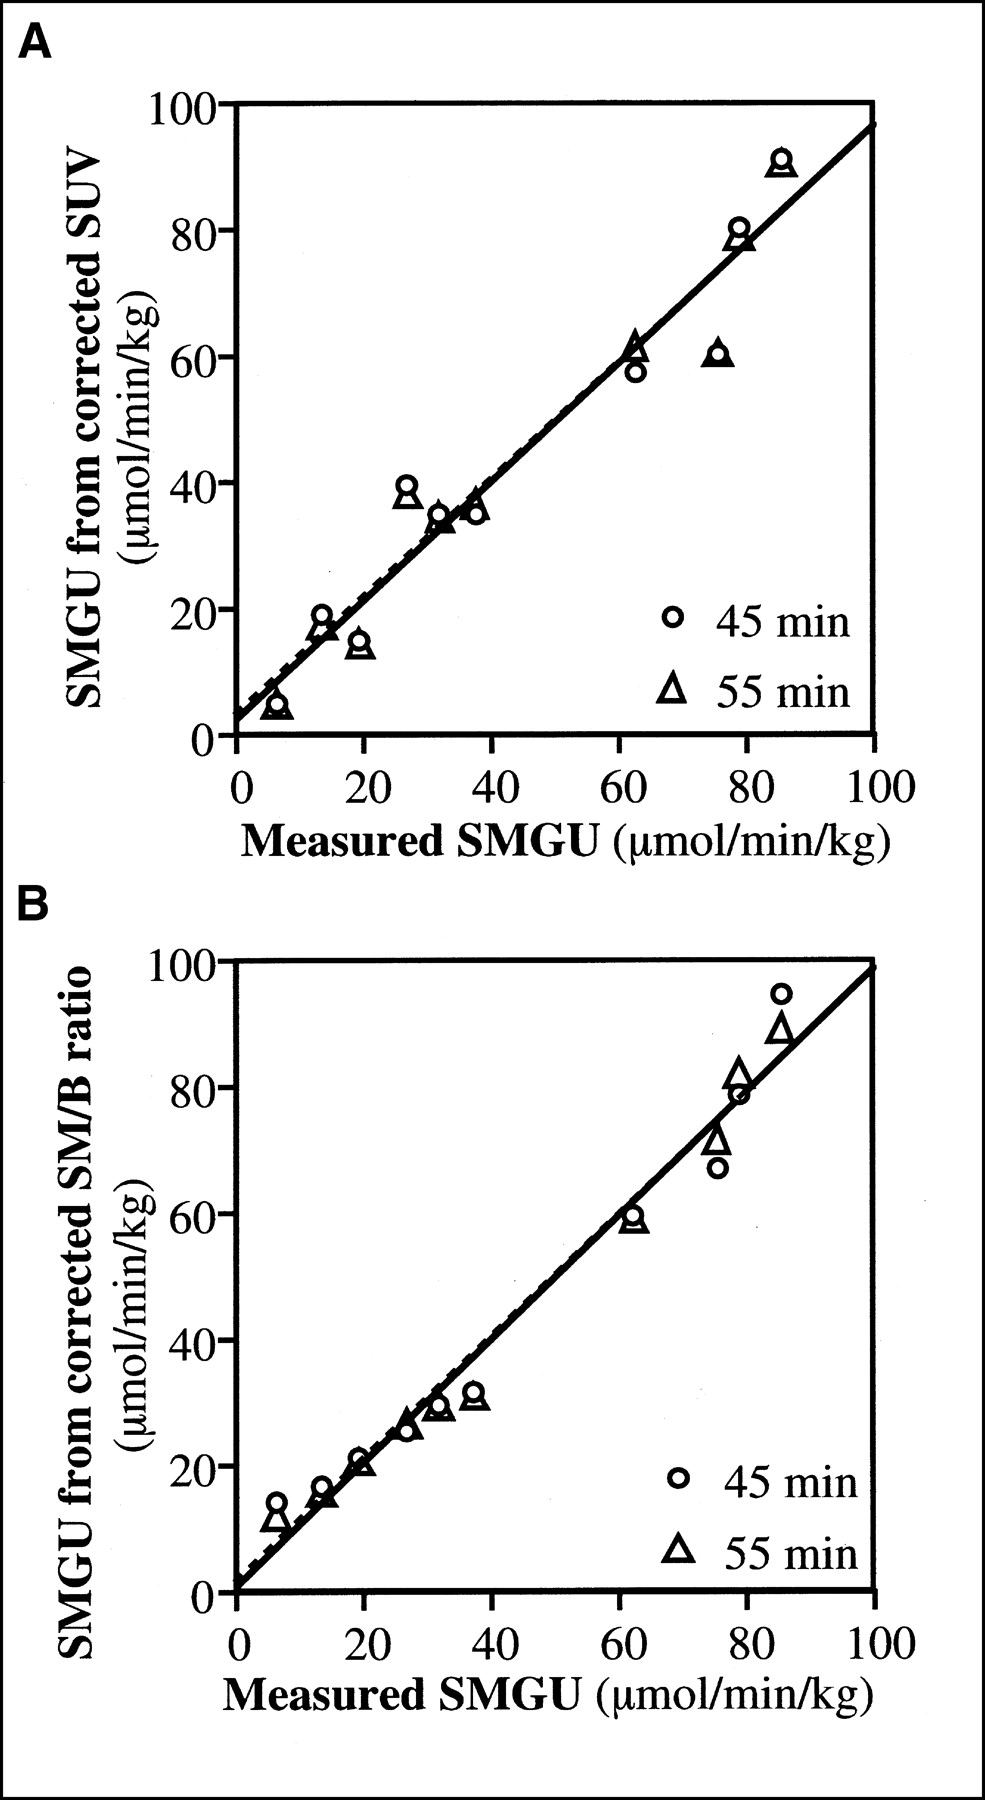
SUVs at 45 and 55 min were 3.22 ± 1.31 (range, 1.46–5.79) and 3.34 ± 1.40 (range, 1.45–6.04), respectively. SMGU was highly correlated with SUVs at 45 min (Fig. 2A; y = 20.91x − 23.61, r = 0.941, P < 0.0001) and 55 min (y = 19.77x − 22.23, r = 0.951, P < 0.0001). SM/B ratios at 45 and 55 min were 1.094 ± 0.798 (range, 0.275–2.663) and 1.304 ± 0.940 (range, 0.279–2.970), respectively. There was also an excellent correlation between SMGU and SM/B ratios (Fig. 2B; y = 35.42x + 5.02, r = 0.968, and P < 0.0001 at 45 min; y = 30.56x + 3.93, r = 0.984, and P < 0.0001 at 55 min). The y-intercepts of the regression lines for SUVs, but not SM/B ratios, were significantly less than zero (P < 0.05). SMGU estimated from these simple indices and the regression equations was highly correlated with the measured SMGU (Fig. 3). The residual was marginally smaller for SM/B ratios than for SUVs and for indices at 55 min rather than at 45 min (Table 2); however, these differences were not statistically significant.
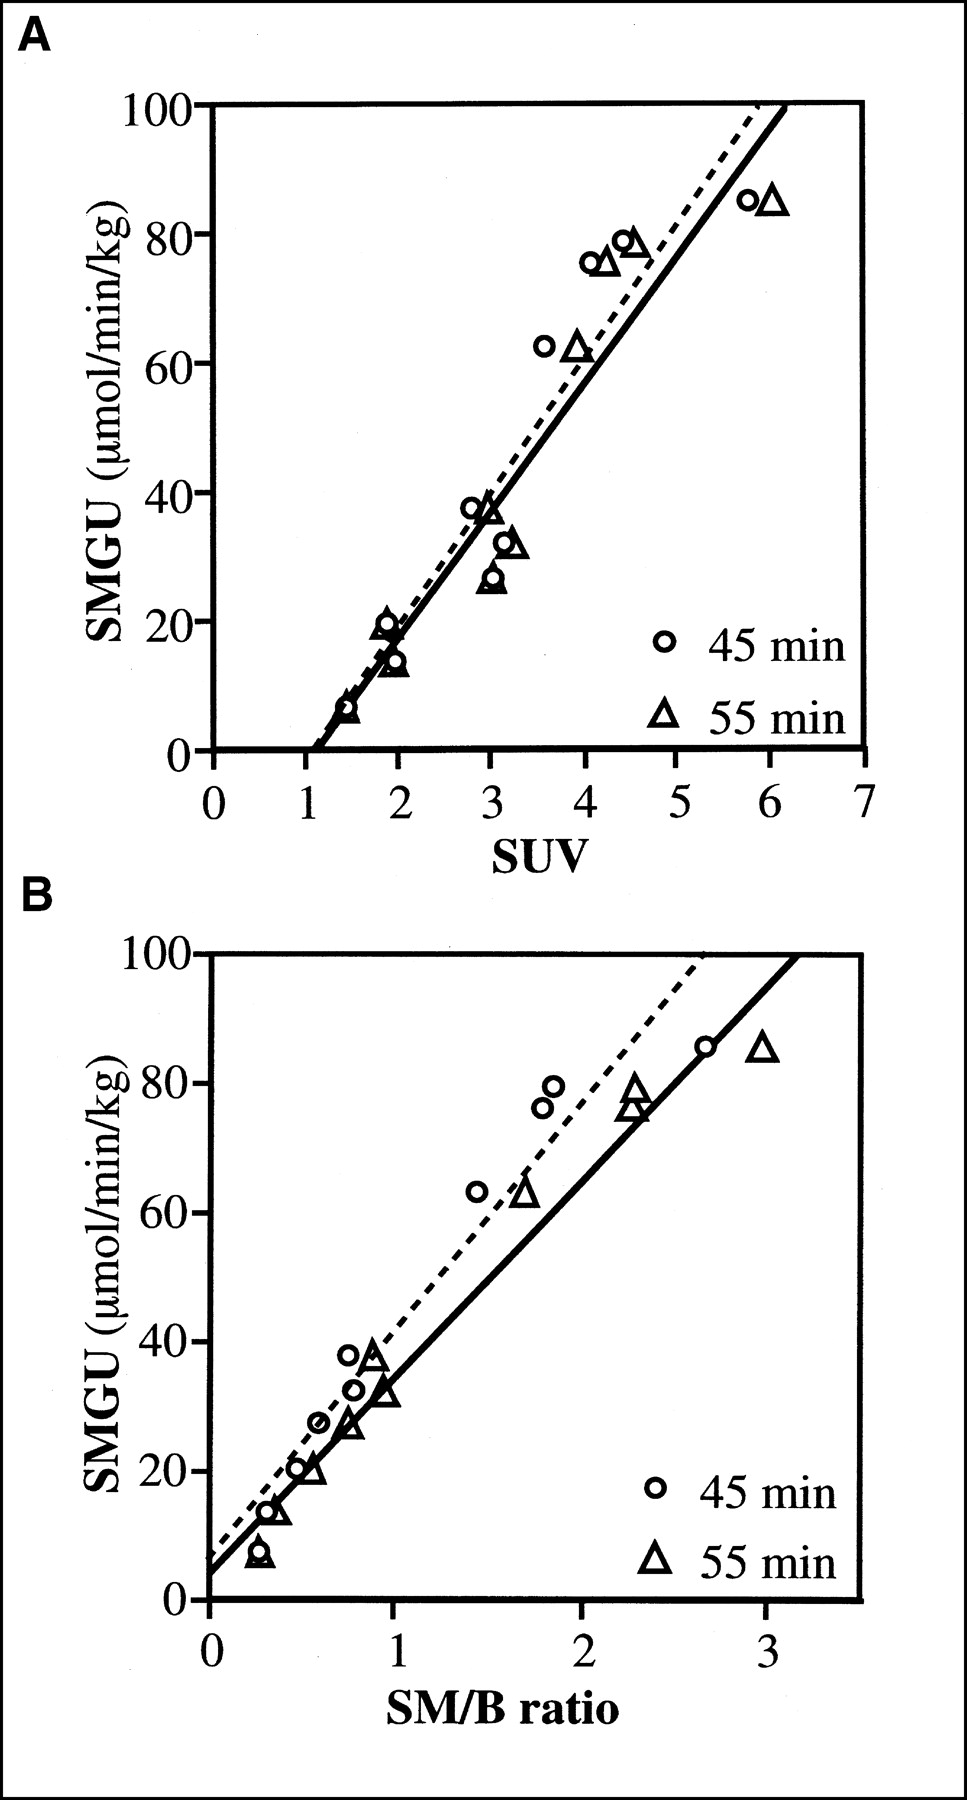
Relation between SMGU and simple indices. (A) SMGU vs. SUV. Broken and solid lines represent regression lines for SUVs at 45 min (y = 20.91x − 23.61, r = 0.941, P < 0.0001) and 55 min (y = 19.77x − 22.23, r = 0.951, P < 0.0001), respectively. (B) SMGU vs. SM/B ratio. Broken and solid lines represent regression lines for SM/B ratios at 45 min (y = 35.42x + 5.02, r = 0.968, P < 0.0001) and 55 min (y = 30.56x + 3.93, r = 0.984, P < 0.0001), respectively.

Relation between SMGUs measured by Patlak graphical analysis and estimated from simple indices. (A) Estimation from SUV. Broken and solid lines represent regression lines for SUVs at 45 min (y = 0.886x + 4.98, r = 0.941) and 55 min (y = 0.904x + 4.22, r = 0.951), respectively. (B) Estimation from SM/B ratio. Broken and solid lines represent regression lines for SM/B ratios at 45 min (y = 0.937x + 2.75, r = 0.968) and 55 min (y = 0.969x + 1.35, r = 0.984), respectively.
Residual in Estimating SMGU from Simple Indices
Plasma glucose levels during PET ranged from 94 to 120 mg/dL with a mean of 106 ± 7 mg/dL. Plasma insulin levels were 56.0 ± 4.2 μU/mL. Correction for plasma glucose level slightly elevated the correlation coefficients between SMGU and SUVs (Fig. 4A; 0.966 at 45 min, 0.971 at 55 min) and between SMGU and SM/B ratios (Fig. 4B; 0.982 at 45 min, 0.991 at 55 min). The y-intercepts of the regression lines for corrected SUVs were significantly less than zero (P < 0.01), but those for SM/B ratios did not significantly differ from zero. Estimation of SMGU from the corrected indices was successful (Fig. 5). The residuals for the corrected indices were smaller than those for the corresponding uncorrected indices; however, the difference was minimal and did not reach statistical significance (Table 2).

Relation between SMGU and simple indices corrected for plasma glucose level. (A) SMGU vs. corrected SUV. Broken and solid lines represent regression lines for corrected SUVs at 45 min (y = 19.57x − 23.47, r = 0.966, P < 0.0001) and 55 min (y = 18.39x − 21.74, r = 0.971, P < 0.0001), respectively. (B) SMGU vs. corrected SM/B ratios. Broken and solid lines represent regression lines for SM/B ratios at 45 min (y = 33.32x + 4.70, r = 0.982, P < 0.0001) and 55 min (y = 28.25x + 4.23, r = 0.991, P < 0.0001), respectively.
Relation between SMGUs measured by Patlak graphical analysis and estimated from simple indices corrected for plasma glucose level. (A) Estimation from corrected SUV. Broken and solid lines represent regression lines for corrected SUVs at 45 min (y = 0.932x + 2.96, r = 0.966) and 55 min (y = 0.943x + 2.49, r = 0.971), respectively. (B) Estimation from corrected SM/B ratio. Broken and solid lines represent regression lines for corrected SM/B ratios at 45 min (y = 0.965x + 1.54, r = 0.982) and 55 min (y = 0.983x + 0.76, r = 0.991), respectively.
DISCUSSION
The SUVs and SM/B ratios calculated at 45 and 55 min showed excellent correlations with SMGU measured by dynamic PET imaging with frequent arterial blood sampling. The excellent correlations may be related to constant plasma glucose level during hyperinsulinemic euglycemic clamping. The femoral region contains a large amount of skeletal muscle and is away from other tissues with high 18F-FDG uptake, which may have also contributed to the successful results. A mean SMGU value in healthy subjects has been reported as 108.9 μmol/min/kg (20), and the population in this study is considered to include patients with insulin resistance. The results of this study indicate that SUVs and SM/B ratios can be used as simple quantitative indices of SMGU to assess insulin resistance. The SUV is obtained using static imaging, and the SM/B ratio is derived from static imaging and a single venous blood sampling. Use of these indices allows shortening of imaging time and omission of frequent arterial blood sampling and facilitates the evaluation of insulin resistance in clinical settings. We experienced substantial body movement during dynamic imaging in 1 subject of this series. A reliable tissue time–activity curve could not be obtained, resulting in failure in calculating SMGU by the Patlak graphical method. These data were excluded from the analysis because of the lack of a standard value; however, the SUV and SM/B ratio could be computed as indicators of SMGU in this case. Imaging of the extremities is susceptible to degradation due to patient motion. Reduction of imaging time appears to decrease the frequency of failure to collect reliable data.
The SUV and SM/B ratio can be converted to SMGU with empiric equations determined in this study. The relation between SMGU and the simple indices does not appear to largely depend on the performance of the equipment used. The equations are inferred to be applicable in other laboratories, although validation is desired. Conversion to SMGU appears to aid in comparing the obtained values with SMGU reported in other studies. The simple indices are obtained by imaging of relatively short duration, and sequential imaging at different positions may allow assessment of 18F-FDG uptake in different regions. For example, SMGU in the trunk may be calculated from the SUV or SM/B ratio at 45 min and in the femoral region from the SUV or SM/B ratio at 55 min. The SUV at 55 min is higher than that at 45 min due to gradual uptake by the skeletal muscle. The time-dependent difference is larger for the SM/B ratio than for the SUV because of plasma clearance. Conversion to SMGU corrects such systematic difference, as shown in Figures 3 and 5, and appears to be useful for the direct comparison of values derived from imaging at different time intervals. Estimation of SMGU in different regions after a single injection of 18F-FDG permits the analysis of regional differences in SMGU and may offer a unique viewpoint on insulin resistance.
Although SM/B ratios were almost proportional to SMGU, the y-intercepts of the regression lines between SUVs and SMGU significantly differed from zero. The basis of using the SUV as an indicator of 18F-FDG uptake is the assumption that the injected dose normalized for body weight represents the input function. Skeletal muscles take up the majority of glucose during insulin stimulation in healthy subjects (29). A higher SMGU may induce faster plasma clearance of 18F-FDG and, consequently, decreased input at the same injected dose normalized for body weight, leading to underestimation of SMGU by using SUV. In this study, SMGU and plasma activity at the late phase were negatively correlated, supporting the effect of SMGU on plasma clearance of 18F-FDG. In calculating SM/B ratios, venous plasma activity at static imaging is used instead of the injected dose normalized for body weight. The proportionality between the SM/B ratio and SMGU indicates that venous plasma activity at a late phase is a useful marker of input function. Correlation coefficients between SMGU and SM/B ratios were slightly higher than those between SMGU and SUVs. The residual in estimating SMGU was smaller using SM/B ratios than when using SUVs, but the difference was not statistically significant. Only a small number of patients were examined in this study, and further investigation of a larger population appears to be required to determine which index is better for assessing SMGU. However, it should be noted that the SUV is not proportional to SMGU during insulin clamping, and conversion to SMGU seems to be recommendable especially for SUV.
The SUV is considered to be an approximate of the Patlak slope, Ki (30), as is the SM/B ratio. Fundamentally, they should be corrected for the plasma glucose level when making comparisons with SMGU. In this study, correction for the plasma glucose level did improve the correlation between these simple indices and SMGU and decreased residuals in estimating SMGU. The differences, however, were insignificant. Lack of statistical significance may be partly attributable to the small population studied. In addition, it appears to be related to the fact that SMGU was evaluated during hyperinsulinemic euglycemic clamping. Interexamination variation in the plasma glucose level was small, and the correction did not cause a large difference in estimated values. On the other hand, the plasma glucose level is monitored in insulin clamping, and the correction does not add substantial labor. Thus, correcting for the plasma glucose level would be recommended, although the effect is minimal.
The results of this study indicate the usefulness of SUVs and SM/B ratios in evaluating SMGU during hyperinsulinemic euglycemic clamping. The applicability remains to be investigated in the fasting or postprandial state. The use of simple indices has been considered in cardiac studies. Tamaki et al. suggested that the 18F-FDG uptake index, an analog of SUV, could be used as an indicator of MGU in the fasting state but not in the postprandial state (26). They ascribed the failure to temporal changes in plasma glucose and insulin levels during the examination. They correlated the 18F-FDG uptake index to MGU without correction for the plasma glucose level, which may also be related to the failure. Choi et al. found a good correlation between Ki and normalized myocardial 18F-FDG uptake, which is also analogous to SUV, in both fasting and postprandial states (31). Nishikawa et al. reported that the 18F-FDG uptake index and M/B ratio can be used as indicators of Ki for the myocardium during fasting, oral glucose loading, and insulin clamping (27). The SUV and SM/B ratio may also reflect SMGU in the fasting and postprandial states as well as during insulin clamping, and correction for plasma glucose level appears to be necessary for diabetic and postprandial patients.
CONCLUSION
The results of this study indicate that SMGU can be estimated using the simple quantitative indices, SUVs and SM/B ratios, during hyperinsulinemic euglycemic clamping. Evaluation of SMGU by static 18F-FDG PET might be of value in investigations of insulin resistance.
Acknowledgments
We thank Tohru Inoue and Yoshio Kojima for their technical support in preparing 18F-FDG.
Footnotes
Received Feb. 10, 2003; revision accepted Jun. 13, 2003.
For correspondence or reprints contact: Ikuo Yokoyama, MD, Department of Cardiovascular Medicine, Graduate School of Medicine, University of Tokyo, 7-3-1 Hongo, Bunkyo-ku, Tokyo 113-8655, Japan.
E-mail: yokochan-tky@umin.ac.jp


