


Abstract
This review article discusses PET agents, other than 18F-FDG, with the potential to monitor the response to therapy before, during, or after therapeutic intervention. This review deals primarily with non–18F-FDG PET tracers that are in the final stages of preclinical development or in the early stages of clinical application for monitoring the therapeutic response. Four sections related to the nature of the tracers are included: radiotracers of DNA synthesis, such as the 2 most promising agents, the thymidine analogs 3′-18F-fluoro-3′-deoxythymidine and 18F-1-(2′-deoxy-2′-fluoro-β-d-arabinofuranosyl)thymine; agents for PET imaging of hypoxia within tumors, such as 60/62/64Cu-labeled diacetyl-bis(N4-methylthiosemicarbazone) and 18F-fluoromisonidazole; amino acids for PET imaging, including the most popular such agent, l-[methyl-11C]methionine; and agents for the imaging of tumor expression of androgen and estrogen receptors, such as 16β-18F-fluoro-5α-dihydrotestosterone and 16α-18F-fluoro-17β-estradiol, respectively.
This special issue of The Journal of Nuclear Medicine is aimed at exploring the clinical impact of PET in individualizing treatment regimens in cancer patients and describing the potential use of PET in personalized medicine. However, it is clear that although 18F-FDG is the mainstay for PET, it is not suited for all applications and, in particular, for monitoring the effectiveness of highly specialized therapies. This review article contains 4 sections related to the biologic targets of tracers: radiotracers of DNA synthesis, agents for PET imaging of hypoxia, amino acids for PET imaging, and agents for the imaging of androgen and estrogen receptors (ERs). The biology of the systems and the clinical trials (if applicable) that have been undertaken are the main topics covered. The results of the trials discussed are summarized in tabular format (Table 1). This review is extensive but not exhaustive, and focus was placed on the radiopharmaceuticals that are considered to be the most widely studied in each category. Given the breadth of cancer biology and the targets to be explored, the future prospects for monitoring therapy with novel PET agents that are currently in preclinical development are discussed.
Selected Clinical Studies Using Molecular Probes Other Than 18F-FDG for Monitoring of Therapy with PET
It is important not to overlook SPECT radiopharmaceuticals for the prediction and detection of tumor responses for several diseases and therapeutic regimens. Some are already in common use; examples of such agents are radioiodide for thyroid cancer (1–3); radiolabeled metaiodobenzylguanidine (4–11) and radiolabeled octreotide analogs (12,13) for neuroendocrine tumors; and the anti-CD20 radioantibodies ibritumomab tiuxetan (Zevalin; Cell Therapeutics, Inc.) and tositumomab (Bexxar; GlaxoSmithKline), which have been approved by the U.S. Food and Drug Administration for use in lymphoma. Others, such as radiolabeled annexin molecules for the detection of cell apoptosis, have shown great promise in clinical trials (14,15). However, these SPECT tracers are not the focus of this review of PET agents.
IMAGING MARKERS OF DNA SYNTHESIS
Clinical trials of radiotracers of DNA synthesis for tumor imaging have identified the thymidine analogs 3′-18F-fluoro-3′-deoxythymidine (18F-FLT) (Fig. 1A) and 18F-1-(2′-deoxy-2′-fluoro-β-d-arabinofuranosyl)thymine (18F-FMAU) (Fig. 1B) as the 2 most promising agents. Bading and Shields recently provided an excellent, concise overview of these 2 tracers (and others) in clinical assays of cellular proliferation (16). Our review focuses in detail on the use of 18F-FLT and 18F-FMAU for the prediction and detection of responses to various anticancer regimens and on the published results of clinical trials.

(A) 18F-FLT. (B) 18F-FMAU.
What Does 18F-FLT and 18F-FMAU Uptake Signify?
Insight into the pharmacokinetics of 18F-FLT and 18F-FMAU should assist in the interpretation of imaging for the purpose of monitoring the clinical response to a therapeutic regimen. During the 2- to 3-h time period after intravenous injection, when PET with 18F-FLT or 18F-FMAU usually is performed, the activity of thymidine kinase (TK), a key enzyme in the salvage pathway of DNA synthesis, affects the cellular retention (or trapping) of these tracers. The phosphorylation of thymidine and its analogs makes these exogenous molecules too polar to exit the cell via the plasma membrane. DNA synthesis occurs in both the cytosol and the mitochondria. Different isoenzymes of TK trap thymidine and its analogs in the cytosol and mitochondria: TK 1 (TK1) and TK 2 (TK2), respectively. Cytosolic TK1 favors 18F-FLT over 18F-FMAU as a substrate (17); mitochondrial TK2 favors 18F-FMAU (18). The TK1 and TK2 selectivities of 18F-FLT and 18F-FMAU are manifested in the normal biodistributions of these tracers. For example, human cardiomyocytes are rich in mitochondrial TK2; visualization of the human heart is distinct on 18F-FMAU PET images but faint on 18F-FLT PET images.
Cytosolic TK1 activity is dependent on the cell cycle, but mitochondrial TK2 activity is not (18). Mitochondrial TK2 expression is independent of the cell cycle, whereas cytosolic TK1 expression is high during the S, G2, and M phases and low during the G0 and G1 phases. Hence, 18F-FMAU PET visualizes the activity of TK2 in the mitochondrial DNA synthesis pathway, but tissue concentrations of 18F-FMAU do not seem to be an accurate index of cellular proliferation (19). Bone marrow, for example, a proliferative tissue containing an abundance of cells progressing through the cell cycle, avidly accumulates 18F-FLT but not 18F-FMAU. TK1 expression, but not TK2 expression, has been associated with aggressive disease in breast cancer (20,21). However, 18F-FMAU uptake seems to be an accurate index of the total mass of mitochondria in a tissue. Besides the 18F-FMAU avidity of mitochondrion-rich cardiomyocytes, conditions that induce an increase in cardiomyondrial mass in cancer cells will increase the cellular accumulation of 18F-FMAU (18).
Do Changes in 18F-FLT and 18F-FMAU Uptake Signify Mere Biologic Effects or Therapeutic Efficacy?
Basically, then, 18F-FLT PET provides data on TK1 activity and an index of cell cycling and tissue proliferation, and 18F-FMAU PET provides data on TK2 activity and an index of mitochondrial mass in a tissue. Because TK1 and TK2 are independent enzymes, changes in 18F-FLT and 18F-FMAU uptake appear to provide different types of biologic information (18).
Knowledge of the pharmacodynamics or biomolecular effects of a therapeutic regimen is required for an accurate interpretation of changes in the uptake of 18F-FLT or 18F-FMAU for the purpose of monitoring a clinical response. Although the induction of cell death by cytotoxic regimens may decrease the total amount of tissue TK present, the enzymatic activity of the residual tissue TK may increase or decrease; cytostatic regimens also may increase or decrease TK activity. Hence, the biologic effect of therapy on 18F-FLT or 18F-FMAU uptake and its implication for the response of a tumor to therapy require scientific dissection.
In Vitro and In Vivo Studies
In vitro, TK1 and TK2 expression increased after a single high-dose-rate irradiation of cancer cells but normalized by 24 h (22). Several chemotherapeutic agents were reported to decrease the expression of both TK1 and TK2; these included dideoxycytidine (23) and arabinosylcytosine (24). In a xenograft model, the anti–epidermal growth factor receptor (EGFR) agents cetuximab and erlotinib decreased tumor TK1 expression, with a concomitant reduction in 18F-FLT uptake (25). In vitro, 18F-FLT uptake by cancer cells changed markedly in the first 24 h after therapy. In cells, cytostatic concentrations of cisplatin markedly decreased 18F-FLT uptake (26,27); inhibitory concentrations of 5-fluorouracil (5-FU) (26), methotrexate (26), doxorubicin (28), and gemcitabine (26) increased total 18F-FLT uptake (26) while the growth of cells slowed. In other in vitro studies, some involving tumor spheroid models, there was a decrease in 18F-FLT uptake after treatment with doxorubicin (27,29), docetaxel (27), and an Hsp90 inhibitor (30). In a study in which several tracers and treatments were compared, little to no change in 18F-FLT uptake occurred after treatment of a breast cancer cell line with tamoxifen or imatinib, but this finding correlated with the minimal effect of the treatment on cellular proliferation (27). For 5-FU, a marked increase in 18F-FLT uptake was observed in vivo (31). Others reported that 5-FU increased TK1 levels ∼163%−180% at ≤4 h (28,31) and up to 44% at 72 h (28) but that total 18F-FLT uptake in treated cells (normalized to the uptake in untreated cells) did not change, except at 72 h, when it decreased; this apparent lack of correlation between changes in TK1 levels and 18F-FLT uptake was discordant with the majority of evidence. Hence, the decrease observed at 72 h but not before might have been attributable, in part, to differences in the sizes of the cell populations.
5-FU inhibits thymidylate synthase, a key enzyme in the de novo DNA synthesis pathway; hence, a shift to the salvage pathway induced by 5-FU blockade of the de novo pathway should increase TK1 levels and 18F-FLT uptake. Paclitaxel did not change 18F-FLT uptake, although cells accumulated in the G2 and M phases (28). Paclitaxel is a taxane that stabilizes microtubules in the mitotic spindle, blocking cell division and provoking apoptosis. In vivo preclinical studies revealed that inhibition of the mammalian target of rapamycin kinase (mTOR) decreased 18F-FLT uptake in sensitive but not resistant tumors (32). In radiotherapy, dysregulation of the physiologic p53 tumor suppressor gene was associated with resistance to radiotherapy and a persistence of high levels of 18F-FLT uptake after therapy, whereas intact p53 function was associated with tumor radiosensitivity and decreased 18F-FLT uptake after therapy (33). Multiple preclinical in vivo studies revealed that 18F-FLT PET is effective in detecting the antiproliferative effects of therapeutic regimens (25,34–46).
As a general rule, the changes in 18F-FLT uptake reported in these in vitro and preclinical in vivo studies occurred in the first 24 h of treatment, sometimes within a few hours. These exciting preclinical findings invite speculation that a patient might undergo 18F-FLT PET on the same day as treatment initiation, and the PET data might predict the treatment response, allowing rapid changes in the therapeutic regimen, if needed.
Clinical Studies with 18F-FLT
Tumors often do not concentrate 18F-FLT as avidly as 18F-FDG (47). However, tumor delineation by 18F-FLT PET appears to be superior to that by 18F-FDG PET in certain viscera and anatomic regions, in which the physiologic (background) 18F-FLT uptake level is much lower than that of 18F-FDG; these regions include the brain, mediastinum (including the heart), and intestines (intestinal 18F-FDG concentrations are highly variable, ranging from nil to intense) (48,49). Bone marrow 18F-FLT uptake is normally prominent, hampering the detection of osseous metastases; hence, 18F-FDG PET may be superior to 18F-FLT PET for evaluating the skeleton (49). 18F-FDG PET evaluation of the skeleton after treatment is also often obscured by a diffuse prominence of bone marrow 18F-FDG uptake induced by systemic chemotherapy or other endogenous or exogenous marrow stimuli (e.g., erythropoietic stimulants).
In a recent study, methods for measuring 18F-FLT retention in patients with non–small cell lung cancer (NSCLC) were evaluated to assess measurement reproducibility (50). Nine patients with NSCLC that was not treated or that had progressed after previous therapy were imaged twice with 18F-FLT within 2–7 d. 18F-FLT imaging results for patients with NSCLC were reproducible, with a worst-case mean standardized uptake value (SUVmean) error of 21% when a short imaging time was used. However, reliance on a visual analysis or static measurement of 18F-FLT is often problematic because transport and retention cannot be differentiated; therefore, several groups have compared full 18F-FLT kinetic data analysis and SUV measurements (51–54).
In a pilot study, the precision of 18F-FLT PET in quantifying therapy-induced reductions in cancer cell populations was examined (55). 18F-FLT uptake in cancerous rectal tumors decreased after chemoradiation, but the observed decrease (during and 2 wk after therapy) did not differ between tumors with less than and tumors with greater than 10% residual viable cancer cells; differences in the percentages of residual viable cancer cells have prognostic implications (56).
Response Prediction: Pretreatment Scanning Versus Posttreatment Scanning
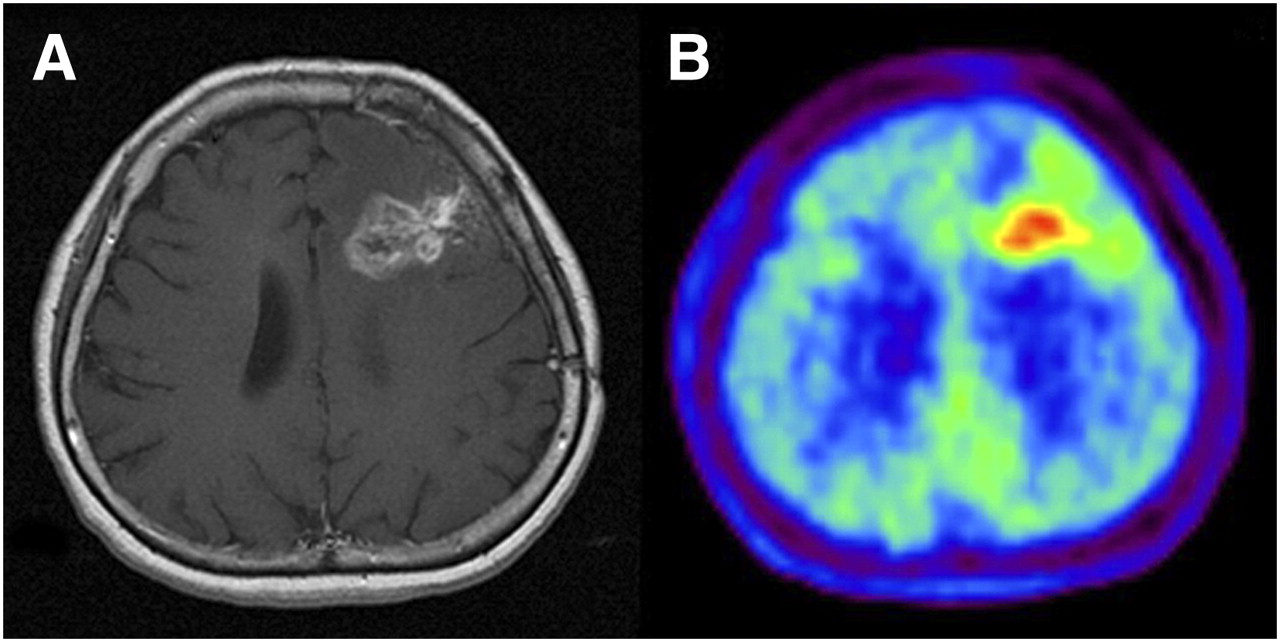
In an 18F-FLT PET clinical trial of patients with recurrent malignant glioma (Fig. 2), Chen et al. (57) found that changes in tumor 18F-FLT uptake induced by 1–2 wk of bevacizumab and irinotecan therapy were predictive of overall survival but that baseline tumor 18F-FLT uptake was not; that is, a therapy-induced decrease in tumor 18F-FLT uptake identified patients who survived longer.

Newly diagnosed glioblastoma. (A) MRI (contrast-enhanced T1-weighted image) shows large area of contrast enhancement in right frontal lobe. (B and C) Both 18F-FDG PET (B) and 18F-FLT PET (C) show increased uptake in same area. (Reprinted with permission of (189).)
Herrmann et al. (58) measured changes in tumor 18F-FLT uptake in patients with lymphoma (mostly diffuse large B-cell histology). Patients underwent 18F-FLT PET before treatment and after treatment; posttreatment scanning was performed twice, according to 1 of 2 schedules: group 1, at days 7 and 40 after the initiation of cyclophosphamide–adriamycin–vincristine–prednisone chemotherapy, with or without rituximab immunotherapy; and group 2, 2 d after the initiation of rituximab therapy, with or without dexamethasone, and again 2 d after the initiation of cyclophosphamide–adriamycin–vincristine–prednisone chemotherapy. Of 21 patients with follow-up data, 1 demonstrated progressive disease; all others demonstrated a complete (n = 14) or partial (n = 6) response. All patients demonstrated a reduction in 18F-FLT uptake in lymphomatous disease. 18F-FLT uptake after chemotherapy differed significantly between complete and partial responders (average SUVs, 1.5 and 2.6, respectively; P = 0.009), whereas 18F-FLT uptake before therapy did not. Patients with progressive disease demonstrated the smallest SUV decrease, 39%; in comparison, the group mean ± SD was 68% ± 14%. Interestingly, in group 2, 18F-FLT uptake never decreased after rituximab therapy alone; rather, it decreased only after the subsequent chemotherapy, suggesting that rituximab had no antiproliferative effects at the time of imaging. Because of the heterogeneity of the treatment regimens and 18F-FLT PET schedules, it is difficult to draw statistically robust conclusions from the study.
Clinical Studies with 18F-FMAU
The first pilot study of 18F-FMAU in humans was conducted to determine its biodistribution and suitability for the imaging of DNA synthesis in tumors (59). Fourteen patients with diverse cancers (brain, prostate, colorectal, lung, and breast) underwent PET with 18F-FMAU. Tumors in the breasts, brain, lungs, and prostate were clearly visualized, with SUVs of 2.19, 1.28, 2.21, and 2.27–4.42, respectively. Unlike PET with 18F-FLT, PET with 18F-FMAU revealed low tracer uptake in normal bone marrow (SUVmean, 0.7), allowing the visualization of metastatic prostate cancer (SUV, 3.07); however, in the upper abdomen, visualization was limited by uptake in the liver and kidneys.
In preparation for clinical trials, the kinetics of 18F-FMAU were studied to determine the most appropriate and simplest approach for image acquisition and analysis (60). Ten patients with brain (n = 4) and prostate (n = 6) tumors were imaged with 18F-FMAU, and tracer kinetics were measured by compartmental modeling. The SUVmean and the maximum SUV on images obtained at 5–11 min correlated well with those on images obtained at 50–60 min. The quality of the images and the tissue kinetics after just 11 min of imaging demonstrated that 18F-FMAU PET is a useful tumor imaging option.
IMAGING OF HYPOXIA
Since the 1930s, hypoxia (oxygen concentrations of ≤1,000 ppm) has been recognized as an important determinant in the physiology of solid tumors. The onset of hypoxia in malignant tissues is associated with undesirable outcomes, and it is well established that hypoxia is an important determinant of the overall response of a tumor to conventional therapy. Hypoxia can result in an increase in tumor aggressiveness, a failure of local control, and an activation of transcription factors that support cell survival and migration. The metastatic potential of solid tumors is believed to be highly associated with the presence of hypoxia (61). In addition, tumor hypoxia is associated with increased tumor aggressiveness, manifested as higher rates of recurrence and metastasis and resistance to chemotherapy (62–64). Therefore, the imaging of tumor hypoxia could result in a significant improvement in the care of patients with cancer (65,66).
This review focuses on 60/62/64Cu-labeled diacetyl-bis(N4-methylthiosemicarbazone) (60/62/64Cu-ATSM) and 18F-fluoromisonidazole (18F-FMISO), which are currently the 2 leading PET agents for the imaging of hypoxia. However, other radiopharmaceuticals with the potential to measure hypoxia are in various stages of development (66); these include 18F- or 99mTc-labeled agents now being evaluated in animal models and patients with solid tumors (67–71).
Clinical Studies with Cu-ATSM
The evolution of Cu-ATSM and in vitro, in vivo, and clinical studies of this tracer have been exhaustively reviewed (72). As discussed in detail by Vavere and Lewis (72), the mechanism of retention of Cu-ATSM has been explored by several groups in the United States, Europe, and Japan (73–81). Simply stated, the reduction of Cu(II)-ATSM takes place in both normoxic and hypoxic cells, resulting in unstable Cu(I)-ATSM. This unstable species slowly dissociates; if completely dissociated (in hypoxic cells), it becomes irreversibly trapped; however, in the presence of oxygen (normoxic cells), Cu(I)-ATSM is reoxidized to Cu(II)-ATSM and diffuses from the cells.
The first report of the use of Cu-ATSM in humans was published in 2000 for patients with lung cancer (82), and now several single-center studies have shown that 60Cu-ATSM (Fig. 3A) accumulates avidly in hypoxic tissues (82–86). Clinical PET studies with 60Cu-ATSM have demonstrated an inverse relationship between the tumor uptake of this tracer and the response to therapy in patients with lung and rectal carcinomas and between the tumor uptake of this tracer and outcome in patients with cervical and rectal carcinomas (83–87).
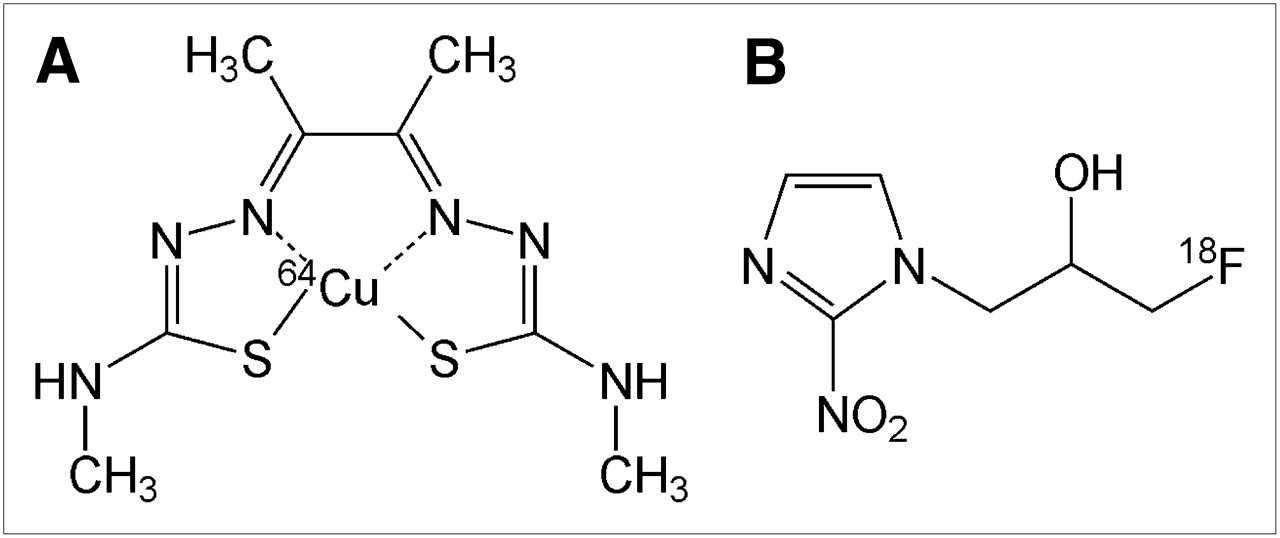
(A) 64Cu-ATSM. (B) 18F-FMISO.
To date, 38 patients with cancer of the uterine cervix have been imaged with 60Cu-ATSM PET (83). 18F-FDG PET clinical studies demonstrated markedly increased 18F-FDG uptake in the cervical cancers of all of these patients. 60Cu-ATSM showed high contrast levels between hypoxic and normoxic tissues by as little as 10–15 min after injection. The data were based on 30–60 min of summed data from the imaging session; the amount of tumor uptake of 60Cu-ATSM was variable. By use of a log-rank analysis of the previously reported data (87), it was found that a tumor-to-muscle (T/M) threshold of 3.5 was a statistically significant cutoff value for accurately differentiating patients whose cancer did not recur from those who developed a recurrence after completing therapy (Fig. 4). Progression-free survival and cause-specific survival were significantly better in patients with a T/M for 60Cu-ATSM of ≤3.5 (P = 0.006 and P = 0.04, respectively) (83,87).
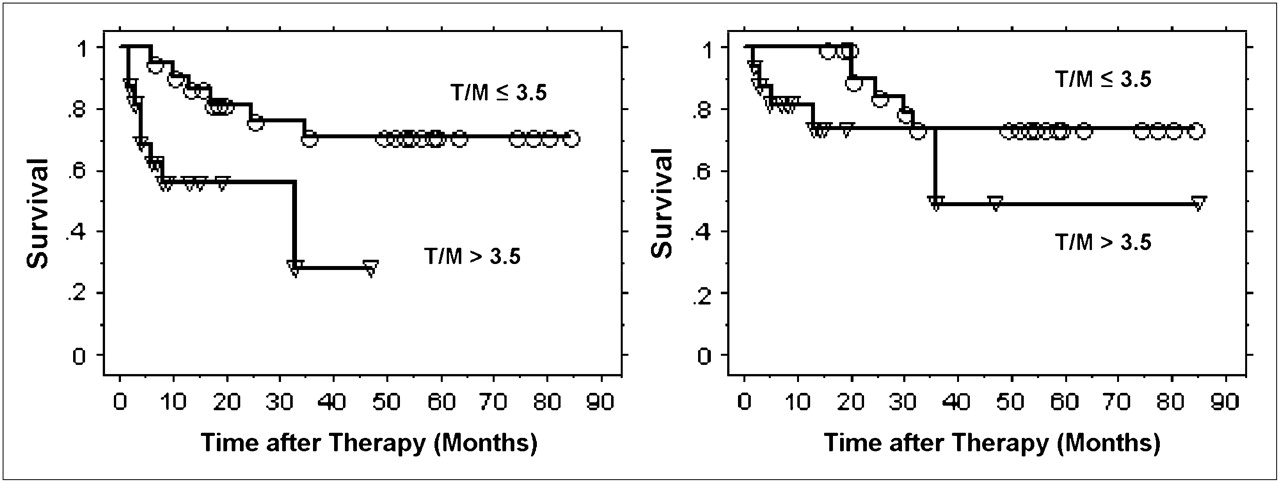
Progression-free survival (left) and cause-specific survival (right) determined from 60Cu-ATSM uptake by Kaplan–Meier method. ○ = event in patients with T/M of ≤3.5; ▿ = event in patients with T/M of >3.5. (Reprinted with permission of (83).)
In a study of 14 patients (men and women) with NSCLC, a semiquantitative analysis based on 30–60 min of summed data (the same as in the cervical cancer study) from the 60Cu-ATSM image was able to identify those likely to respond to therapy (84). In another pilot study, patients with locally invasive (T2–T4) primary or node-positive rectal cancer were imaged with 60Cu-ATSM PET; this imaging technique again demonstrated promise as a predictor of the tumor response to neoadjuvant chemoradiotherapy and survival (85).
The initial clinical studies of 60Cu-ATSM (83–85,87) for cancers were done under the auspices of the Radioactive Drug Research Committee. To expand the use of 64Cu-ATSM to other medical centers (to take advantage of the 12.7-h half-life of 64Cu), the first clinical study undertaken compared the quality of images obtained with 60Cu-ATSM (740 MBq) with the quality of images obtained with 64Cu-ATSM (925 MBq) (test–retest) for a cohort of 10 women with cervical carcinoma (Fig. 5) (86). The quality of images obtained with 64Cu-ATSM was found to be better than the quality of images obtained with 60Cu-ATSM because of less noise. In addition, the patterns and magnitudes of tumor uptake of 60Cu-ATSM and 64Cu-ATSM in PET studies separated by 1–9 d were found to be similar. Cu-ATSM has several well known advantages over other radiopharmaceuticals used for PET of hypoxia (72), including a simpler method for synthesis, faster clearance from normoxic tissue (allowing a short time between injection and imaging), and a simpler method for quantification. An additional advantage of 64Cu is the fact that the technology for its production and widespread delivery is commercialized (88).
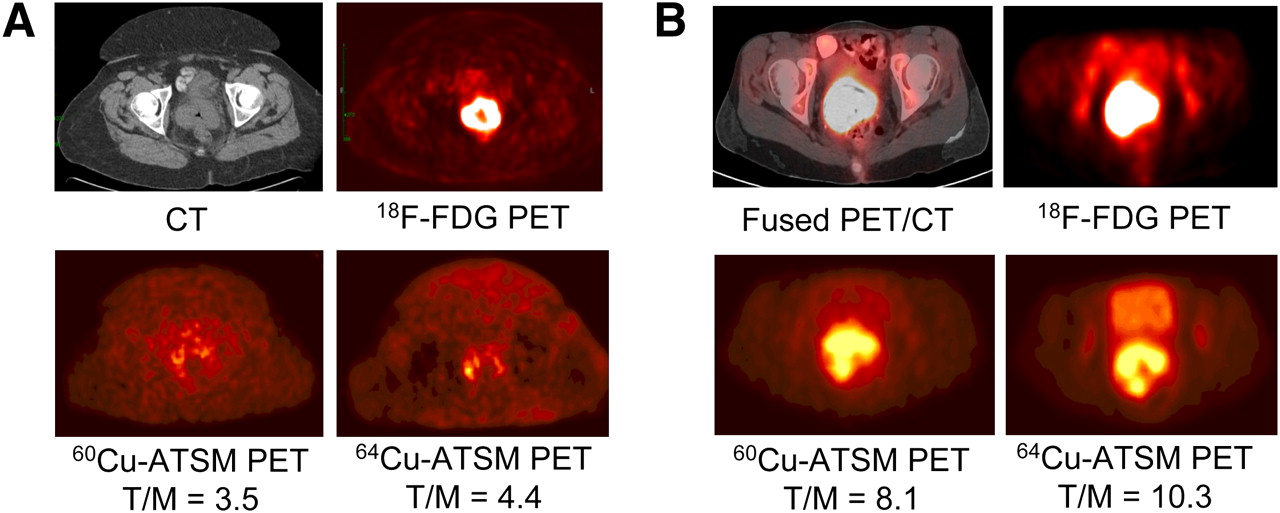
(A) Transaxial CT (top left) and 18F-FDG PET (top right) images of pelvis show intense 18F-FDG uptake within known cervical tumor at site of cervical mass seen on CT. Transaxial 30- to 60-min summed images of 60Cu-ATSM PET (bottom left) and 64Cu-ATSM PET (bottom right) of pelvis at same level demonstrate mildly increased uptake within known primary cervical tumor. There are similar patterns of 60Cu-ATSM and 64Cu-ATSM uptake within tumor. (B) Transaxial coregistered 18F-FDG PET/CT (top left) and 18F-FDG PET (top right) images of pelvis show intense 18F-FDG uptake within known cervical tumor at site of cervical mass seen on CT. Transaxial 30- to 60-min summed images of 60Cu-ATSM PET (bottom left) and 64Cu-ATSM PET (bottom right) of pelvis at same level demonstrate markedly increased uptake within known primary cervical tumor. There are similar patterns of 60Cu-ATSM and 64Cu-ATSM uptake within tumor. (Reprinted with permission of (86).)
18F-Fluoromisonidazole (18F-FMISO)
Investigations over the last 2 decades have led to quantitative, noninvasive methods for PET and SPECT of hypoxia (89,90), with much of the work focusing on labeled nitroimidazoles, a class of compounds whose metabolism and tissue retention are dependent on tissue oxygenation. After entering a viable cell, nitroimidazoles are reduced to RNO2 radicals, regardless of the intracellular oxygen concentration. In the presence of tissue oxygen, the radical is immediately reoxidized, and the original uncharged compound leaves the cell. If intracellular oxygen levels are low, however, the RNO2 radical is further reduced to a more reactive form, which binds covalently to intracellular macromolecules and remains within the cell. The most extensively studied radiolabeled nitroimidazole for in vivo PET is 18F-FMISO (Fig. 3B) (91–94), which is lipophilic and therefore diffuses readily through cell membranes. Tissue hypoxia has been defined as an 18F-FMISO tissue-to-blood (T/B) ratio of ≥1.2 by 2 h after radiotracer administration, as determined from biodistribution studies in both animals and humans (91). Also, for low-oxygen–dependent 18F-FMISO binding to occur, hypoxic regions must have pO2 levels below 2–3 mm Hg (∼2,600–4,000 ppm) to cause substantial retention (95).
Clinical Studies with 18F-FMISO
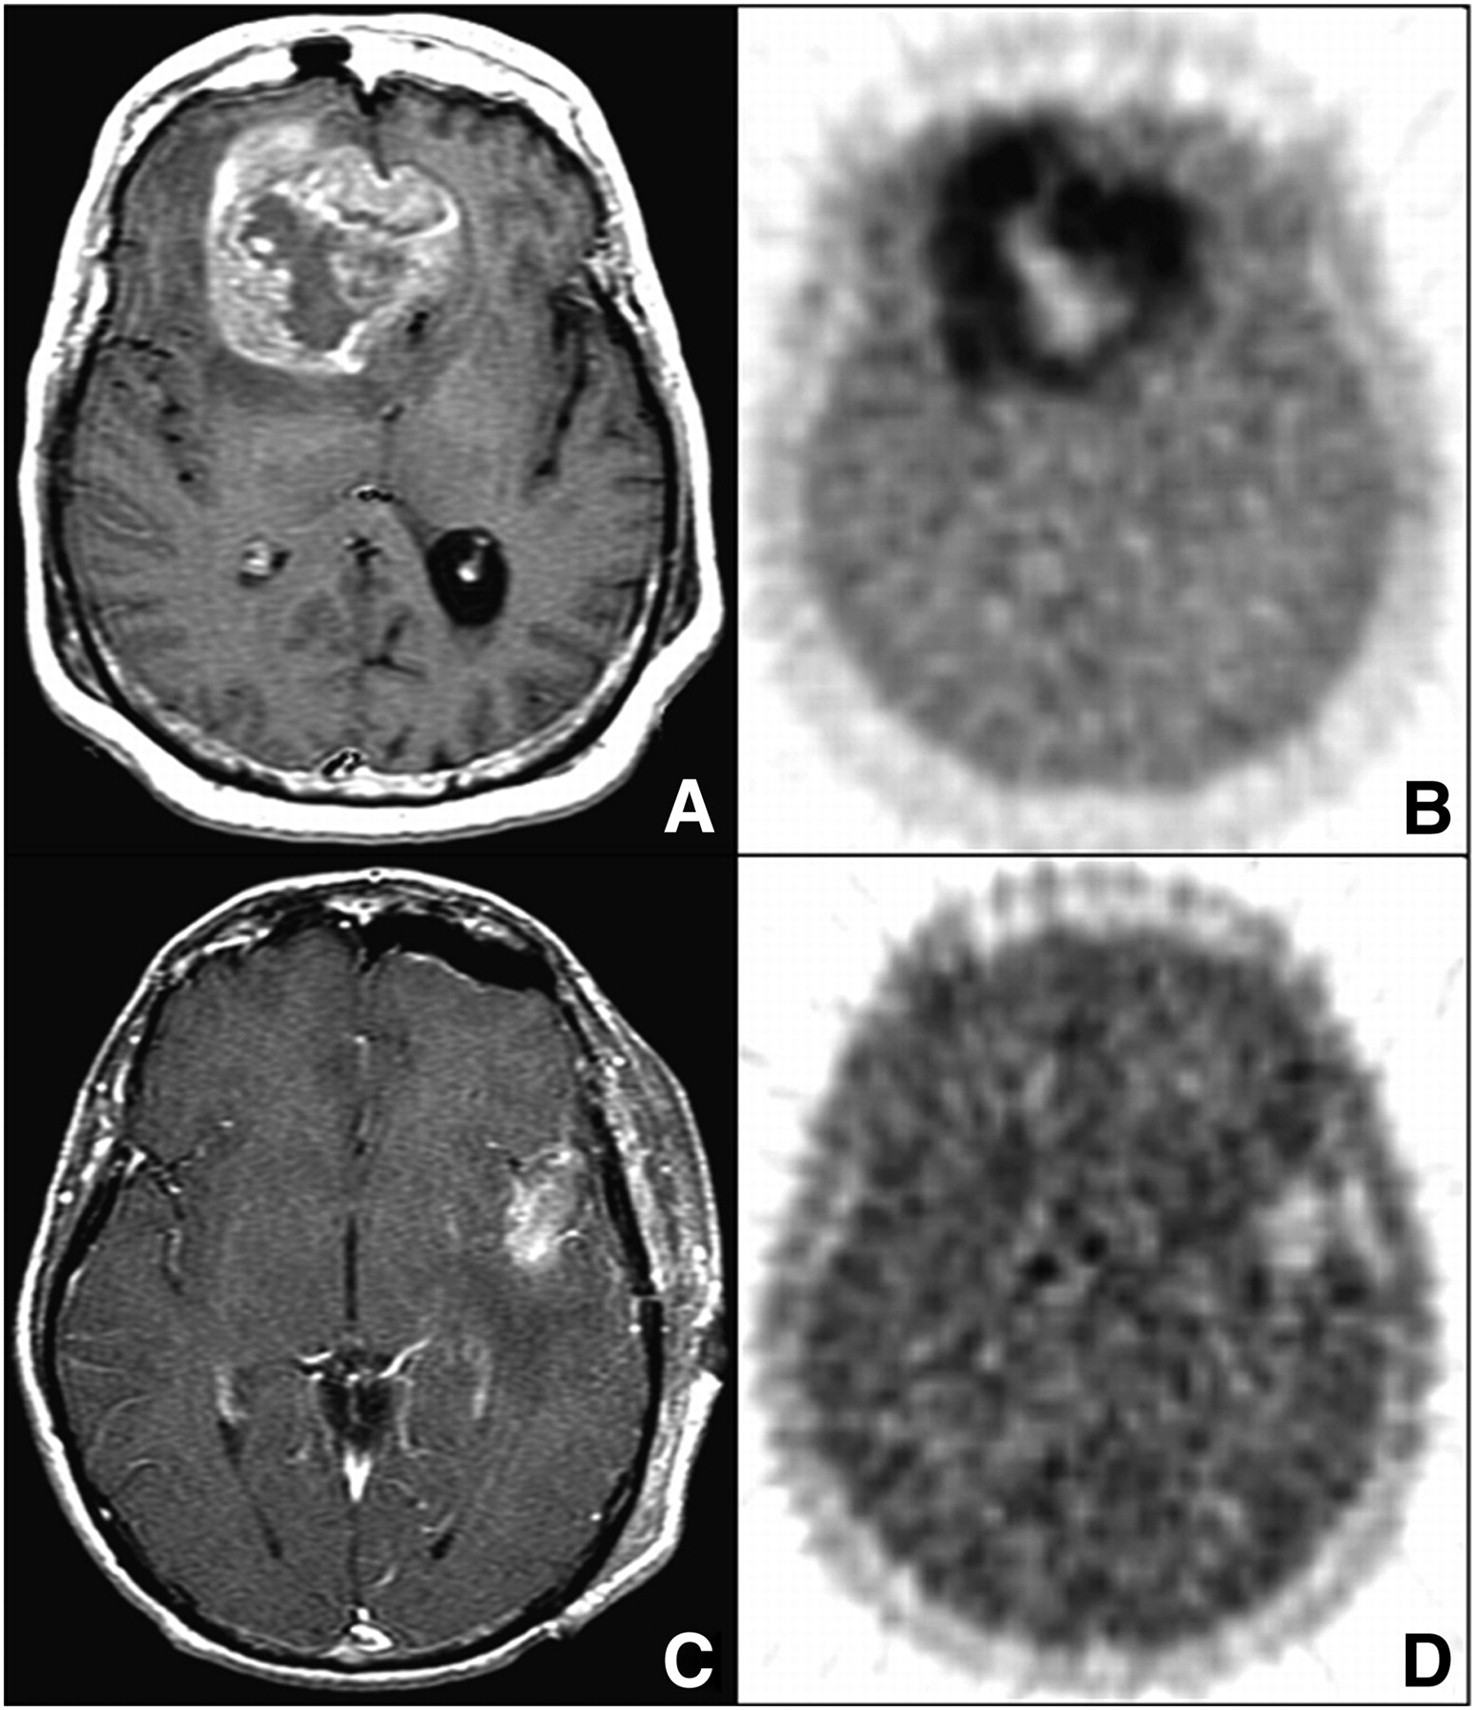
Rasey et al. used 18F-FMISO to study 37 cancer patients before therapy. Elevated 18F-FMISO T/B ratios (≥1.4) observed in tumors were used to estimate the fractional hypoxic volume (HV) (94). Hypoxia was found in the tumors of 36 of 37 subjects, and fractional HVs ranged from 0% to 94.7%. The extent of hypoxia varied markedly among tumors, and the distribution of hypoxia was heterogeneous in tumors at the same site or with the same histology. In more recent studies, Rajendran et al. showed that the results of 18F-FMISO PET before therapy were predictive of survival in patients with head and neck cancer (96), and Spence et al. showed that hypoxia in glioblastoma multiforme, as determined by 18F-FMISO PET, was strongly associated with poorer results for time to progression (TTP) and survival (97). In the study by Spence et al., the tumor HV and the maximum level of hypoxia in glioblastoma multiforme were measured by 18F-FMISO PET before radiotherapy to assess the impact of hypoxia on the TTP and survival (97). Spence et al. studied 22 patients before biopsy or between resection and initiation of radiotherapy; all patients underwent a 20-min emission scan 2 h after intravenous injection of ∼260 MBq of 18F-FMISO (Fig. 6) (97). T/B ratios above 1.2 were again used to define the tumor HV, and the maximum T/B (T/Bmax) ratios were determined from the pixel with the highest uptake. Kaplan–Meier plots demonstrated shorter TTP and survival in patients whose tumors had HVs or T/Bmax ratios greater than the median (P ≤ 0.001). Overall, both higher HVs and T/Bmax ratios in glioblastoma multiforme, as measured by 18F-FMISO PET, before radiotherapy were strongly associated with poorer results for TTP and survival.

(A and B) Bifrontal glioblastoma multiforme imaged after biopsy in 55-y-old woman. (A) MRI (gadolinium-enhanced T1-weighted image [T1Gd]) shows large, contrast-enhancing, irregular ring-shaped tumor with necrotic center. Non–contrast-enhanced volume was 20 cm3, T1Gd volume was 80 cm3, and T2-weighted volume was 167 cm3. (B) 18F-FMISO image through same plane. HV was 129 cm3, and T/Bmax ratio was 3.0. (C and D) Left temporal glioblastoma multiforme imaged after gross total resection in 53-y-old man. (C) MRI (T1Gd) shows only blood products and no residual contrast-positive disease. Non–contrast-enhanced volume was 1 cm3, T1Gd volume was 7 cm3, and T2-weighted volume was 37 cm3. (D) 18F-FMISO image through same plane. HV was 5.3 cm3, and T/Bmax ratio was 1.6. (Reprinted with permission of (97).)
The reproducibility of the intratumoral distribution of 18F-FMISO was recently examined more closely in 30 patients with head and neck cancer (98). All patients underwent an 18F-FDG study and then 2 18F-FMISO studies 3 d apart. As with the other clinical studies already described, the HVs were delineated according to a T/M ratio of ≥1.2. A voxel-by-voxel analysis of the 18F-FMISO distributions in the entire tumor volume showed a strong correlation in 71% of the head and neck tumors; restraining the correlation to putatively hypoxic zones reduced the number of tumors exhibiting a strong correlation to 46%. That study might have been the first in which variability in spatial uptake was shown to occur between repeat 18F-FMISO PET scans of patients. Of 13 patients, 6 had well-correlated intratumoral distributions of 18F-FMISO suggestive of chronic hypoxia; however, more work is required to identify the underlying causes of changes in intratumoral distribution before single-time-point 18F-FMISO PET images can be used as the basis of hypoxia-targeting intensity-modulated radiotherapy.
At present, there is no established method for identifying patients who will benefit from hypoxia-directed therapy. However, Rischin et al. recently demonstrated that 18F-FMISO PET is useful in directing hypoxia-specific treatment in patients with head and neck cancer; the uptake of 18F-FMISO predicted the greater effectiveness of tirapazamine therapy than of a non–tirapazamine-containing regimen (99). In that study, only patients with increased 18F-FMISO uptake benefited from the addition of tirapazamine to radiotherapy.
Many studies have demonstrated that an in vivo assessment of tumor hypoxia is possible with 18F-FMISO (93,97,100,101), but the unfavorable imaging characteristics of this compound have limited its use in clinical oncology. The main advantage of 18F-FMISO is that it is directly affected by tumor oxygenation, but the compound has 2 major limitations. One is the limited contrast ratio between hypoxic tumors and normal tissues (T/B ratio of >1.2), reflecting the poor tissue uptake of 18F-FMISO in vivo. The other is the slow cellular washout of this tracer; a delay of approximately 2 h after the injection of 18F-FMISO is needed to permit the clearance of this tracer from normal background tissues. Although this property delays imaging and results in low-counting-rate studies and images of limited quality (93,100,102), it has been demonstrated that meaningful data can be generated in clinical situations (93,94,97). Other nitroimidazole-based 18F-radiopharmaceuticals have been investigated (100); 18F-fluoroazomycin arabinoside, the most recently studied of these agents, shows uptake similar to that of 18F-FMISO but better blood clearance (70).
AMINO ACID TRACERS
PET with l-[methyl-11C]methionine (11C-MET) is the most popular amino acid imaging modality in oncology, with reports in over 250 basic scientific and clinical publications. A recent exhaustive review by Singhal et al. focused on the role of 11C-MET PET in the imaging of cerebral gliomas, the application of greatest interest (103). The biologic background of tumor imaging with methionine was discussed, with particular emphasis on cellular amino acid transport, amino acid use in the brain, the normal metabolism of methionine, and its alterations in cancer. Therefore, the mechanism of action of methionine is not the focus of this review. Singhal et al. also thoroughly discussed the roles of 11C-MET PET in the clinical management of cerebral gliomas: initial diagnosis, differentiation of tumor recurrence from radiation injury, grading, prognostication, delineation of tumor extent, biopsy planning, surgical resection and radiotherapy planning, and assessment of the response to therapy (103). Therefore, we provide only a few examples of the use of 11C-MET PET in the monitoring of therapy.
In 2006, Galldiks et al. monitored the metabolic effects of temozolomide (TMZ) chemotherapy for malignant gliomas by means of repeat 11C-MET PET scans (104). Fifteen patients with histologically proven malignant gliomas—oligoastrocytoma (n = 6, World Health Organization [WHO] grade III; and n = 1, WHO grade II), astrocytoma (n = 3, WHO grade III), glioblastoma (n = 3, WHO grade IV), and oligodendroglioma (n = 2, WHO grade III)—were treated with TMZ chemotherapy. 11C-MET PET studies were performed before and after the third cycle of TMZ chemotherapy in all patients and after the sixth cycle in 12 patients as well. The long-term outcome was assessed by calculating the TTP of the disease. As determined by 11C-MET PET, a decline in uptake during therapy corresponded to a stable clinical status; the median TTP was significantly longer in patients with decreasing 11C-MET uptake than in those with increasing 11C-MET uptake (23 vs. 3.5 mo; P = 0.01, as determined by log-rank test). Their data demonstrated that clinical stability, which is often achieved with TMZ chemotherapy of malignant gliomas, corresponded to a decline in or the stability of tumor amino acid metabolism and that a reduction in 11C-MET uptake during TMZ treatment predicted a more favorable clinical outcome.
Lee et al. undertook a study to determine whether increased uptake on 11C-MET PET scans obtained before radiation therapy and TMZ was associated with the site of subsequent failure in newly diagnosed glioblastoma multiforme (105). Patients with primary glioblastoma multiforme were treated in a prospective trial with dose-escalated radiation and concurrent TMZ. Automated image registration was used to assess whether areas of increased 11C-MET PET activity were fully encompassed by the high-dose region. Overall, 26 patients were evaluated, and 19 had appreciable (>1 cm3) volumes of increased 11C-MET PET activity before treatment. Overall, pretreatment 11C-MET PET appeared to identify areas at the highest risk for recurrence in patients with glioblastoma multiforme; therefore, it would be reasonable to test a strategy of incorporating 11C-MET PET into radiation treatment planning, particularly for identifying areas for conformal radiation boost.
During a course of radiotherapy, it is of paramount importance to differentiate recurrent brain tumors from radiation necrosis. In 2008, Terakawa et al. evaluated the diagnostic accuracy of 11C-MET PET for differentiating recurrent brain tumors from radiation necrosis in 77 patients who had been treated with radiotherapy after primary treatment for metastatic brain tumor (n = 51) or glioma (n = 26) (Fig. 7) (106). Pathologic examination provided a definitive diagnosis for recurrent brain tumors or a clinical course for radiation necrosis. It was elegantly demonstrated that the values for each measured index of 11C-MET PET tended to be higher for tumor recurrence than for radiation necrosis and that 11C-MET PET could provide quantitative values to help differentiate tumor recurrence from radiation necrosis. The findings indicated that quantitative analysis of 11C-MET PET data may be helpful in managing irradiated brain tumors.
Imaging of 49-y-old woman who had been previously treated for glioblastoma multiforme with tumor resection and conventional radiotherapy at dose of 60 Gy. (A) T1-weighted MR image obtained with contrast medium 13 mo after initial surgery showed contrast-enhanced lesion in left frontal lobe. (B) 11C-MET PET image showed obvious accumulation of tracer corresponding to abnormality on MR image. Mean lesion-to-normal tissue ratio was 1.70. Recurrent tumor was pathologically confirmed by second surgery. (Reprinted with permission of (106).)
The short half-life of 11C prevents the widespread use of 11C-MET PET for tumor imaging; awareness of this limitation has stimulated the development and evaluation of 18F-labeled amino acids. A few clinical studies have demonstrated the suitability of 18F-fluorophenylalanine (107) and l-2-18F-fluorotyrosine (108) for tumor imaging, but these investigations have not been expanded. In 1999, a nonmetabolizable analog of tyrosine, O-(2-18F-fluoroethyl)-l-tyrosine (18F-FET) (109), and a nonmetabolizable amino acid, 18F-labeled 1-amino-3-fluoro-cyclobutane carboxylic acid (18F-FACBC), were prepared in high yields (110,111). In initial clinical studies of brain tumors, 18F-FET PET compared favorably with 11C-MET PET (112,113). Although the study of 18F-FET PET focused mainly on brain tumors, 2 preliminary studies also investigated the use of 18F-FET PET for peripheral tumors (113) and head and neck cancer (114). Both studies stated that 18F-FET may not replace 18F-FDG for diagnostic PET of head and neck cancer but that it may be a helpful additional tool in selected patients because it may better differentiate tumor tissue from inflammatory tissue. The initial pilot human studies with 18F-FACBC are encouraging (110,115–117), and it will be interesting to learn how both 18F-FET and 18F-FACBC can be used for monitoring therapeutic outcomes.
HORMONE RECEPTOR IMAGING
Hormonal therapy has a major role in cancer care, particularly for prostate and breast cancer patients. Clinical trials of PET imaging of tumor expression of androgen receptors in prostate cancer patients are currently under way. Imaging of tumor expression of ERs by PET and of human epidermal growth factor receptor 2 (HER2) by PET and SPECT is also under way in trials predominantly involving breast cancer patients but also in studies involving uterine tumors (118,119) and meningiomas (120). In general, these trials have demonstrated the feasibility of quantifying receptor expression by scintigraphy, but only for PET of tumor ER expression has a significant amount of published data been gathered concerning the potential for evaluating tumor responsiveness to hormonal therapy.
The ability to noninvasively assess ER status in all tumors—particularly in metastatic disease, which poses the most danger to a patient—would clearly be advantageous clinically for several reasons. In breast cancer, the expression of ERs by tumor cells predicts mortality (121) and the efficacy of antiestrogen–ER treatments (122) and (nonhormonal) chemotherapy (123). Receptor expression in easily biopsied primary breast tumors can differ from that in less accessible metastatic tumors (124,125). Tumors that were initially ER positive can become ER negative in the setting of recurrence in as many as 36% of cases (126). Finally, the development of resistance to endocrine therapy in breast cancer often involves changes in ER and HER2 expression, a fact that provides a clear role for both ER imaging and HER2 imaging in monitoring therapeutic responses (see the excellent review by Zilli et al. (127)). The 2007 guidelines of the American Society of Clinical Oncology describe recommended clinical uses of ER and HER2 expression assays (128). Unlike standard tissue assays, imaging offers the ability to quantify ER expression and occupancy; this feature could be exploited to select and titrate drug dosages in individual patients with the goal of ER saturation.
16-α-18F-Fluoro-17-β-Estradiol (18F-FES)
Radiotracers for imaging ERs have been clinically tested for over 2 decades (129), and 18F-FES has emerged as the leading contender (Fig. 8A). After intravenous injection, blood levels of circulating radioactivity achieve stability quickly, in ∼20–30 min (130). Like estradiol, circulating 18F-FES is protein bound to albumin or sex steroid–binding protein (SSBP; also known as sex hormone–binding globulin) (131). The majority (∼80%) of circulating radioactivity consists of 18F-FES metabolites (which do not bind to protein) (131) from 30 to 60 min (120,131). Therefore, attempts to quantify tissue concentrations of ERs in tumors must use pharmacokinetic models that account for 18F-FES protein binding and metabolites (120,131). Still, clinical studies have demonstrated that semiquantitative PET measurements of 18F-FES concentrations in tumors show fair correlations with ER concentrations measured ex vivo by conventional immunohistochemistry (132) or ligand-binding assays (133,134); quantitative analyses involving prolonged, dynamic PET may not offer significant additional information beyond that offered by simpler, static PET (120).
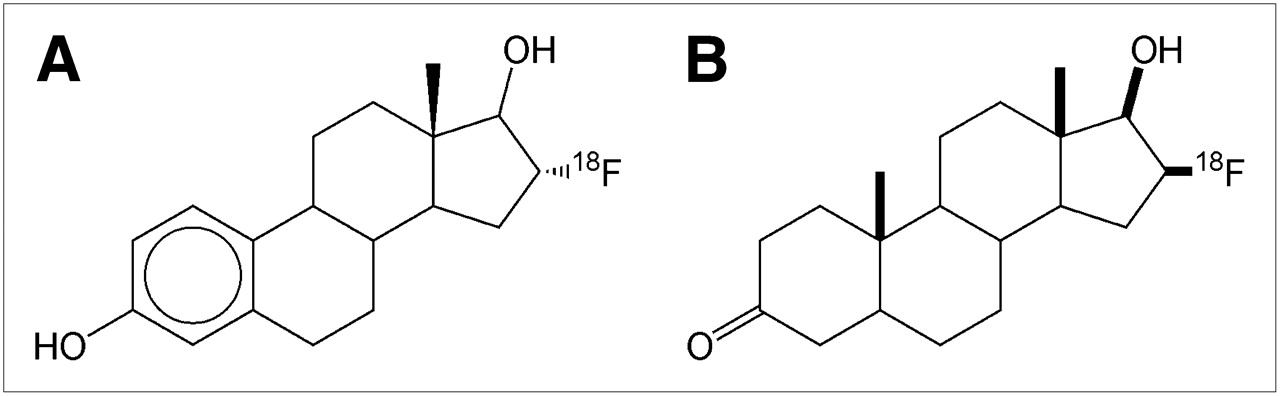
(A) 18F-FES. (B) 18F-FDHT.
When considering the strength of reported histologic correlations, readers should remember that the accuracy or reproducibility of ex vivo ER assays is imperfect (120,135). Therefore, it is perhaps more proper to state that 18F-FES visualizes available ERs. In rodents, endogenous estradiol has a 10-fold-higher affinity than 18F-FES for sex steroid–binding protein and a higher affinity for ERs (136–138). High blood levels of exogenous estradiol are able to displace 18F-FES from tumor receptors completely (139); to what extent endogenous estradiol levels affect tumor 18F-FES uptake has not yet been reported. Similarly, estradiol displacement of 18F-FES from binding to SSBP may affect an important component of tumor 18F-FES uptake because steroid delivery to cells involves receptor-mediated transport of steroid bound to SSBP (131). This consideration is important with regard to the study of Dehdashti et al., who correlated pretreatment tumor 18F-FES uptake with the response to aromatase inhibitors (n = 40) or fulvestrant (n = 11) (140). Like tamoxifen, fulvestrant binds ERs, preventing estradiol binding. Aromatase inhibitors (e.g., anastrazole, exemestane, and letrozole) block the enzyme aromatase in nonovarian tissues; aromatase catalyzes estrogen production.
Clinical Studies with 18F-FES
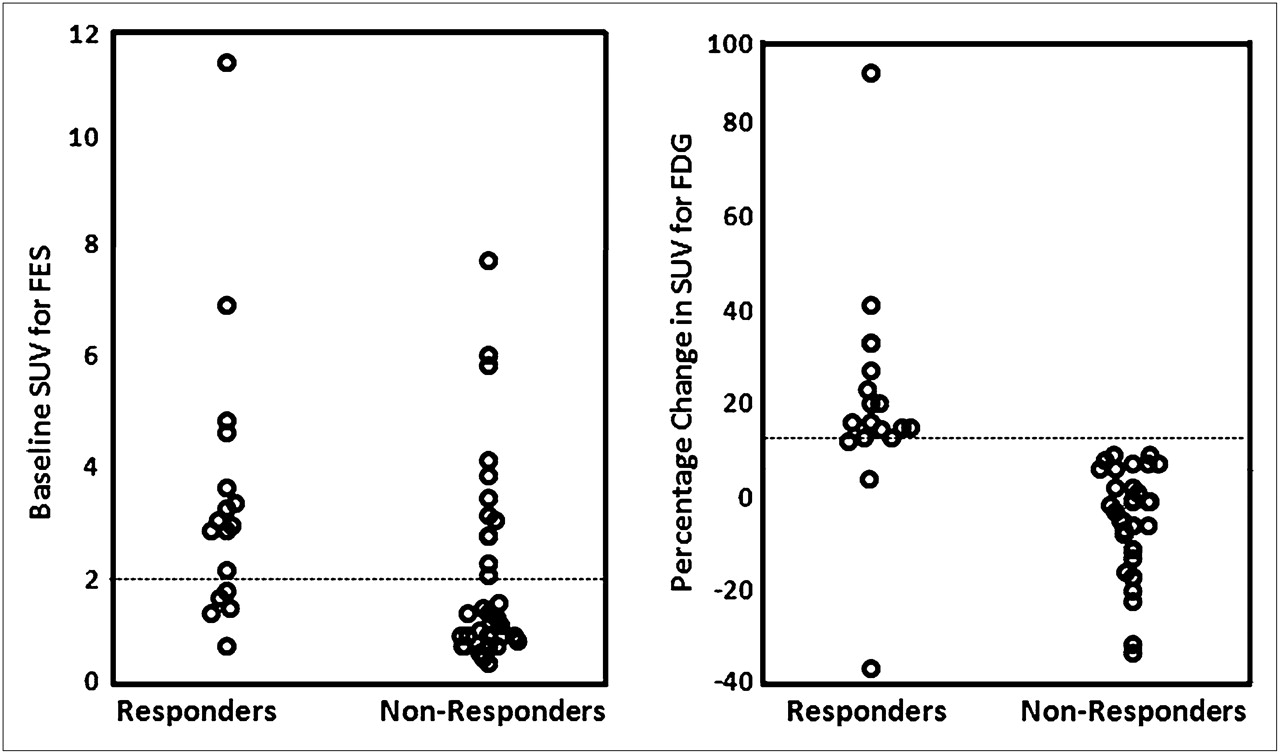
Several clinical studies have examined the prognostic significance of tumor 18F-FES concentrations by use of semiquantitative PET SUV scores in breast cancer patients (140–145). Low levels of tissue 18F-FES avidity (e.g., tumor maximum SUVs of <1–2) (120,133,140,141,144) have been considered negative for ER expression, that is, negative for the expression of ERα, which is the specific target of conventional ER immunohistochemistry (127). The average pretherapy tumor 18F-FES SUV scores for responders and nonresponders, as groups, were sufficiently different to achieve statistical significance in these studies, but the magnitude of the average difference was not great (140,143). Pretreatment tumor uptake values at the high and low ends of the range of SUV scores had clear implications: very high tumor SUVs identified disease that would respond, and very low SUVs predicted nonresponsive disease (140,143). However, the middle region of the range of SUV scores was fairly broad and had less predictive value. The considerable overlap of responsive and nonresponsive tumor SUV scores is illustrated, for example, in the study of Dehdashti et al., in which nonresponders had a pretherapy SUVmean score of 2.1 ± 1.8 and responders had a pretherapy SUVmean score of 3.5 ± 2.5 (Fig. 9) (140). That study showed that the likelihood of a tumor response increased with each unit increase in the tumor 18F-FES SUV score (140).

Baseline tumor 18F-FES (left) and percentage change in tumor 18F-FDG (right) uptake after estradiol challenge in patients who responded and patients who did not respond to endocrine therapy. (Reprinted with permission of (140).)
Have Pretreatment Threshold SUV Scores Been Suggested for Accurate Discrimination of Responses to Endocrine Therapy?
The appropriate threshold likely varies, depending on the specific therapeutic regimen used as well as clinical and histologic variables other than ER status (140). Dehdashti et al., studying postmenopausal ER-positive breast cancer patients, prospectively validated a tumor SUV score of ≥2.0 as offering optimal accuracy in predicting the response to aromatase inhibitors (n = 40) or fulvestrant (n = 11), with a sensitivity of 70% and a specificity of 64% for predicting a favorable response (140). In that study, most patients had previous endocrine therapy, including tamoxifen and aromatase inhibitors; the authors did not specify what time interval separated the “pretherapy” 18F-FES PET scan and the last endocrine therapy. Hence, it is unclear whether drugs with long clearance times (e.g., 4–6 wk for tamoxifen) might still have been in the patients' blood circulation at the time of the pretherapy 18F-FES PET scan; if so, tumor 18F-FES uptake could have been altered, confusing or weakening correlations with responses to subsequent therapy. Dehdashti et al. noted that they found stronger correlations between pretherapy tumor 18F-FES uptake and responses to therapy in a previous study involving a hormone-naive population (140).
Because antiestrogen therapy can be potently efficacious and its toxicity profile is relatively benign compared with those of chemotherapeutic alternatives (122), it may be especially important to determine an SUV threshold that is highly sensitive, identifying all patients with a potential to benefit from an antiestrogen–ER regimen, even if the specificity is poor. A tumor SUV score of less than 1.0 appears to be a highly sensitive threshold for identifying patients who will not benefit from antiestrogen–ER therapy (140,142).
Do Therapy-Induced Changes in Tumor 18F-FES SUV Scores Predict Responses?
Mortimer et al. examined this question, comparing tumor 18F-FES SUV scores before treatment and 7–10 d into tamoxifen therapy (143). Tamoxifen and its metabolites bind to ERs, preventing estrogen (and 18F-FES) binding to cancer cells. As in the later study of Dehdashti et al. (140), Mortimer et al. (143) found that the nonresponsive group had a relatively low pretherapy tumor SUV score (1.8 ± 1.4) compared with the responsive group (4.3 ± 2.4) (P = 0.0007). The responders demonstrated a greater decrease in SUVs in response to tamoxifen than did the nonresponders: −55% ± 14% versus −19% ± 17%, respectively (P = 0.0003). Was this decrease in tumor 18F-FES concentrations attributable to tamoxifen occupancy of ERs or induced downregulation of ERs, or had tumor cells begun dying after 7–10 d of treatment, so that fewer total ERs were present inside tumors? Preclinical research has suggested that significant tamoxifen-induced tumor apoptosis occurs later, ∼3–4 wk after treatment begins (146). Research has indicated that tamoxifen induces an acute downregulation of ER availability (147,148). Although it takes 3–5 wk to achieve stable serum levels of tamoxifen (149,150), serial 18F-FES PET could be used to titrate tamoxifen dosages in individual patients toward tumor saturation in the hope of improving responses while avoiding dosages that exceed the saturation point and may needlessly increase the risk of toxicity. Animal studies have suggested the feasibility of tamoxifen titration by 18F-FES PET (139). Were an 18F-FES PET approach to be pursued, “loading” doses of tamoxifen could be used to achieve steady-state levels more rapidly (150) and to establish new, higher dosage levels; however, reducing dosage levels may require a 4- to 6-wk delay for 18F-FES PET reassessment, given the long half-life of tamoxifen (150).
Although these studies validate serial 18F-FES PET as an assay for predicting the response to endocrine therapy in a patient population, the significance of changes in 18F-FES SUV scores in individual patients remains nebulous for percentage changes in the intermediate range. No clinical reports have yet described the intrapatient reproducibility of 18F-FES SUV scores (e.g., by repeat pretherapy 18F-FES PET scans obtained on 2 consecutive days). Knowing the reproducibility of 18F-FES SUV scores would provide clinicians with a gauge for the precision of 18F-FES PET and for which changes can be attributed to mere test variability (i.e., artifacts).
Finally, because the clinical emergence of tumor resistance to antiestrogen–ER therapy appears to involve the downregulation of ER expression and the upregulation of HER2 expression (151), a role for HER2 imaging is suggested. Detection of the upregulation of tumor HER2 expression by imaging may indicate the emergence of a resistance phenotype. Inhibition of HER2 may restore sensitivity to antiestrogen–ER therapy (151).
16β-18F-Fluoro-5α-Dihydrotestosterone (18F-FDHT)
18F-FDHT (Fig. 8B) is an analog of 5α-dihydrotestosterone, the main prostatic form of androgen. Imaging of androgen receptor expression in prostate cancer has at least 2 potential roles in evaluating the response to therapy. First, focal ectopic expression of androgen receptors may be a more tumor-specific manifestation of prostate metastases than other commonly used imaging characteristics (e.g., osseous activity on bone scintigraphy, hyperattenuation on CT, and combinations of MRI signal patterns) and may allow better disease staging and therapeutic response assessment. Imaging of the therapeutic response for patients with metastatic prostate cancer is complicated by the predilection of prostate metastases for bone. Bone metastases are considered nonmeasurable by the standard international tumor response criteria (Response Evaluation Criteria in Solid Tumors [RECIST]) (152,153). Hence, for clinical trials evaluating the therapeutic response of metastatic disease that is predominantly osseous, several alternative response criteria have been created (154). Bone scintigraphy, CT, and serum prostate-specific antigen (PSA) studies all carry a risk of misdiagnosing a favorable tumor response as disease progression (155,156); for example, some prostate cancer bone metastases are invisible on bone scintigraphy and CT and become visible only after a response to treatment occurs (i.e., the flare response phenomenon, also known as pseudoprogression) (156). MRI has not been shown to have reliable parameters that can differentiate tumor response to therapy from resistance. Second, monitoring tumor androgen metabolism clinically may provide insight into the emergence of resistant prostate cancer; although virtually all prostate cancer responds to androgen withdrawal initially, the disease often reemerges in an androgen-independent state (157).
Clinical Studies with 18F-FDHT
Larson et al. (158) described the pharmacokinetics and biodistribution of 18F-FDHT in castrate prostate cancer patients with progressive disease (Fig. 10). On entering the bloodstream, 18F-FDHT binds almost instantly to plasma proteins. By 10 min after intravenous injection, the majority of 18F-FDHT has been converted to radiolabeled metabolites, found protein-bound in the circulation. 18F-FDHT itself is extensively bound to SSBP (or sex hormone–binding globulin) (159,160), and it is believed that this protein assists in the cellular uptake of steroids (131). In the study of Larson et al. (158), tumor 18F-FDHT uptake was rapid, with prolonged retention; this activity provided good visualization of bony and soft-tissue tumor deposits, including a biopsy-confirmed, androgen receptor–positive prostate bed recurrence. The lead author of that article reports that ongoing clinical research has shown frequent discordance between 18F-FDG uptake and 18F-FDHT uptake in tumors (Steven M. Larson, oral communication, 2009). The biologic and clinical significance of this discordance has not yet been determined; the observation invites speculation that these imaging phenotypes represent tumors with different behaviors and hormone responsiveness characteristics (161–164).

18F-FDHT (A) and 18F-FDG (B) scans displayed in maximum-intensity-projection format. This figure demonstrates the contrasting metabolism of the 2 tracers in a patient with metastatic prostate cancer. (Reprinted with permission of (158).)
The preliminary clinical data of Larson et al. seem to support the notion suggested by preclinical research (159,160) that 18F-FDHT PET could be used to tailor the dosage and schedule of exogenous testosterone for individual patients to maintain the saturation of tumor androgen receptors. This idea was supported by the results of a larger response study by Dehdashti et al. (165), in which 18F-FDHT uptake was compared before and after treatment with flutamide, an androgen receptor antagonist; 18F-FDHT uptake decreased significantly, consistent with various degrees of tumor androgen receptor saturation. That same study revealed an association between high PSA levels and positive 18F-FDHT scan results (P = 0.006) (165). What remains to be reported is whether various degrees of target saturation correlate with the tumor response. If greater saturation were found to correlate with a better response, then the argument for pursuing an 18F-FDHT–based dose titration trial with an androgen receptor blocker would be compelling.
FUTURE ADVANCES
11C-Labeled Therapeutic Drugs
The clinical use of 11C-labeled PET tracers for clinical oncologic imaging is increasing significantly. It is conceivable that 11C will also be incorporated into therapeutic drugs now under development. Such combinations will allow noninvasive direct monitoring of the effectiveness of these agents and will lead to a true understanding of their mechanisms. Moreover, they will allow monitoring of the effectiveness of a given formulation for the delivery of an agent. As a result, it will be possible to obtain a substantially more detailed understanding of the biology of a tumor in a given patient.
11C-Choline PET
Given that the upregulation of choline kinase is often associated with cancer, a strong rationale exists for using 11C-choline in oncology. 11C-choline has been reported to be a new agent for PET of brain tumors and other cancers (166–168). In particular, 11C-choline PET has been shown to provide clear images of the pelvic region and of prostate carcinoma and pelvic lymph node metastasis (169–174). It has also been shown to have sensitivity and accuracy for the preoperative staging of prostate cancer in pelvic lymph nodes (172,175). In 2003, de Jong et al. presented data on the use of 11C-choline PET for evaluation after the treatment of localized prostate cancer; the site of recurrence was detected correctly in 78% of the patients after external-beam radiotherapy and in 38% of the patients after radical prostatectomy (176). Given the data already collected on the use of 11C-choline (∼90 publications), further study of the use of this agent for monitoring therapy is warranted.
1-11C-Acetate PET
1-11C-acetate has been extensively investigated as an imaging agent for prostate cancer and its metastases (177–181). The most recent work has demonstrated 1-11C-acetate to be useful for detecting recurrent prostate cancer at PSA relapse in many cases (177,179,180,182). Direct comparisons have shown that 1-11C-acetate PET has greater sensitivity for detection than does 18F-FDG PET (178,183). Recent findings of Vavere et al. suggested that 1-11C-acetate uptake is related to fatty acid synthase (FAS) expression in tumors (184). These findings suggest the possibility of using 1-11C-acetate as a biomarker for more effective treatments for prostate cancer patients and possibly others, because FAS expression has been shown to be linked to a poor prognosis in other cancers as well. Moreover, because FAS inhibitors are being developed as antitumor agents, this technology also provides a unique opportunity to monitor the effectiveness and the validation of new anticancer FAS inhibitors for translation into a clinical setting.
Angiogenesis (Integrins)
Cancer specialists are calling for clinical assays of tumor blood vessels that can guide the use of vascular targeted therapies by optimizing dose selection and identifying drug resistance, such as that which occurs with angiogenesis inhibitors. For PET of angiogenesis, 2 imaging agents have entered clinical trials: 18F-galacto-RGD (185,186) and 18F-AH111 (187). Both tracers target the integrin molecule αvβ3 and have various affinities for other α- and β-heterodimers. To date, no clinical data have been published regarding the use of these tracers in evaluating the tumor response to therapy.
CONCLUSION
This article has discussed progress in clinical PET research with new PET tracers for evaluating the tumor response at the level of biomolecular therapeutic targets and examining therapeutically relevant phenotypes of cellular biology and the tumor tissue microenvironment. Building on the success of 18F-FDG PET and a worldwide PET infrastructure, both firmly established and continually growing, a revolution is occurring in the detection of the tumor response to therapy. In the coming decade, cancer care specialists can look forward to a wave of noninvasive molecular probes other than 18F-FDG for predicting and characterizing the tumor response to therapy in new ways that are more specific to the therapeutic regimens used. These clinical PET tools should improve therapeutic planning and response assessment and should lead to improved patient outcomes.
Acknowledgments
Financial assistance for this study was provided by an R25T Molecular Imaging Grant from the National Cancer Institute (R25-CA96945). The authors acknowledge Ada Muellner for careful editing of the article.
Footnotes
-
COPYRIGHT © 2009 by the Society of Nuclear Medicine, Inc.
References
- 1.↵
- 2.
- 3.↵
- 4.↵
- 5.
- 6.
- 7.
- 8.
- 9.
- 10.
- 11.↵
- 12.↵
- 13.↵
- 14.↵
- 15.↵
- 16.↵
- 17.↵
- 18.↵
- 19.↵
- 20.↵
- 21.↵
- 22.↵
- 23.↵
- 24.↵
- 25.↵
- 26.↵
- 27.↵
- 28.↵
- 29.↵
- 30.↵
- 31.↵
- 32.↵
- 33.↵
- 34.↵
- 35.
- 36.
- 37.
- 38.
- 39.
- 40.
- 41.
- 42.
- 43.
- 44.
- 45.
- 46.↵
- 47.↵
- 48.↵
- 49.↵
- 50.↵
- 51.↵
- 52.
- 53.
- 54.↵
- 55.↵
- 56.↵
- 57.↵
- 58.↵
- 59.↵
- 60.↵
- 61.↵
- 62.↵
- 63.
- 64.↵
- 65.↵
- 66.↵
- 67.↵
- 68.
- 69.
- 70.↵
- 71.↵
- 72.↵
- 73.↵
- 74.
- 75.
- 76.
- 77.
- 78.
- 79.
- 80.
- 81.↵
- 82.↵
- 83.↵
- 84.↵
- 85.↵
- 86.↵
- 87.↵
- 88.↵
- 89.↵
- 90.↵
- 91.↵
- 92.
- 93.↵
- 94.↵
- 95.↵
- 96.↵
- 97.↵
- 98.↵
- 99.↵
- 100.↵
- 101.↵
- 102.↵
- 103.↵
- 104.↵
- 105.↵
- 106.↵
- 107.↵
- 108.↵
- 109.↵
- 110.↵
- 111.↵
- 112.↵
- 113.↵
- 114.↵
- 115.↵
- 116.
- 117.↵
- 118.↵
- 119.↵
- 120.↵
- 121.↵
- 122.↵
- 123.↵
- 124.↵
- 125.↵
- 126.↵
- 127.↵
- 128.↵
- 129.↵
- 130.↵
- 131.↵
- 132.↵
- 133.↵
- 134.↵
- 135.↵
- 136.↵
- 137.
- 138.↵
- 139.↵
- 140.↵
- 141.↵
- 142.↵
- 143.↵
- 144.↵
- 145.↵
- 146.↵
- 147.↵
- 148.↵
- 149.↵
- 150.↵
- 151.↵
- 152.↵
- 153.↵
- 154.↵
- 155.↵
- 156.↵
- 157.↵
- 158.↵
- 159.↵
- 160.↵
- 161.↵
- 162.
- 163.
- 164.↵
- 165.↵
- 166.↵
- 167.
- 168.↵
- 169.↵
- 170.
- 171.
- 172.↵
- 173.
- 174.↵
- 175.↵
- 176.↵
- 177.↵
- 178.↵
- 179.↵
- 180.↵
- 181.↵
- 182.↵
- 183.↵
- 184.↵
- 185.↵
- 186.↵
- 187.↵
- 188.↵
- 189.↵
- Received for publication October 31, 2008.
- Accepted for publication February 16, 2009.


