

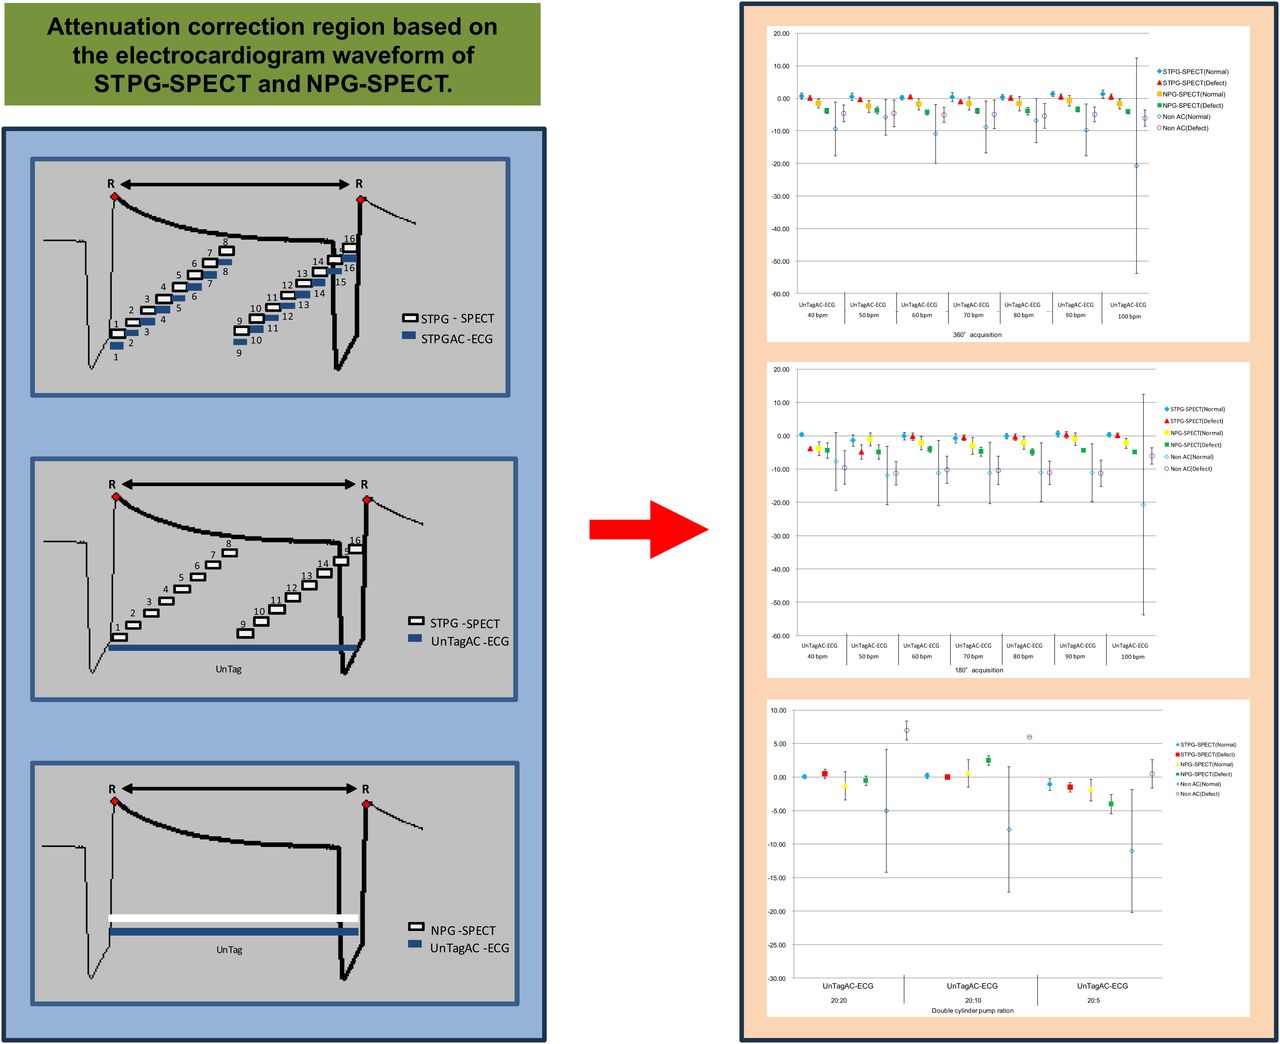
Visual Abstract

Abstract
In cardiac nuclear medicine examinations, absorption in the body is the main factor in the degradation of the image quality. The Chang and external source methods were used to correct for absorption in the body. However, fundamental studies on attenuation correction for electrocardiogram (ECG)-synchronized CT imaging have not been performed. Therefore, we developed and improved an ECG-synchronized cardiac dynamic phantom and investigated the synchronized time-phase–gated attenuation correction (STPGAC) method using ECG-synchronized SPECT and CT images of the same time phase. Methods: As a basic study, SPECT was performed using synchronized time-phase–gated (STPG) SPECT and non–phase-gated (NPG) SPECT. The attenuation-corrected images were, first, CT images with the same time phase as the ECG waveform of the gated SPECT acquisition (with CT images with the ECG waveform of the CT acquisition as the reference); second, CT images with asynchronous ECG; third, CT images of the 75% region; and fourth, CT images of the 40% region. Results: In the analysis of cardiac function in the phantom experiment, left ventricle ejection fraction (heart rate, 11.5%–13.4%; myocardial wall, 49.8%–55.7%) in the CT images was compared with that in the STPGAC method (heart rate, 11.5%–13.3%; myocardial wall, 49.6%–55.5%), which was closer in value to that of the STPGAC method. In the phantom polar map segment analyses, none of the images showed variability (F(10,10) < 0.5, P = 0.05). All images were correlated (r = 0.824–1.00). Conclusion: In this study, we investigated the STPGAC method using a SPECT/CT system. The STPGAC method showed similar values of cardiac function analysis to the CT images, suggesting that the STPGAC method accurately reconstructed the distribution of blood flow in the myocardial region. However, the target area for attenuation correction of the heart region was smaller than that of the whole body, and changing the gated SPECT conditions and attenuation-corrected images did not affect myocardial blood flow analysis.
- SPECT/CT system
- myocardial blood flow
- electrocardiography-synchronized CT imaging
- synchronized time-phase–gated SPECT
- synchronized time-phase–gated attenuation correction electrocardiogram
In nuclear cardiology examinations, several factors degrade the quality of SPECT images, including body absorption (attenuation), scattered radiation, and partial-volume effects due to low spatial resolution. Body absorption is the most common cause of image-quality degradation (1). The Chang method (uniform absorber correction method (2)) and external source method (nonuniform absorber correction method (3)) have been developed to correct for body absorption (attenuation correction methods). With advances in medical equipment, SPECT systems equipped with diagnostic CT systems (SPECT/CT systems) have become available, allowing attenuation correction of asynchronous electrocardiogram (ECG) CT imaging and synchronous ECG CT imaging (inhomogeneous absorber correction method). CT images acquired from ECG asynchronous CT imaging are used mainly for attenuation correction of the head and trunk regions (including the heart region) and fusion imaging. However, CT images acquired from ECG-synchronized CT imaging (CT images of the same phase as ECG-synchronized SPECT images) have not been used for attenuation correction. In addition, fundamental studies on attenuation correction for ECG synchronization have not yet been performed, because cardiac still phantoms (4–12) and 3-dimensionally printed myocardial phantoms (13–17) cannot be used to evaluate the dynamics of the cardiac region according to its morphology.
Therefore, we developed (18) and improved a synchronized time-phase cardiac dynamic phantom and investigated the synchronized time-phase–gated attenuation correction (STPGAC) method using ECG-synchronized SPECT and CT images of the same time phase.
MATERIALS AND METHODS
Outline of Cardiac Dynamic Phantom
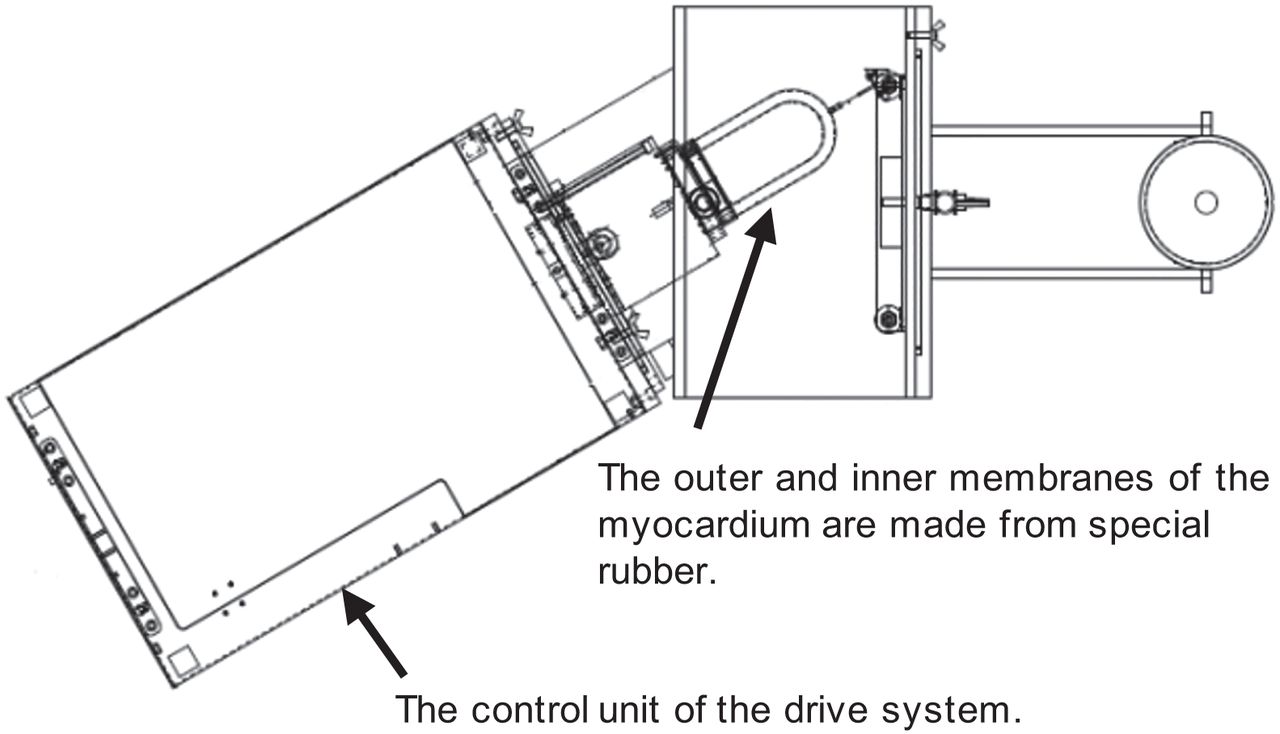
ECG-gated cardiac dynamic phantoms consist of a specialty type of rubber forming 2 myocardial layers: outer membrane and inner membrane. The movement of the heart is reproduced using a double cylinder pump. A stroke ratio (outer membrane to inner membrane) of the cylinder pump can change the volume of the cardiac chamber and myocardial layers and the range of movement of the myocardial wall. Outlets to add solutions (radioactive agent, contrast agent, etc.) into the cardiac chamber part and the myocardial layer region comprise a particular structure. The heart rate can be changed within the range of 40–120 bpm (Fig. 1).

Outline of ECG-synchronized dynamic cardiac phantom.
Synchronized Time-Phase–Gated Attenuation Correction Method
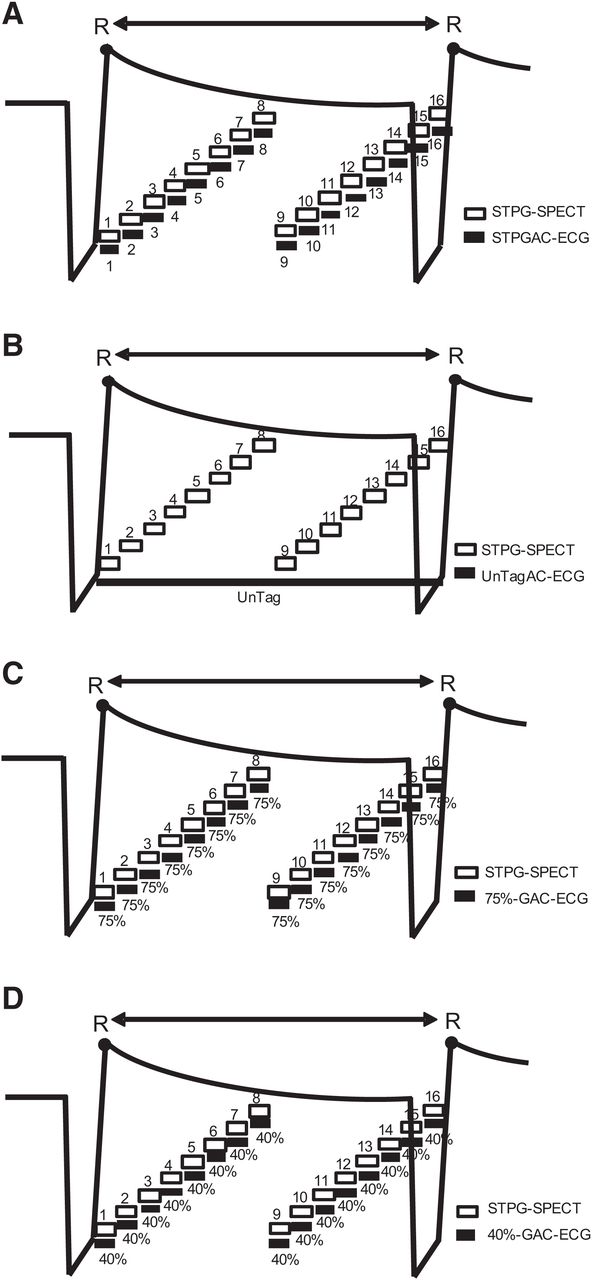
A STPGAC method was developed as a reference image for this study. The STPGAC method constructs a gated SPECT image and a CT image of the same time phase from the ECG waveform (1 heartbeat) output from the cardiac dynamic phantom and performs attenuation correction on the image corresponding to each heartbeat time phase (Fig. 2A). This method is considered ideal to avoid misregistration between the SPECT image of the myocardial region and the attenuation-corrected CT image.

Attenuation correction region based on ECG waveform of STPG SPECT: STPGAC ECG (A); UnTagAC ECG (B); 75% GAC ECG (C); 40% GAC ECG (D).
Setup of Cardiac Dynamic Phantom
An ECG-synchronized dynamic cardiac phantom was used (18). The heart region was made of special rubber with a double structure (outer and inner membranes of the myocardium), and regular and large sizes were used. In the regular rubber, the heart rate was set to 40, 50, 60, 70, 80, 90, and 100 bpm. The double cylinder pump ratio was set to 0:5 (myocardial layer to ventricle, myocardial region motion to small stroke). The phantom theoretic values of the myocardial region (range of motion, 0:5) were 140.4 mL for end diastole (ED), 119.9 mL for end systole (ES), and 14.6% for left ventricle ejection fraction (LVEF). For the large size rubber, the heart rate was set to 60 bpm. The double-cylinder pump ratio was set to 20:20 (myocardial region motion to large stroke), 20:10 (myocardial region motion to medium stroke), and 20:5 (myocardial region motion to small stroke). The theoretic phantom values of the myocardial region are 20:20 (ED, 556.9 mL; ES, 216.7 mL; LVEF, 61.1%), 20:10 (ED, 479.9 mL; ES, 216.7 mL; LVEF, 54.8%), and 20:5 (ED, 441.5 mL; ES, 216.7 mL; LVEF, 50.9%).
In addition, a defect (silicon, 20.0 × 20.0 × 10.0 mm) was placed between the inner and outer membrane of the myocardium (regular size rubber: anterior septum [segment 8], inferior septum [segment 9], inferior lateral wall [segment 11], anterior lateral wall [segment 12], septum [segment 14], lateral wall [segment 16]; large rubber: anterior wall [segment 7], inferior wall [segment 10]) (19). The myocardial layer was filled with a mixture of water and radiopharmaceutical (99mTc-O4, 1.057 MBq/mL), the ventricles with a mixture of water and contrast agent (iopamidol300 solution, 20 mL), and the trunk with water (24 L). In addition, since separation of the myocardial layer (technetium product) and the intraluminal layer (contrast agent) is necessary for image analysis, each layer was sealed.
Gated SPECT Acquisition and CT Imaging
A SPECT/CT system (Philips Precedence 16) was used for gated SPECT acquisition with an acquisition time of 30 s/step (360°, 64 steps; 180°, 32 steps), 16 R–R segments, a vertex general-purpose collimator, and a matrix size of 128 × 128, with a pixel size of 3.2 mm. Synchronized time-phase–gated (STPG) SPECT and non–phase-gated (NPG) SPECT were performed under these conditions. CT imaging conditions were set at a resolution of Ultra Fast (Philips), collimation of 16 × 1.5 mm, a slice thickness of 5.0 mm, a slice increment of 5.0 mm, a rotation time of 0.4 s, a pitch of 0.299, a field of view of 350 mm, tube voltage of 120 kV, a tube current-time of 300 mAs, and a matrix size of 512 × 512, with a pixel size of 0.75 mm.
Attenuation-Corrected Images
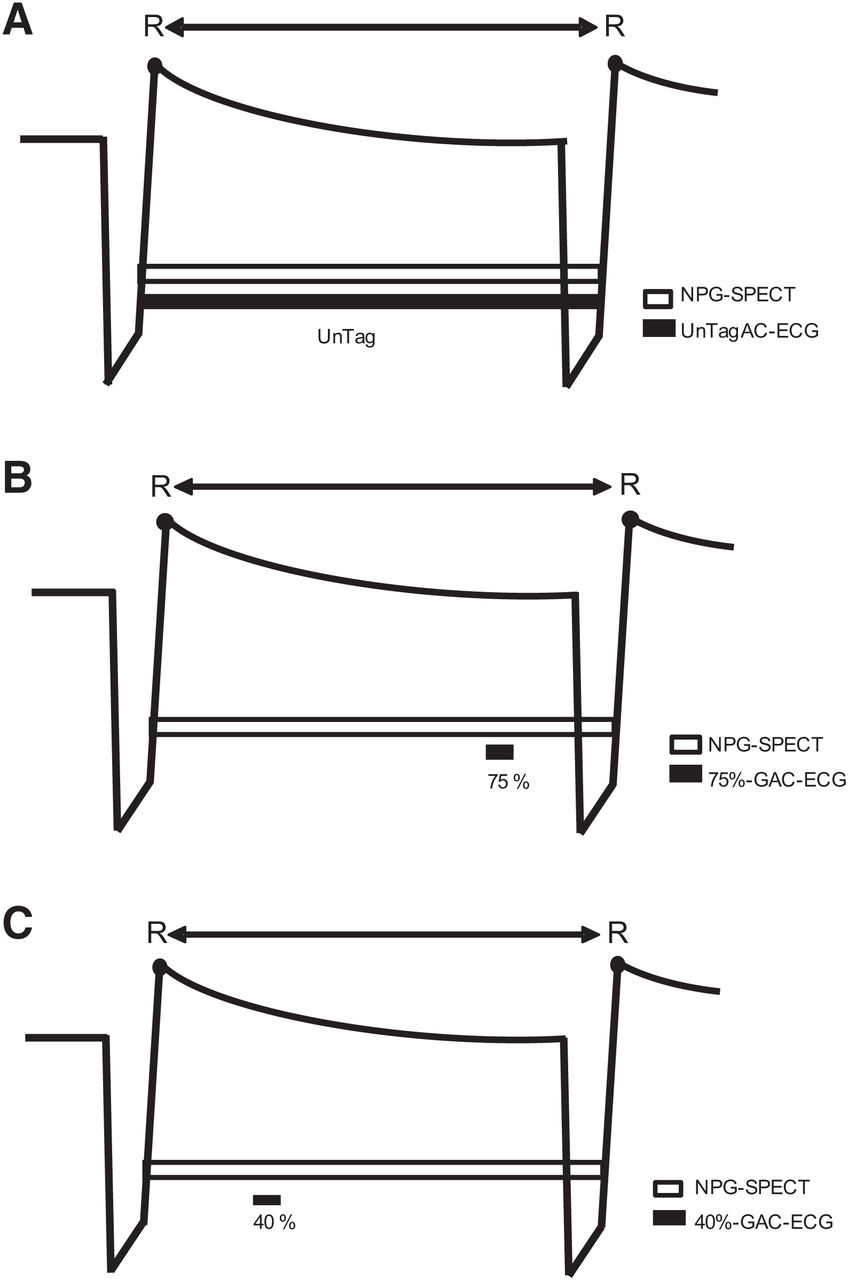
The attenuation-corrected images used in the phantom and clinical studies were, first, CT images of the same phase as the ECG waveform of the gated SPECT acquisition (STPGAC ECG; Fig. 2A; the ECG waveforms of the CT acquisition were used as a reference); second, CT images with asynchronous ECG (untagged attenuation correction [UnTagAC] ECG; Figs. 2B and 3A); third, CT images of the 75% region (75% gated attenuation correction [GAC] ECG; Figs. 2C and 3B); and fourth, CT images of the 40% region (40% GAC ECG; Figs. 2D and 3C). The 75% region is the end-diastolic image, and the 40% region is the end-systolic image.

Attenuation correction region based on ECG waveform of NPG SPECT: UnTagAC ECG (A); 75% GAC ECG (B); 40% GAC ECG (C).
Image Reconstruction Conditions for Gated SPECT
Intellispace Portal (Philips) was used for image analysis. The image reconstruction conditions were as follows: the Astonish method (Philips) with 3 iterations, 8 subsets, a Hanning preprocessing filter with a cutoff of 0.18 cycles/cm, and a ramp reconstruction filter. Attenuation correction used the CT method, and scatter correction used the effective source scatter estimation method (20).
Regarding the attenuation correction images, STPGAC ECG, UnTagAC ECG, 75% GAC ECG, and 40% GAC ECG were used for the STPG SPECT images (Fig. 2), and UnTagAC ECG, 75% GAC ECG, and 40% GAC ECG were used for the NPG SPECT images (Fig. 3). The STPGAC method images were used as the standard for this study (Fig. 2A). The NPG SPECT images were processed without attenuation correction.
Image Analysis
Images were evaluated using Intellispace Portal. The evaluation items were cardiac function analysis (ED volume [mL], ES volume [mL], and LVEF [%]) and polar map segment analysis of the normal and defect regions (difference in perfusion, perfusion [%], ED perfusion [%], ES perfusion, motion [mm], and thickening [%]). Statistical analysis was performed using the Statistical Package for Social Sciences software (IBM).
RESULTS
Heart Rate Variability
The results of the analysis of cardiac function and polar map segments at different heart rates are shown in Tables 1–4; Figures 4 and 5; and Supplemental Appendices 1–8 (supplemental materials are available at http://jnm.snmjournals.org).
Cardiac Function Analysis of Heart Rate Variability (360°)
Cardiac Function Analysis of Heart Rate Variability (180°)
Results of Polar Map Segment Analysis and Correlation Coefficient for 360° Acquisitions in Heart Rate Variability
Results of Polar Map Segment Analysis and Correlation Coefficient for 180° Acquisitions in Heart Rate Variability

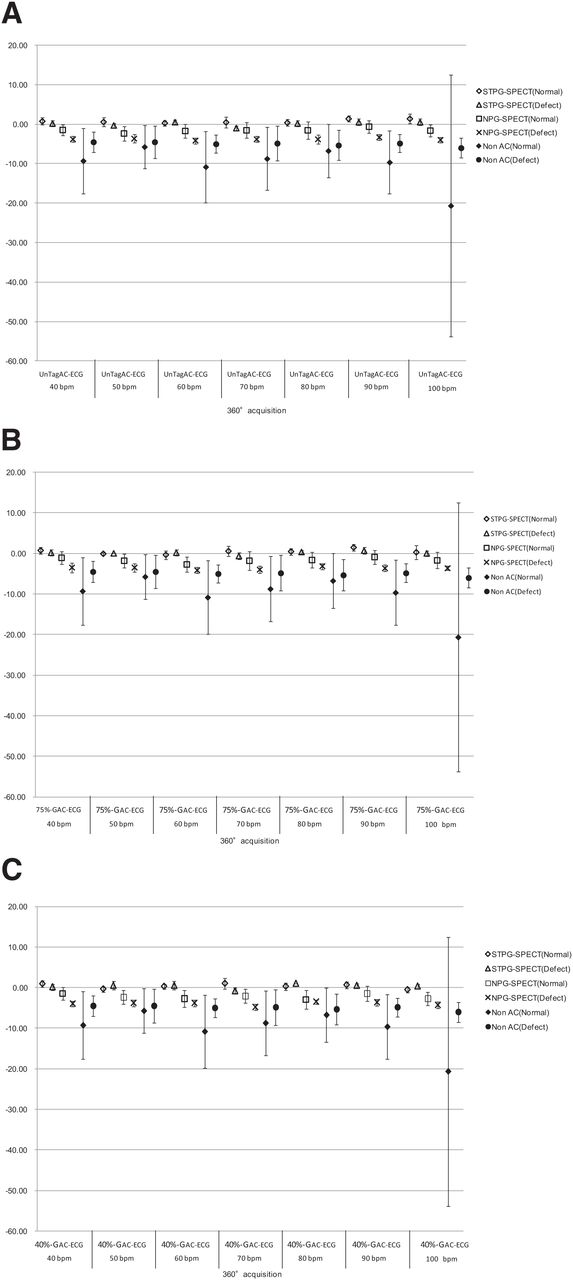
Difference in perfusion between normal and defect regions in heart rate variability of 360° acquisition: UnTagAC ECG (A); 75% GAC ECG (B); 40% GAC ECG (C).

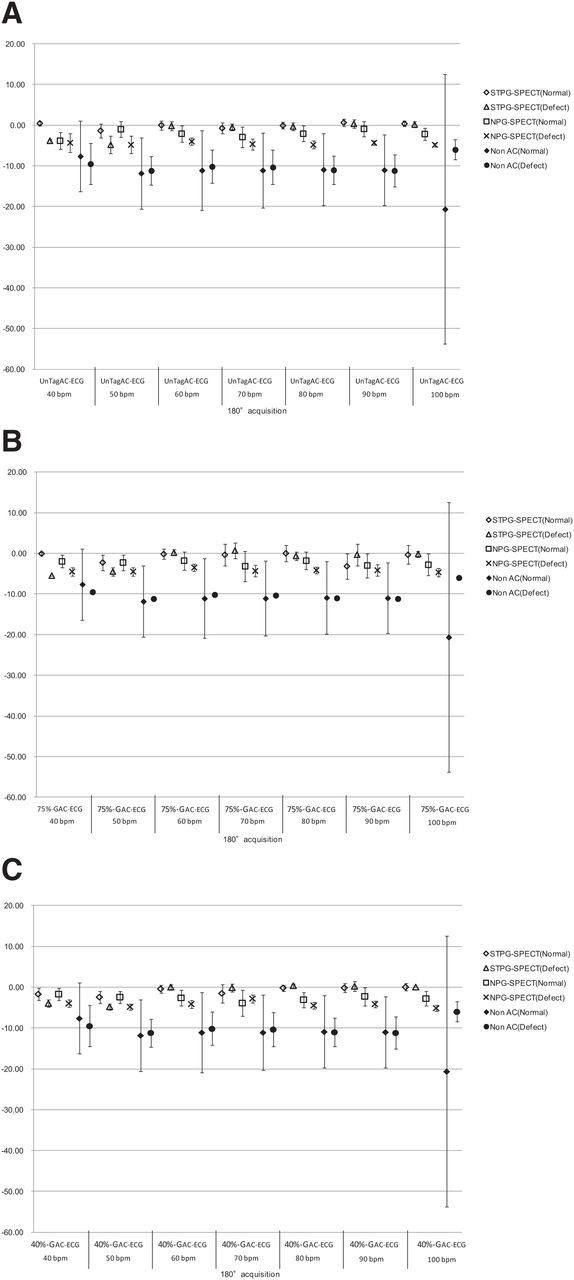
Difference in perfusion between normal and defect regions in heart rate variability of 180° acquisition: UnTagAC ECG (A); 75% GAC ECG (B); 40% GAC ECG (C).
Cardiac Function Analysis: 360° Acquisition
In comparison with the theoretic phantom values, the CT images and all SPECT imaging techniques showed lower values (Table 1). The STPGAC method showed similar values when comparing LVEF on CT images (Table 1). The other imaging modalities showed higher values regardless of the heart rate (Table 1). When the LVEF was compared between STPG SPECT and NPG SPECT, the NPG SPECT imaging technique showed lower values (Table 1).
Cardiac Function Analysis: 180° Acquisition
In comparison with the theoretic phantom values, the CT images and all SPECT imaging techniques showed lower values (Table 2). In the comparison of LVEF on CT images, STPG SPECT and NPG SPECT imaging techniques showed variations depending on heart rate (Table 2). In addition, the STPGAC method did not yield closer values for 180° acquisitions than for 360° acquisitions (Table 2).
Polar Map Segment Analysis: 360° Acquisition
In the difference in perfusion (%) of the normal region based on the STPGAC method, the comparison of STPG SPECT and NPG SPECT images (UnTagAC ECG, 75% GAC ECG, and 40% GAC ECG) with each attenuation-corrected image showed errors at all heart rates (Fig. 4). The variation was also significant compared with no attenuation correction. The error range for each heart rate did not change significantly when the attenuation-corrected images were changed. The difference in perfusion in the deficient region showed the same trend as that in the normal region. The comparison of the STPG SPECT and NPG SPECT attenuation-corrected images in terms of perfusion, ED perfusion, ES perfusion, motion, and thickening based on the STPGAC method showed no variation (normal = F(10,10) < 0.5, P = 0.05; defect = F(5,5) < 0.5, P = 0.05) (Table 3; Supplemental Appendices 1–4). There was also a correlation between them (Table 3; Supplemental Appendices 1–4).
Polar Map Segment Analysis: 180° Acquisition
The comparison of STPG SPECT and NPG SPECT images in terms of difference in perfusion in the normal region based on the STPGAC method showed errors at all heart rates (Fig. 5). The variation was also significant compared with no attenuation correction. When the attenuation-corrected images were modified, the error range changed, depending on the heart rate. The difference in perfusion of the defect region was similar to that of NPG SPECT at lower heart rates on STPG SPECT (40 and 50 bpm). As with the 360° acquisition, there was no difference between STPG SPECT and NPG SPECT when comparing each attenuation-corrected image (normal = F(10,10) < 0.5, P = 0.05; defect = F(5,5) < 0.5, P = 0.05) (Table 4; Supplemental Appendices 5–8). In addition, there was a correlation between all values (Table 4; Supplemental Appendices 5–8).
Myocardial Wall Variation
The results of the analysis of cardiac function and polar map segments at different ranges of myocardial wall variation are presented in Tables 3 and 4 and Figure 6.

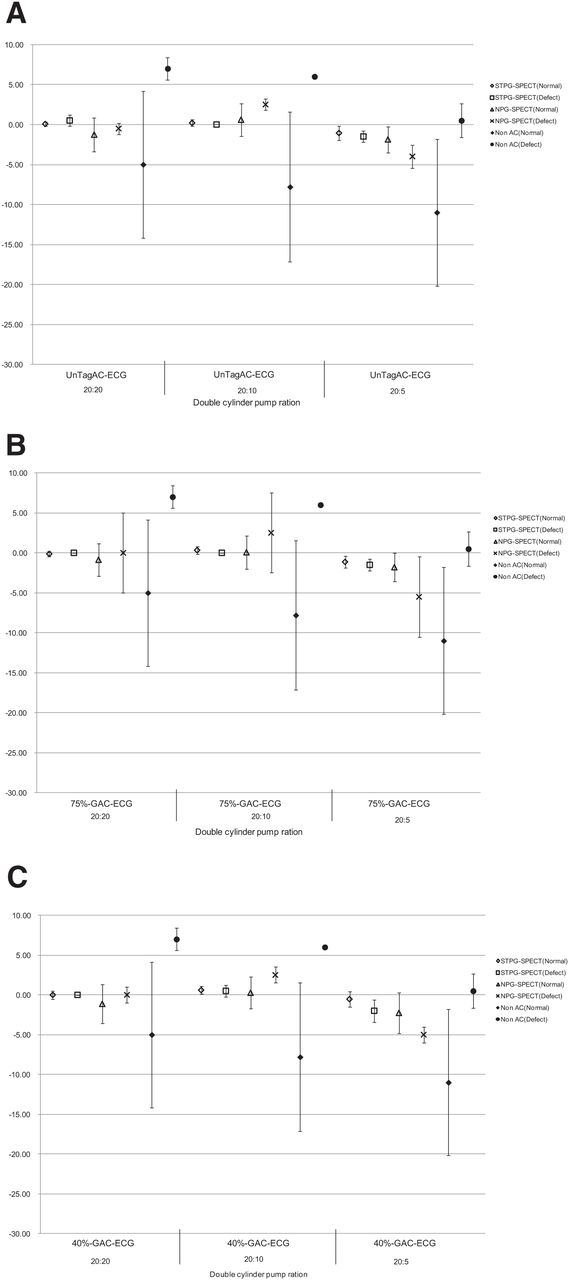
Difference in perfusion between normal and defect regions in myocardial wall variation: UnTagAC ECG (A); 75% GAC ECG (B); 40% GAC ECG (C).
Cardiac Function Analysis
A comparison with theoretic phantom values showed lower values for each range of motion (20:20, 20:10, and 20:5) in CT images and all SPECT images (Table 5). When LVEF from CT images was compared, STPG SPECT and NPG SPECT images showed similar values for each range of motion (Table 5).
Results of Cardiac Function Analysis of Myocardial Wall Variation
Polar Map Segment Analysis
In the difference in perfusion of the normal region based on the STPGAC method, the comparison of STPG SPECT and NPG SPECT attenuation-corrected images showed errors in all regions of motion (Fig. 6). The range of error in each region of motion did not change significantly when the attenuation-corrected images were changed. The difference in perfusion in the deficient region showed a trend similar to that of the normal region. Comparison of STPG SPECT and NPG SPECT attenuation-corrected images in terms of perfusion, ED perfusion, ES perfusion, motion, and thickening based on the STPGAC method showed no variation (normal = F(10,10) < 0.5, P = 0.05; defect = F(5,5) < 0.5, P = 0.05), and there was a correlation between these results (Table 6).
Results of Polar Map Segment Analysis and Correlation Coefficient for Myocardial Wall Variation
DISCUSSION
An ECG-synchronized cardiac dynamic phantom was used in this study to investigate the STPGAC method, which cannot be performed on a cardiac stationary phantom. The STPGAC method is ideal for improving the misregistration between gated SPECT data and CT data in the myocardial region by dividing the data into 16 segments in the same time phase and performing image reconstruction using the time phase data corresponding to STPG SPECT and STPGAC ECG.
The STPGAC method showed values close to those of the cardiac function analysis of the CT images. This similarity may be due to the fact that during the image reconstruction process, the attenuation correction region coincided with the myocardial blood flow region, thus improving the accuracy of the quantitative gated SPECT analysis (21) and yielding a blood flow distribution similar to that of the myocardial region in the CT image. Other image reconstruction processes were considered to cause a mismatch between the attenuation-corrected image and the myocardial blood flow region and did not show close values.
Goetze et al. (22) reported a maximum misregistration of 8.6 ± 3.8 mm in the SPECT/CT attenuation correction alignment in a clinical study, and Fricke et al. (23) reported that the inhomogeneity of myocardial blood flow was more pronounced when the misalignment between SPECT and CT was more than 1 pixel in a clinical study. Both were evaluations of misregistration of the trunk, not of the motion of the heart. This study was evaluated using an ECG-synchronized cardiac dynamic phantom with a working heart region. The results showed no difference in cardiac function analysis between the STPGAC method and the STPGAC method, even when the attenuation-corrected images were changed. However, differences in blood flow distribution (perfusion) proved to be significant. In NPG SPECT, the dynamic effects of the heart are thought to cause misregistration between gated SPECT data and attenuation-corrected images, resulting in changes in the distribution of the myocardium and defect regions. However, processing the heart region with different attenuation-corrected images did not cause significant differences in cardiac function analysis and blood flow distribution. These results suggest that myocardial blood flow analysis is not affected by variations in heart rate and the myocardial wall during image analysis. In the future, it will be more important to improve the mismatch between respiration and body motion than to improve the attenuation correction method for heart motion. We hope to develop a device that can perform respiratory and ECG synchronization for PET/CT in the future.
McQuaid et al. (12) reported that positional consistency is important in attenuation correction. In this study, there was no difference in the results of the cardiac function analysis between different attenuation-corrected images (UnTagAC ECG, 75% GAC ECG, and 40% GAC ECG) for the myocardial region. However, the theoretic value of the phantom is not shown. The theoretic values for the regular and large rubbers were calculated under static conditions, whereas this study was a dynamic measurement. Therefore, the degree of expansion and contraction of the rubber is considered to affect the results.
In this study, we used a 360° acquisition in addition to a 180° acquisition to be consistent with the data format of attenuation-corrected images. For 360° and 180° acquisitions, STPG SPECT imaging reduced the blood flow variability. However, NPG SPECT imaging results in greater variability in blood flow. In NPG SPECT, the EDV (mL) and ESV (mL) of the 180° acquisition were higher than those of the 360° acquisition. In addition, the variations in perfusion and ED perfusion could be due to the partial-volume effect of the 180° gated SPECT data, as reported by Pretorius et al. (24).
We considered the STPGAC method ideal for improving misregistration between gated SPECT data and attenuation-corrected image data in the myocardial region. However, comparison of STPGAC with other attenuation-corrected images showed no significant differences. STPG SPECT is a myocardial blood flow image that is reconstructed using time-phase data from gated SPECT and CT imaging, after which the time-phase data are combined. NPG SPECT is a myocardial perfusion image that is reconstructed without phase processing. The data formats of SPGAC SPECT and NPG SPECT were originally thought to be different, but the data formats of SPGAC SPECT and NPG SPECT were ultimately similar and the reconstructed images were not different. In addition, the heart region was smaller than the whole-body region in attenuation correction, suggesting that attenuation correction of the heart had no effect.
CONCLUSION
We investigated the STPGAC method for SPECT/CT systems. The STPGAC method was considered to accurately reconstruct the blood flow distribution in the myocardial region, because the values for cardiac function analysis using this method were similar to those using CT images. However, the target area for attenuation correction of the cardiac region was smaller than that of the whole body, and changing the gated SPECT conditions and attenuation-corrected images did not affect myocardial blood flow analysis. Therefore, given the system configuration of the SPECT/CT system in clinical use (ECG asynchronous CT imaging), if image analysis processing using the STPGAC method cannot be performed, image reconstruction processing using NPG SPECT data acquired over 360° and UnTagAC ECG from CT imaging should be used to provide good-quality diagnostic images.
DISCLOSURE
No potential conflict of interest relevant to this article was reported.
KEY POINTS
QUESTION: Can image reconstruction processing using synchronized time-phased data improve image analysis?
PERTINENT FINDINGS: Attenuation correction using electrocardiographic synchronization yielded results comparable to those of CT cardiac function analysis. However, no differences in the nuclear images were observed when different types of attenuation correction were used. The semiconductor detector system dedicated to the heart, which is not equipped with a CT system, produces images of high quality. STPG reconstruction of gated SPECT data, as in this study, is expected to improve image analysis.
IMPLICATIONS FOR PATIENT CARE: With the introduction of SPECT/CT systems, fusion images are being used in clinical practice to support diagnostic imaging. We believe that new methods (e.g., STPGAC method) for SPECT and CT images will improve image analysis in nuclear medicine in the future.
ACKNOWLEDGMENTS
We thank Munekuni Sato (Fuyo Corporation) and the staff of the Pharmacy Department of Sumitomo Hospital, who cooperated in the implementation of this study.
Footnotes
Published online Apr. 16, 2024.
REFERENCES
- 1.
- 2.
- 3.
- 4.
- 5.
- 6.
- 7.
- 8.
- 9.
- 10.
- 11.
- 12.
- 13.
- 14.
- 15.
- 16.
- 17.
- 18.
- 19.
- 20.
- 21.
- 22.
- 23.
- 24.
- Received for publication October 5, 2023.
- Revision received December 20, 2023.