

Abstract
In this descriptive study of radionuclide cystography, time–activity curves were generated from renal pelves with reflux and evaluated to reveal the physiology of the reflux. The generated new parameters were also evaluated for any correlation with the frequency of urinary tract infections and renal scarring. Methods: Thirty-two children with reflux to the renal pelvis (36 refluxing units) were included. Regions of interest were drawn on the pelves and bladder, and time–activity curves were generated. The first reflux phase, the bladder volume at first reflux, and the bladder volume at maximal reflux were defined, and reflux percentages were calculated. Dimercaptosuccinic acid (DMSA) scintigraphy findings and urinary tract infections were used for correlation. Results: New curves from the renal pelvis during bladder filling and bladder emptying were generated and their patterns classified. Episodic reflux to the pelvis was observed on time–activity curves, which demonstrated 4 different emptying patterns during voiding. These patterns were described in detail. Visually, residual activity was present in the renal pelves in 58.8% of patients. The mean number of urinary tract infections per year was 1.07 (range, 0–4; SD, 0.88). The DMSA findings were normal in 57.1% of the patients. Conclusion: We obtained and categorized some new time–activity curve patterns from renal pelves with reflux on radionuclide cystography. Discussing these patterns may help physicians understand the physiology of the reflux and the relationship between infections and reflux.
- radionuclide cystography
- prognosis
- vesicoureteral reflux
- time–activity curves
- curve patterns
Vesicoureteral reflux (VUR) is a predisposing factor for urinary tract infection (1), and up to 20%−40% of patients with urinary tract infection have been shown to have reflux (2–4). The causes of renal scarring are multifactorial, and VUR has been declared to be one of the main risk factors (5). Early diagnosis of VUR and urinary tract infection is necessary to decrease renal scarring (3). VUR may result in hypertension and end-stage renal disease (3,6,7). The correlation between renal scarring and VUR has been shown to vary between 23% and 75% and is higher in patients with a high grade of VUR (8–11). The prevalence of renal damage is higher in patients with severe reflux (7,12,13). Therefore, children with high grades of VUR must be carefully managed, treated, and followed up to achieve a better outcome in adulthood (3).
Radionuclide cystography, the preferred procedure for the follow-up of patients with VUR, allows continuous acquisitions and exposes patients to less radiation than does voiding cystourethrography (14).
Some information that can be obtained from radionuclide cystography has been shown to correlate with prognosis. In one study, urinary bladder volume and pressure at reflux were prognostic for the resolution of reflux (13); in another, reflux at low bladder volumes was associated with increased renal scarring (7). The ability to predict the prognosis for a particular patient at the time of diagnosis may lead to better treatment decisions and follow-up and may result in better outcomes.
In this study, we generated some new quantitative and qualitative parameters, including renal pelvis time–activity curves, from radionuclide cystography studies of patients with reflux to the pelvis. We evaluated these curves, classified them into groups, and discuss the physiology of reflux, emphasizing these curve patterns. We also investigated the possibility of a correlation between these new parameters and the occurrence of urinary tract infection and renal scarring.
MATERIALS AND METHODS
We retrospectively analyzed the radionuclide cystography studies that were performed in our department since 2000. There were 199 patients initially. Patients with demonstrated reflux to the renal pelvis on radionuclide cystography were included in the study. All patients were diagnosed primarily by voiding cystourethrography after the onset of symptoms due to the infection. Patients without an observed reflux or with reflux not extending to the renal pelvis were excluded. Patients with known predisposing factors for VUR, such as anatomic malformations (posterior urethral valves) and functional disorders of the urinary tract (neurogenic bladder); patients with suboptimal images (patient motion, urinary leakage because of catheterization failure); and patients without regular clinical follow-up were also excluded. The final number of patients included in the study was 23 girls and 8 boys, with a mean age of 5.8 ± 3.4 y (range, 1–14 y). The reflux was bilateral in 5 patients, resulting in a total of 36 renal pelves with reflux (36 refluxing units).
All patients were given regular antibiotic prophylaxis, mainly with cotrimoxazole, during follow-up, and all were given education about hygiene to prevent new infections.
Radionuclide Cystography
Radionuclide cystography scintigraphy was performed after aseptic catheterization, emptying of the bladder, administration of the radiopharmaceutical, and filling of the bladder. 99mTc-tin colloid (37 MBq [1 mCi]) was administered directly into the catheter as the patient lay supine. Then, the bladder was filled with normal saline solution according to the formula (age in years + 2) × 30 mL (15). Posterior dynamic views were obtained with a low-energy all-purpose collimator during the filling phase. The data were obtained at a rate of 10 s/frame (filling dynamic phase), and the frame numbers were noted for every 50 mL of saline administered to the bladder. A 1-min static image was obtained in a 256 × 256 matrix as the catheter was in place and the bladder was full (prevoiding static phase). The patients either stood or (for younger patients) were held by their parents. Dynamic imaging was started (10 s/frame), and the catheter was deflated and removed from the bladder. The dynamic images were obtained during spontaneous voiding (voiding dynamic phase), and a 1-min static image (256 × 256 matrix) was obtained when the bladder was empty (postvoiding static phase). The images were obtained using Camstar XR/T 300 and Camstar XC/T 400 γ-cameras (GE Healthcare).
Evaluation of Radionuclide Cystography
Visual Evaluation.
The parameters observed were passive persisting reflux (during filling of the bladder and persisting until the end of micturition), passive transitory reflux (during filling of the bladder and disappearing before the end of the micturition), active reflux (during voiding), and residual activity (activity in the renal pelvis on postvoiding static images).
Semiquantitative Evaluation.
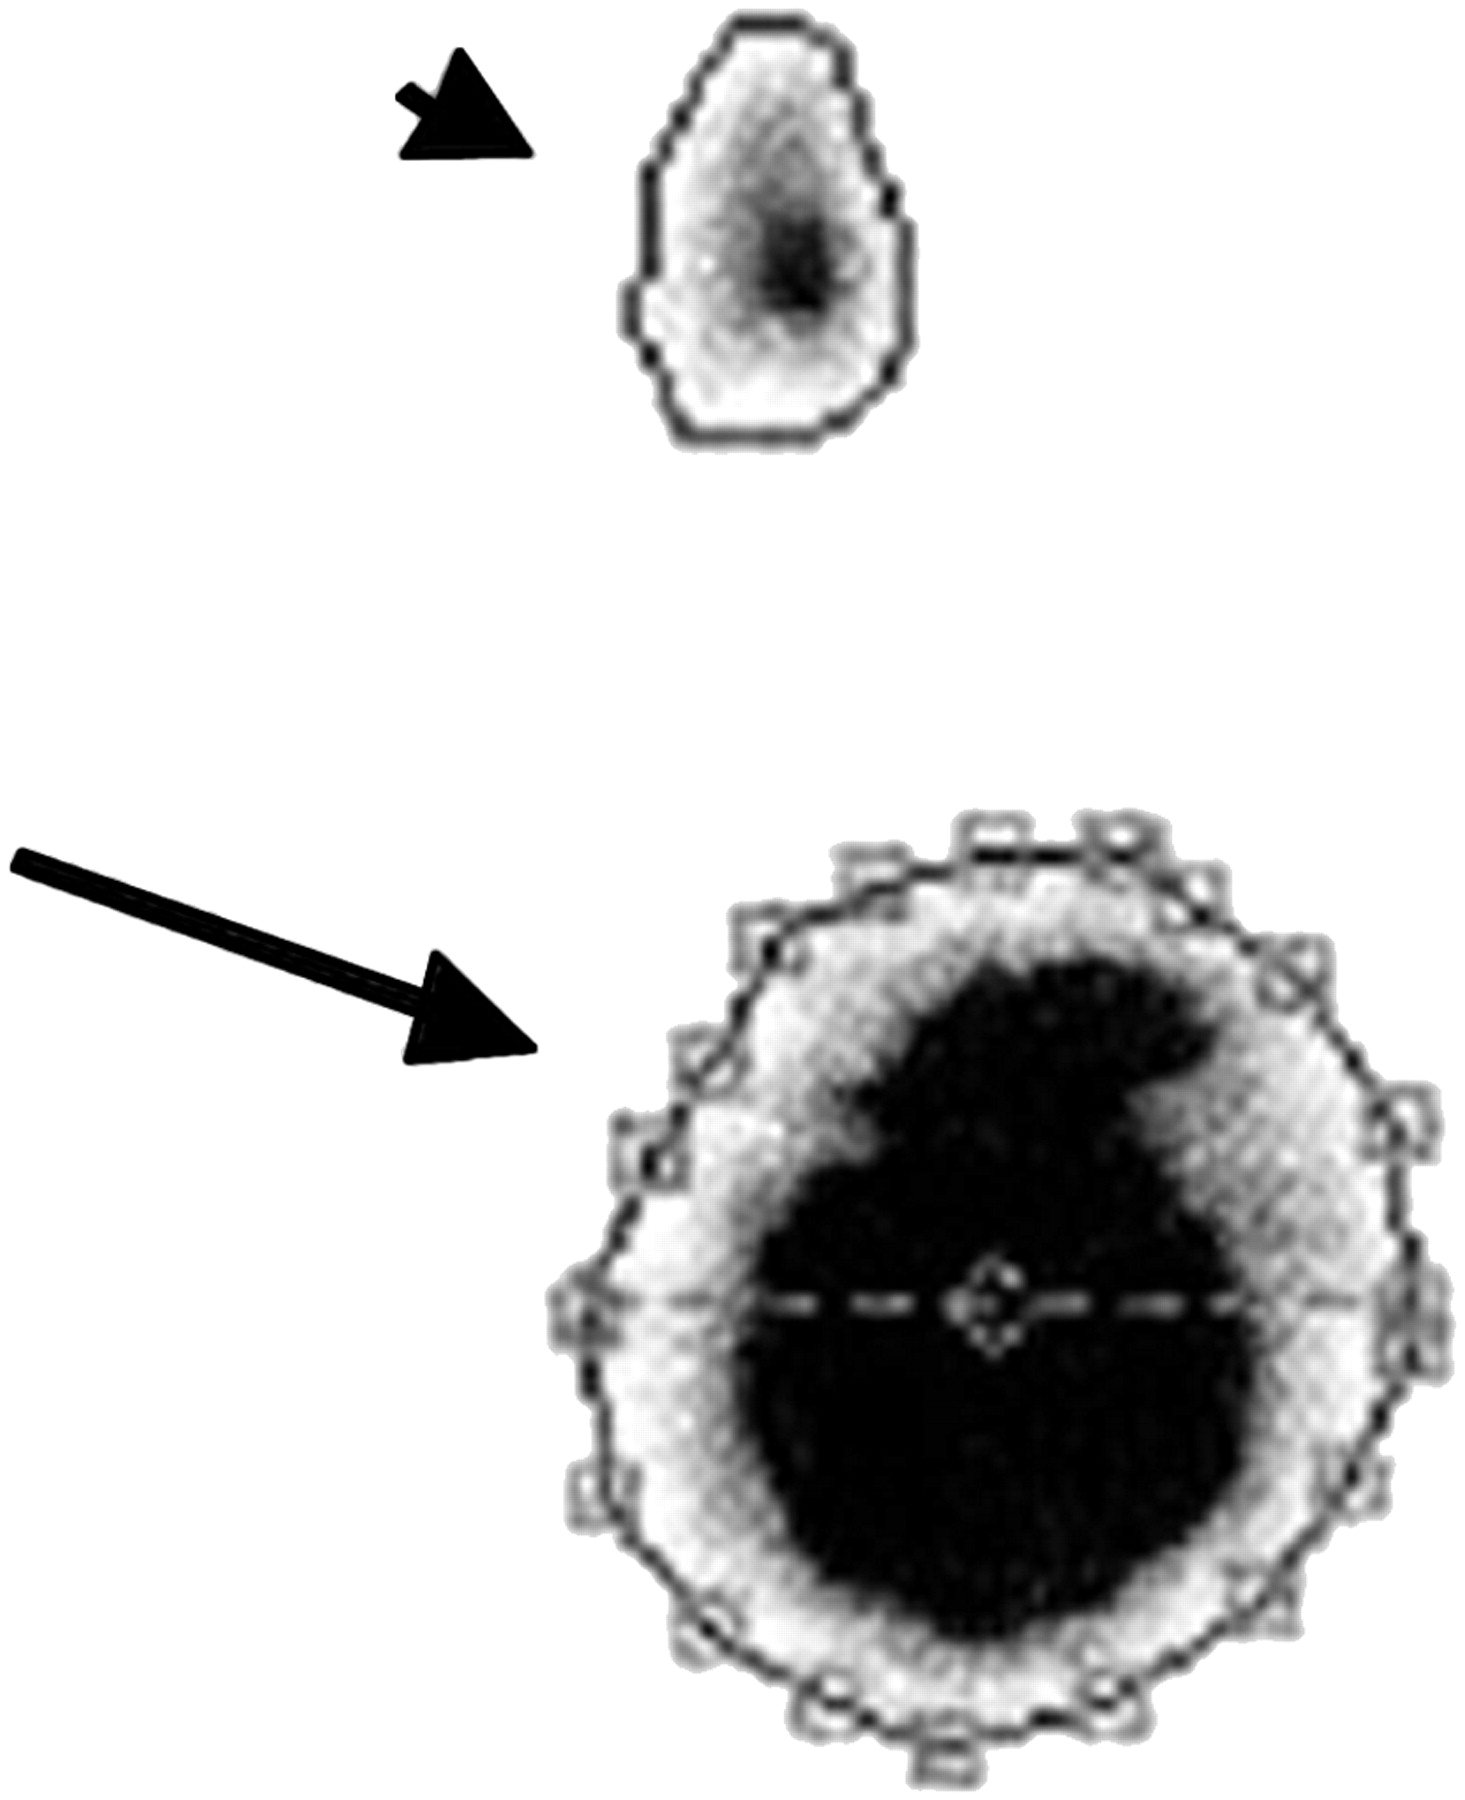
Regions of interest were drawn to evaluate the filling dynamic phase semiquantitatively. Irregular regions of interest were drawn over the renal pelves and bladder on images obtained during filling, preemptying, and emptying (Fig. 1). The count statistics were obtained from these regions of interest. The first frame showing reflux (visually) and the frame showing maximal reflux (using the time–activity curve) were noted. The bladder volumes during initial and maximal reflux were calculated using information from the patient files (the recorded frames according to the filling bladder volumes). The first and last halves of the volume were calculated for each patient by dividing the calculated total bladder capacity by 2.

Frame of image obtained during filling phase. Isocontour regions of interest were drawn for bladder (long arrow) and renal pelvis (short arrow) to generate time–activity curves.
Four parameters were used for semiquantitative evaluation. The first was the bladder volume when reflux began, or whether the reflux was first observed when the bladder was at the first or the last half of its total capacity. Reflux that was first observed before the bladder was half empty represented severe reflux. The second parameter was bladder volume at maximal reflux, or whether the maximal reflux was observed when the bladder was at the first or the last half of its total capacity. The third parameter was reflux episodes, or whether the observed reflux during bladder filling was episodic and appeared as peaks on time–activity curves. Episodic reflux was classified as 1, 2, 3, or 4 or more episodes. The fourth parameter was time–activity curve patterns (Fig. 2), which fell into 2 classes. Class 1 was a pattern of observed emptying on the time–activity curve, and class 2 was a pattern of nonemptying on the time–activity curve. Class 1 was further subclassified as class 1A (directly emptying), class 1B (first upsloping and then emptying), or class 1C (peaking several times and emptying) (Fig. 3).

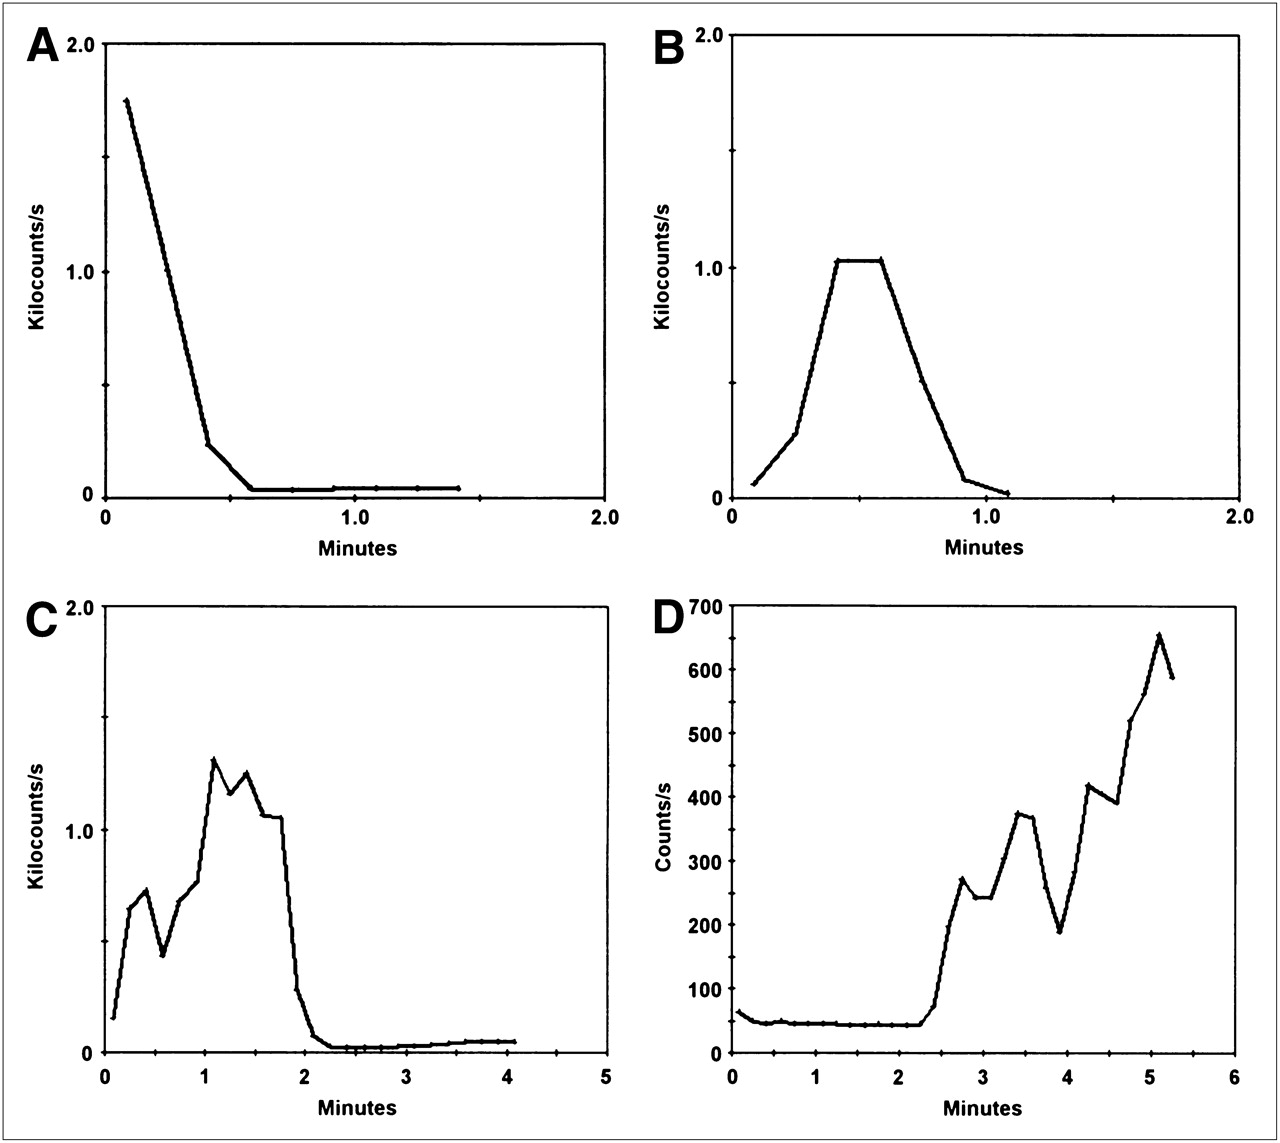
Samples of observed pelvic emptying time–activity curves. (A) Renal pelvis with reflux that was emptying directly at beginning of voiding. (B) Renal pelvis that was empty before voiding. Reflux was observed at beginning of voiding, but renal pelvis emptied completely before end of voiding. (C) Renal pelvis that was empty before voiding. Reflux was observed at beginning of voiding, but renal pelvis emptied completely, with some episodes of slight reflux before end of voiding. (D) Renal pelvis that was empty before voiding. Reflux was observed at beginning of voiding, but there was no downslope (emptying) at end of voiding, although bladder emptied completely.

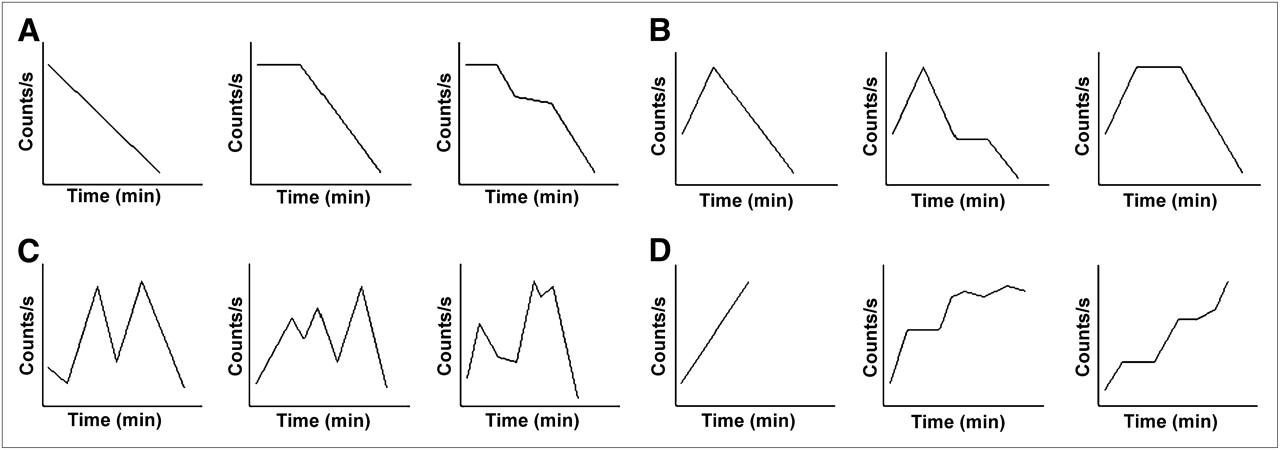
Classification of pelvic emptying time–activity curves. Four different classes were defined. (A) Class 1A pattern: renal pelves with downsloping curves (with reflux in pelvis at beginning of voiding and emptying directly). (B) Class 1B pattern: no activity in renal pelvis at beginning but episode of reflux occurs at start of voiding and pelvis empties finally. (C) Class 1C pattern: no activity in renal pelvis at beginning, but some episodes of reflux occur at start of voiding and pelvis empties finally. (D) Class 2 pattern: no activity in renal pelvis at beginning of voiding but retained reflux at end of voiding.
Quantitative Evaluation.
In generating time–activity curves from the pelvic regions of interest, the parameter used was the intensity of the reflux, or the ratio of counts in the total pelvis to the total bladder, multiplied by 100. This parameter was calculated for the filling dynamic and prevoiding static phases. The reflux percentages for the filling dynamic phase were calculated from the frame showing maximal pelvis counts.
Outcome
Renal Scarring (Dimercaptosuccinic Acid [DMSA] Scintigraphy).
The patients were injected with a dose of 1.85 MBq/kg (50 μCi/kg), and the DMSA scintigraphy was performed using a low-energy high-resolution collimator and a 256 × 256 matrix. Anterior, posterior, and 2 posterior oblique images were obtained. DMSA scintigraphy was first performed during acute urinary tract infections. Control DMSA scintigraphy was then performed 6–12 mo after the infection, on patients whose findings on the first scintigraphy had been positive. The results of both examinations were evaluated for the presence of pyelonephritis and renal scars. DMSA findings were classified as normal (no cortical defect) or pathologic (infection: a reversible cortical defect at the site of VUR; scarring: a persistent and cortical defect at the site of VUR; indeterminate: a cortical defect at the site of VUR without a control study).
Urinary Tract Infections.
The patient files were reviewed for episodes of infection. The number of urinary tract infections per year was calculated from the total number of urinary tract infections during the follow-up period. The follow-up period for the patients was 44.7 ± 9.4 mo (range, 33–65 mo).
Statistical Analysis
The qualitative and quantitative data were analyzed for any correlation with DMSA results or number of urinary tract infections per year. The Mann–Whitney U test, Kruskal–Wallis H test, and Pearson correlation analysis were used to test for a correlation with urinary tract infections. The χ2 test and Mann–Whitney U test were used to test for a correlation with DMSA scintigraphy results.
RESULTS
Reflux was first observed during the filling dynamic phase in 32 of the 36 refluxing units (88.9%), during the prevoiding static phase in 1 refluxing unit (2.8%), and during the voiding dynamic phase in 3 refluxing units (8.3%).
Time–activity curves generated from the voiding dynamic phase exhibited some similar patterns. To our knowledge, our classification of these patterns is the first to be described in the literature. In 25 of the 36 refluxing units, the reflux occurred during the voiding dynamic phase. Twenty-three refluxing units (92%) had a class 1 curve pattern (12 [48%] were class 1A, 4 [16%] were class 1B, and 7 [28%] were class 1C). Two (8%) had a class 2 curve pattern.
In 32 of the 36 refluxing units, the reflux occurred during the filling dynamic phase. Among them, 41.7% (15 refluxing units) demonstrated one episode and 58.3% (17 refluxing units) demonstrated more then one episode. There were 2 episodes in 3 refluxing units, 3 episodes in 7, and 4 or more episodes in 7. The reflux was passive persisting in 21 refluxing units (58.3%), passive transitory in 12 (33.3%), and active in 3 (8.3%). Residual activity in the pelves was seen on postvoiding static images for 58.8% of the refluxing units.
For 56.3% of the refluxing units, reflux began when the bladder volume was at the first half of its total capacity; for 81.2% of the refluxing units, maximal reflux occurred when the bladder volume was at the last half of its total capacity.
The mean reflux intensity was 3.79% (range, 0.08–48.01 min) and 5.68% (range, 0.05–61.99 min) during the filling dynamic and prevoiding static phases, respectively. The reflux intensity was significantly lower in patients whose reflux was detected when the bladder was less than half full.
The DMSA results were normal for 57.1% of the refluxing units. Infections and scarring were detected in, respectively, 2.9% and 28.6% of the refluxing units. The final diagnosis based on the DMSA results was indeterminate in 11.4% of the refluxing units. The mean number of urinary tract infections per year during follow-up was 1.07 (range, 0–4; SD, 0.88).
No statistically significant correlation was found between any parameter and the number of urinary tract infections per year or the DMSA result.
DISCUSSION
Permanent renal damage has been reported to occur more often in patients with VUR of radiologic grade II or higher (16). Because scintigraphic pelvic reflux is equivalent to radiologic grade II or higher reflux, we included patients with scintigraphic pelvic reflux in this study. We analyzed the radionuclide cystography findings for each patient, generated time–activity curves, and evaluated their patterns.
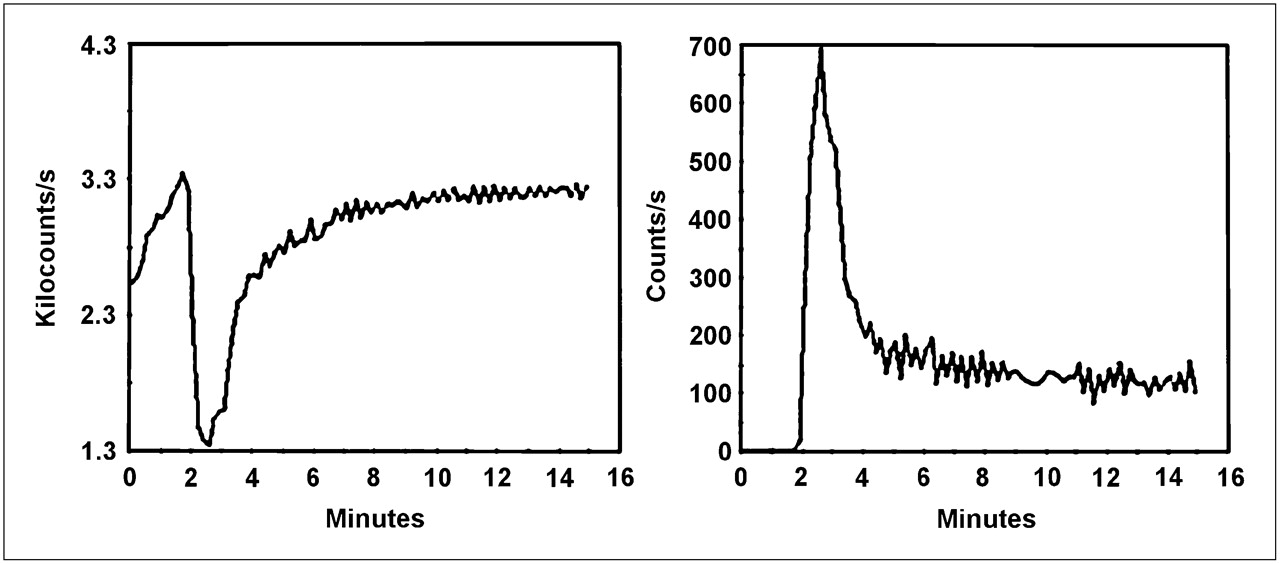
As we studied the pelvic time–activity curves of the filling dynamic phase, we observed some peaks indicating episodic reflux. These peaks represented episodes of more severe and sudden reflux during the gradual increase in pelvic activity. During these reflux episodes, the bladder counts decreased suddenly because of the large amount of refluxing urine. We observed counterpeaks on bladder and pelvic time–activity curves with each episode (Fig. 4), suggesting that patients with more than one episode may encounter more insults, have more residual urine left in the pelvis, and experience a worse outcome. For statistical analyses, because the sample size is small we further classified filling patterns according to the number of episodes, as 1 episode or 2 or more episodes. However, no correlation was found between these peak patterns and number of urinary tract infections per year or DMSA results. The negative results may have been due to the small sample size or to the regular use of antibiotic prophylaxis, but possible differences in flow kinetics during retrograde and physiologic bladder filling must also be kept in mind. The increase in bladder pressure in physiologic states may not be as clear and rapid as the pressure occurring during retrograde filling. The observed episodes might have been specific to retrograde filling. Also, some coughing or crying spells might have been the cause of these episodes; we could not eliminate the possibility of such causes, because the patient files contained no specific notes about crying or coughing spells.

Bladder and pelvic time–activity curve during filling phase. As bladder activity (also volume) during first 2 min increases gradually (curve on left), sudden reflux to renal pelvis was observed at third to fourth minutes (curve on right), accompanied by sudden decrease in bladder activity. Observed pelvic time–activity curve is example of 1-peak pattern.
We also evaluated renal pelvis emptying patterns by drawing regions of interest over renal pelves on voiding dynamic images. We observed 2 major time–activity curve patterns and classified them as emptying (class 1) or nonemptying (class 2). In the class 2 type of pattern, the bladder emptied completely but the activity in the renal pelvis did not (Fig. 5). There were also different patterns in class 1: some pelves directly emptied with a downslope, and some emptied after an episode or episodes of upslopes. That is why we further subclassified class 1 as 1A (directly emptying), 1B (first upsloping and then emptying), or 1C (peaking several times and emptying). The class 1A pattern always showed activity in the renal pelvis before the patient voided, and the pelvic activity drained until the end of voiding as demonstrated by the time–activity curve. The class 1B pattern showed some activity in the renal pelvis that increased initially with the beginning of voiding but drained until the end of voiding. The class 1C pattern showed no activity at first, but some reflux was seen with the beginning of voiding, and the renal pelvis emptied until the end of voiding. As far as we know, our description of these patterns has been the first to appear in the literature. We expected to find increased numbers of urinary tract infections per year and more lesions on DMSA scans in patients with nonemptying pelves, but only 2 patients had class 2 emptying patterns. We could not perform a statistical analysis on the emptying and nonemptying time–activity curve patterns. The mean number of urinary tract infections per year was not higher in these 2 patients than in the rest of the group. The DMSA scan demonstrated scar formations in one of these 2 patients and was indeterminate in the other.

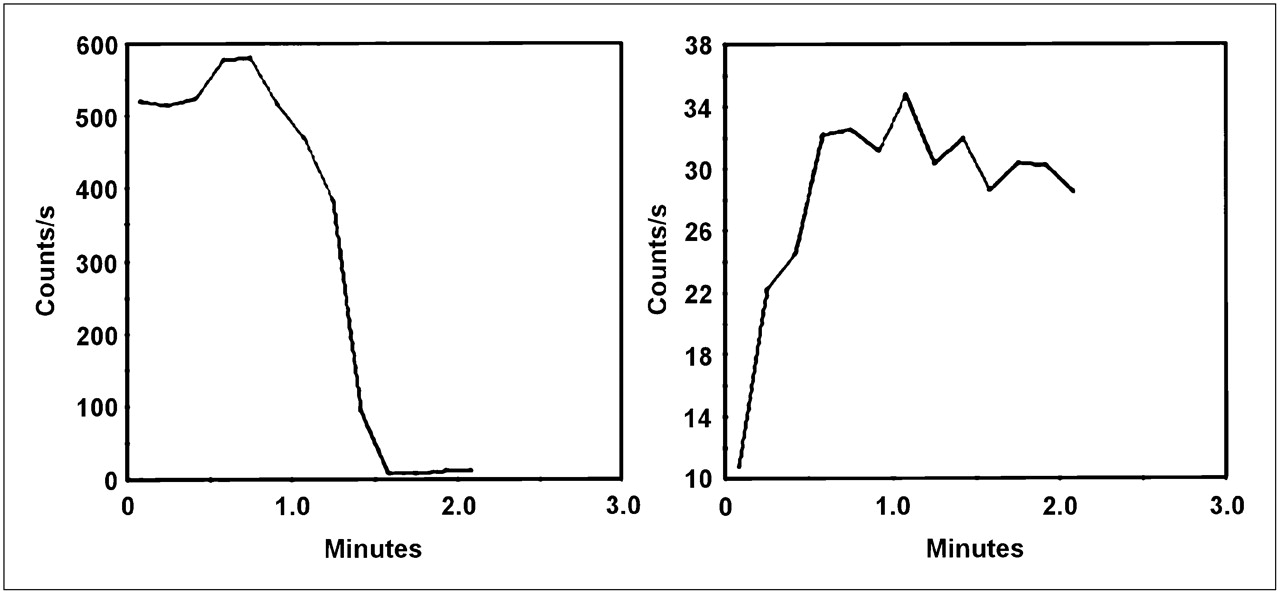
Bladder empties completely (curve on left) before 90 s, but activity of renal pelvis (reflux) does not clear (curve on right). Residual urine was also observed on postvoiding planar image in this patient. This pelvic curve is another example of class 2 pattern during emptying phase.
We saw residual pelvic activity on the postvoiding static images of about half the patients. Therefore, there were many patients who were emptying on dynamic voiding images but still demonstrating some residual activity on postvoiding static images. This conflicting finding is due to the presence of minimal residual urine at the end of voiding, although most of the urine had emptied. We think that the absence of a correlation between residual activity and the outcome parameters may be due to this minimal residual urine. In addition, the presence of activity on postvoiding static images did not reflect the residence time of refluxed urine in the renal pelvis because we obtained only one 60-s static image after the dynamic voiding images. Because the residual urine seen on the static image might quickly leak to the bladder, there may not be any urine left in the renal pelvis and the patient may not face an increased risk of infection.
The occurrence of reflux according to filling bladder volumes (7,13) and reflux intensities (13) was previously defined. Additionally, we defined the bladder volume at maximal reflux and used that definition in this study. Our finding that reflux began in 56.3% of patients when the bladder was at the first half of its capacity and that reflux was maximal in 81.2% of patients when the bladder was at the last half of its capacity is not in agreement with the findings of McLaren and Simpson (7), who concluded that VUR at low bladder volumes is associated with increased scarring. But there are some differences between the 2 studies. Their patient group had a mean age of 0.6 y at diagnosis (younger than our patients), and their follow-up period was longer. Their grading of bladder volumes also differed from ours, and their sample size was smaller.
Using DMSA findings and the frequency of urinary tract infections to evaluate outcome in patients with high-grade VUR may be a drawback in this study because there is still controversy about the cause of renal damage in patients with VUR. Some studies have reported that renal damage is associated with high-grade VUR without urinary tract infection (17), whereas others have reported that VUR does not cause renal scarring in the absence of urinary tract infection (18). The small number of patients and refluxing units in our study might obscure the possible association between the new quantitative parameters and renal and patient outcome. We also could not control some factors such as crying, coughing, and moving in this retrospective study and could not eliminate the possibility that these factors might influence urinary tract pressure and the parameters obtained.
CONCLUSION
This retrospective study produced some remarkable results, such as the identification of classifiable pelvic curve patterns that were generated from dynamic radionuclide cystography images of the filling and emptying phases. These curve patterns may help to widen investigators' scope in discussing and understanding the physiology of reflux.
One of the 2 patients demonstrating the class 2 pattern had renal scarring, and the other patient had indeterminate renal lesions. New studies with larger patient groups are needed to apply statistical analyses to reveal any possible correlation between curve patterns and scarring or number of urinary tract infections per year.
Acknowledgments
We thank Dr. Bulent Kilic, from the Departments of Public Health of our institute and of Turkey, for his help with the statistical analysis.
Footnotes
-
COPYRIGHT © 2009 by the Society of Nuclear Medicine, Inc.
References
- 1.
- 2.
- 3.
- 4.
- 5.
- 6.
- 7.
- 8.
- 9.
- 10.
- 11.
- 12.
- 13.
- 14.
- 15.
- 16.
- 17.
- 18.
- Received for publication September 12, 2008.
- Accepted for publication March 24, 2009.