


Abstract
Because of better precision and intercompatibility, the use of lean body mass (LBM) as a mass estimate in the calculation of SUV (SUL) has become more common in research and clinical studies today. Thus, the equations deciding this quantity must be those that best represent the actual body composition. Methods: LBM was calculated for 44 patients examined with 18F-FDG PET/CT scans by means of the sex-specific predictive equations of James and Janmahasatians, and the results were validated using a CT-based method that makes use of the eyes-to-thighs CT component of the PET/CT aquisition and segments the voxels according to Hounsfield units. Intraclass correlation coefficients and Bland–Altman plots were used to assess agreement between the various methods. Results: A mean difference of 6.3 kg (limits of agreement, −15.1 to 2.5 kg) between  and
and  was found. This difference was higher than the 3.8-kg difference observed between
  and
and  (limits of agreement, −12.5 to 4.9 kg). In addition,
  had a higher intraclass correlation coefficient with
  (0.87; 95% confidence interval, 0.60–0.94) than with
  (0.77; 95% confidence interval, 0.11–0.91). Thus, we obtained better agreement between
  and
and  . Although there were exceptions, the overall effect on SUL was that
  was greater than
  . Conclusion: We have verified the reliability of the suggested
  formulas with a CT-derived reference standard. Compared with the more traditional and available set of
  equations, the
  formulas tend to yield better agreement.
The number of PET/CT investigations has increased for various oncology applications, including lung cancer investigations. PET allows noninvasive quantitative assessment of biochemical and functional processes, and SUV is a common quantitative measure used in clinical studies and research. In general, SUV is defined as the ratio of the radioactive concentration measured in an area of interest to the injected activity divided by a mass estimate for the total distribution volume of the injected activity: Eq. 1
Eq. 1
where  is the concentration in an area of interest,
  is the injected activity corrected for decay, and
  is a mass estimate for the total distribution volume of the activity. In clinical practice and tradition, body weight is often used as a mass estimate. Thus, the value is denoted as SUV, which is made unitless assuming that the patient has a homogeneous mass density of 1
  .
.
In 18F-FDG PET/CT, several studies have reported a strong correlation between SUV and body weight due to the lack of body composition and body size information (1–3). It is common knowledge that adipose tissue metabolizes far less 18F-FDG than do other tissues in the fasting state and, consequently, that the SUVs of adipose patients may differ from those of lean patients for the same tumor uptake (1,2,4). Therefore, alternative methods that use lean body mass (LBM) as a mass estimate in Equation 1 have been proposed. SUV using LBM as a mass estimate is referred to as SUL.
LBM consists of the body cell mass and the nonfatty intercellular connective tissue, such as tendons and ligaments (5). Traditionally, body fat was quantified by skin-fold measurements and bioelectrical impedance analysis, but today, noninvasive imaging techniques are considered the gold standard for body composition and anthropometric analysis (6). CT, MRI, and dual-energy x-ray absorptiometry are the most frequently used modalities for this purpose (7).
Because CT-based methods are currently not applicable for clinical examinations, LBM is calculated from predictive equations by means of parameters such as sex, height, and body weight (8). A common set of equations in modern scanners is referred to as the James equations. They are based on skin-fold measurements and calculate LBM as Eq. 2
Eq. 2
where  is body weight and h height (9). The James formalism has a well-known weakness resulting in a negative correlation with body mass index (BMI), defined as
  (10). Janmahasatian et al. (11) used another approach and developed predictive equations based on bioelectrical impedance analysis. In this method, the total-body water is assumed to be a constant fraction of fat-free mass, such that fat-free mass can be estimated from the ratio of total-body water to the constant water fraction from the impedance index. Fat-free mass does not include fat in cell membranes, making fat-free mass slightly different from LBM (5), but for simplicity we denote fat-free mass as LBM in the set of equations. The equations, which Janmahasatian et al. verified with dual-energy x-ray absorptiometry measurements, read
 Eq. 3
Eq. 3
In general, basing predictive equations on the present demography is complicated by, for example, ethnic and epoch differences (12). Hence, efforts have been made to extract the LBM for SUL calculations by using the already-existing attenuation-correction CT component of the PET/CT examination (13).
Chan (13) developed a technique to estimate LBM from a limited-field-of-view CT scan and found that the CT-computed LBM was more accurate than results obtained from predictive equations. The reliability of his method was confirmed in a later study that compared the results with 5 predictive equations (14). Another group found substantial discrepancies between individual LBMs from CT scans and predictive equations by comparing 4 sets of predictive equations with CT-computed LBM using a built-in software package from Siemens to extract adipose tissue and adipose tissue–free body mass (15). The CT-based method developed by Hamil et al. has several similarities to the method developed by Chan but differs in some respects, such as the introduction of a skin component to address partial-volume effects.
This study aimed to compare SULs from the 2 sets of predictive equations,  and
and  (i.e., Eqs. 2 and 3), with CT-based SUL methods by means of statistical analysis.
  , which constitutes the new European Association of Nuclear Medicine guideline for LBM calculations (16), has not, to our knowledge, been previously compared with and validated against a CT-based method for LBM.
MATERIALS AND METHODS
Patient Population
In total, 44 patients were included in the present prospective study. Consecutive patients referred for lung cancer assessment were asked to participate. Their characteristics are listed in Table 1. The institutional review board approved this study, and all subjects signed a written informed consent form. The patients were selected according to their BMI to obtain approximately 15 subjects in each of 3 intervals: 18.5–24.9, 25.0–29.9, and 30.0–∞. Exclusion criteria were patients with large metallic implants, proven diabetes, or a blood glucose level higher than 8.3 mmol/L (16).
Patient Characteristics
PET/CT Acquisition Protocols
For the PET/CT image acquisition, we used a Siemens Biograph 64. The patients fasted for at least 6 h before undergoing imaging. The amount of injected 18F-FDG was based on the patient’s age and body weight (17). Sixty minutes after injection, the patients were scanned. The CT aquisition parameters were 120 kV, 3.0-mm slice thickness, 50 mAs, and a 1.35 pitch using a B31f kernel for the reconstructed images. In the PET protocol, we scanned at a rate of 3 min/bed position using ordered-subsets expectation maximization with 4 iterations and 8 subsets, creating a  matrix smoothed with a 5.0-mm gaussian filter.
Area-of-Interest Definition in Determination of SUV
The SUVmax and SUVpeak of the lesions, and the SUVmean and SD of the liver, were measured and registered using a Siemens SyngoVia workstation (version VB10A). SUVmax and SUVpeak were measured manually by placing a volume of interest over target lesions. SUVpeak was defined as a volume of 1 cm3 around the site of maximum uptake. All chosen lesions were evaluated as pathologic by a nuclear medicine physician. Liver background uptake was measured by placing a 3-cm region of interest in the right liver lobe according to PERCIST (4). Cross-sectional regions were displayed in axial, sagittal, and coronal projections in such a way that no hypermetabolic uptake was included in the reference regions. Target lesions were defined as tumor in the lung parenchyma (for 39 patients), and if there was more than one, we included that with the highest 18F-FDG uptake. In the 3 patients who showed no evidence of a lung tumor, we applied the volume of interest over the most hypermetabolic mediastinal or hilar lymph node. In 1 patient, we placed a volume of interest over hypermetabolic pleura, as this was the only finding. In 1 other patient, no volume of interest was applied, as there was no evidence of a lung tumor, hypermetabolic pleura, or a hypermetabolic lymph node.
Data Analysis
 (Eq. 2) is calculated using
  in kilograms and h in centimeters. For the calculation of
  , h is in meters for the computation of BMI.
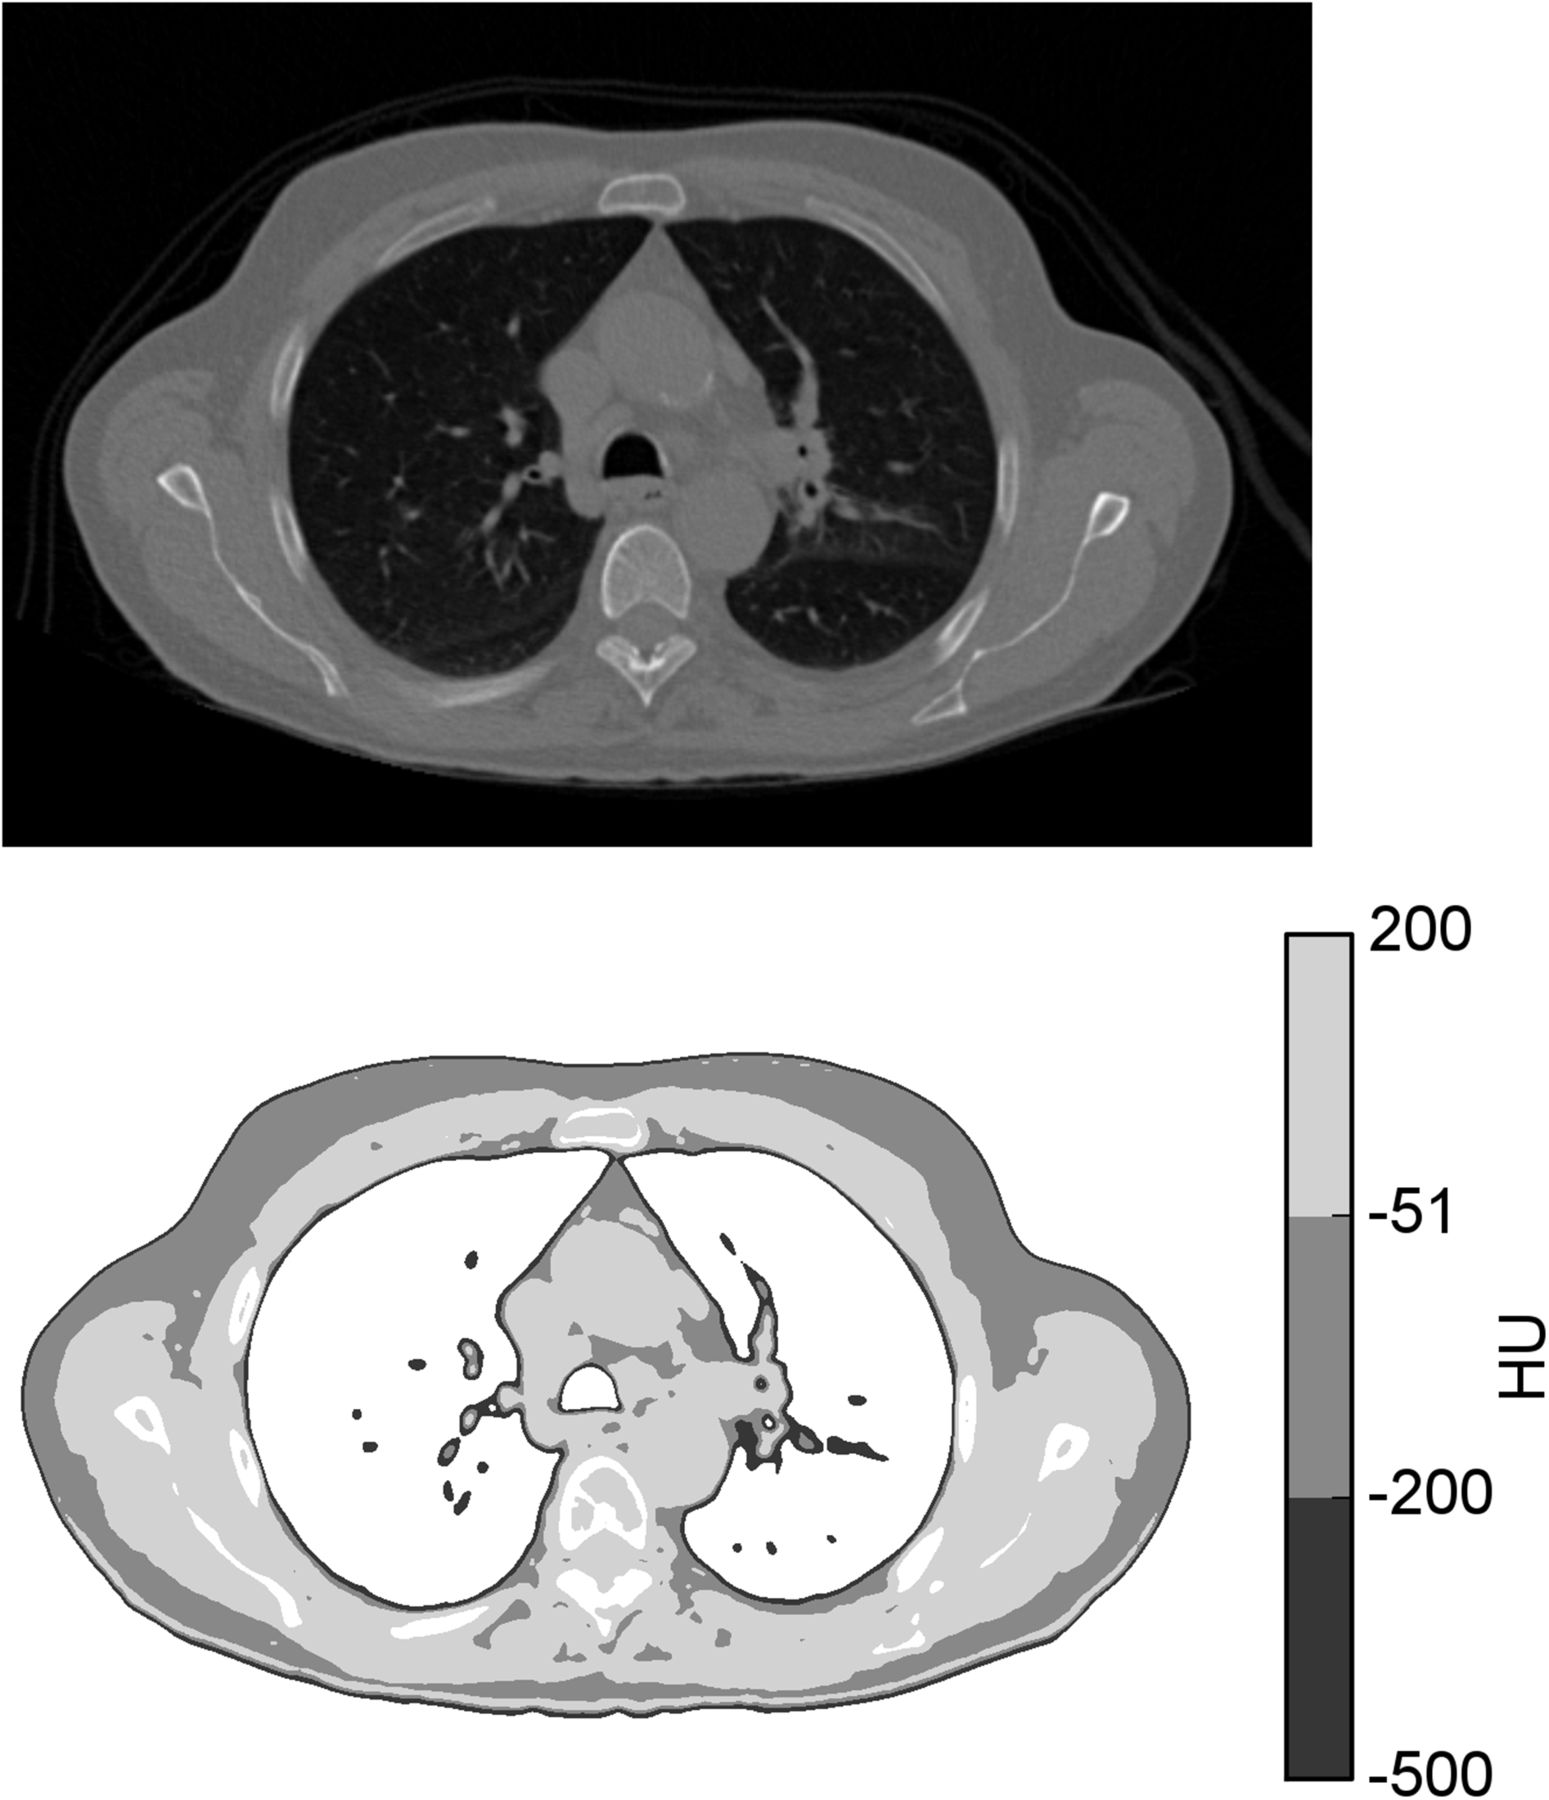
The CT-based method developed by Hamil et al. (18) makes use of the eyes-to-thighs CT portion of the PET/CT acquisition. The method is based on estimates of lean tissue, fat, and bone from counting all voxels in a characteristic range of Hounsfield units, multiplied by voxel size and a characteristic density. An example of how the segmentation process takes place in a single axial image is shown in Figure 1. The LBM formalisms read Eq. 4
Eq. 4 Eq. 5
Eq. 5

Tissue segmentation in accordance with CT-based method described by Hamil et al. (18). (Top) CT thorax image in axial projection. (Bottom) Regions segmented as skin, fat, and LBM in Hounsfield units (HU) of −500 to −201, −200 to −51, and −50 to 200, respectively.
where m1 and m2 represent the brain and head mass, respectively, in kilograms;  is a proportionality constant representing the relative uptake in fatty tissue to lean tissues; and the terms lean, fat, and bone represent the weight, in kilograms, of these 3 tissue types. In contrast to the more intuitive
  ,
,  is meant to model the body’s processing of 18F-FDG. Because of the limited CT field of view, m1, m2, and
  are estimated parameters.
Both the predictive equations and the CT-based method were implemented using the Python programming language (Python Software Foundation, version 2.7) along with the statistical analysis. The implementation of the CT-based method was verified by a head-to-toe CT scan in which the entire patient was within the field of view, and the patient’s body weight was compared in the same way as previously published (18), where Eq. 6
Eq. 6
CTme denotes mass estimate from CT. The difference between actual body weight and  was on the order of a tenth of a kilogram, which is considered a satisfying result that implies correct implementation of the method.
All SULs are calculated as Eq. 7
Eq. 7
where subscript i denotes the 4 various LBM calculations from Equations 2–5.
Statistical Analysis
For continuous variables, mean ± SD is reported. The Bland–Altman analysis was used to investigate absolute differences between two methods (19). The average difference (bias) and the limits of agreement, between which 95% of all comparisons lie, are reported. In addition, intraclass correlation coefficient (ICC) with 95% confidence interval was used to assess agreement among different types of measurements (20). In all cases,  was used as the reference standard. The normality of distributions was graphically checked, and 95% confidence intervals were used.
Pearson correlation coefficients (r) and regression lines were computed for liver SUL versus BMI, and tumor SULmax and SULpeak are presented using bar plots. A paired-sample t test was used to compare the differences in tumor-value results based on predictive equations.
RESULTS
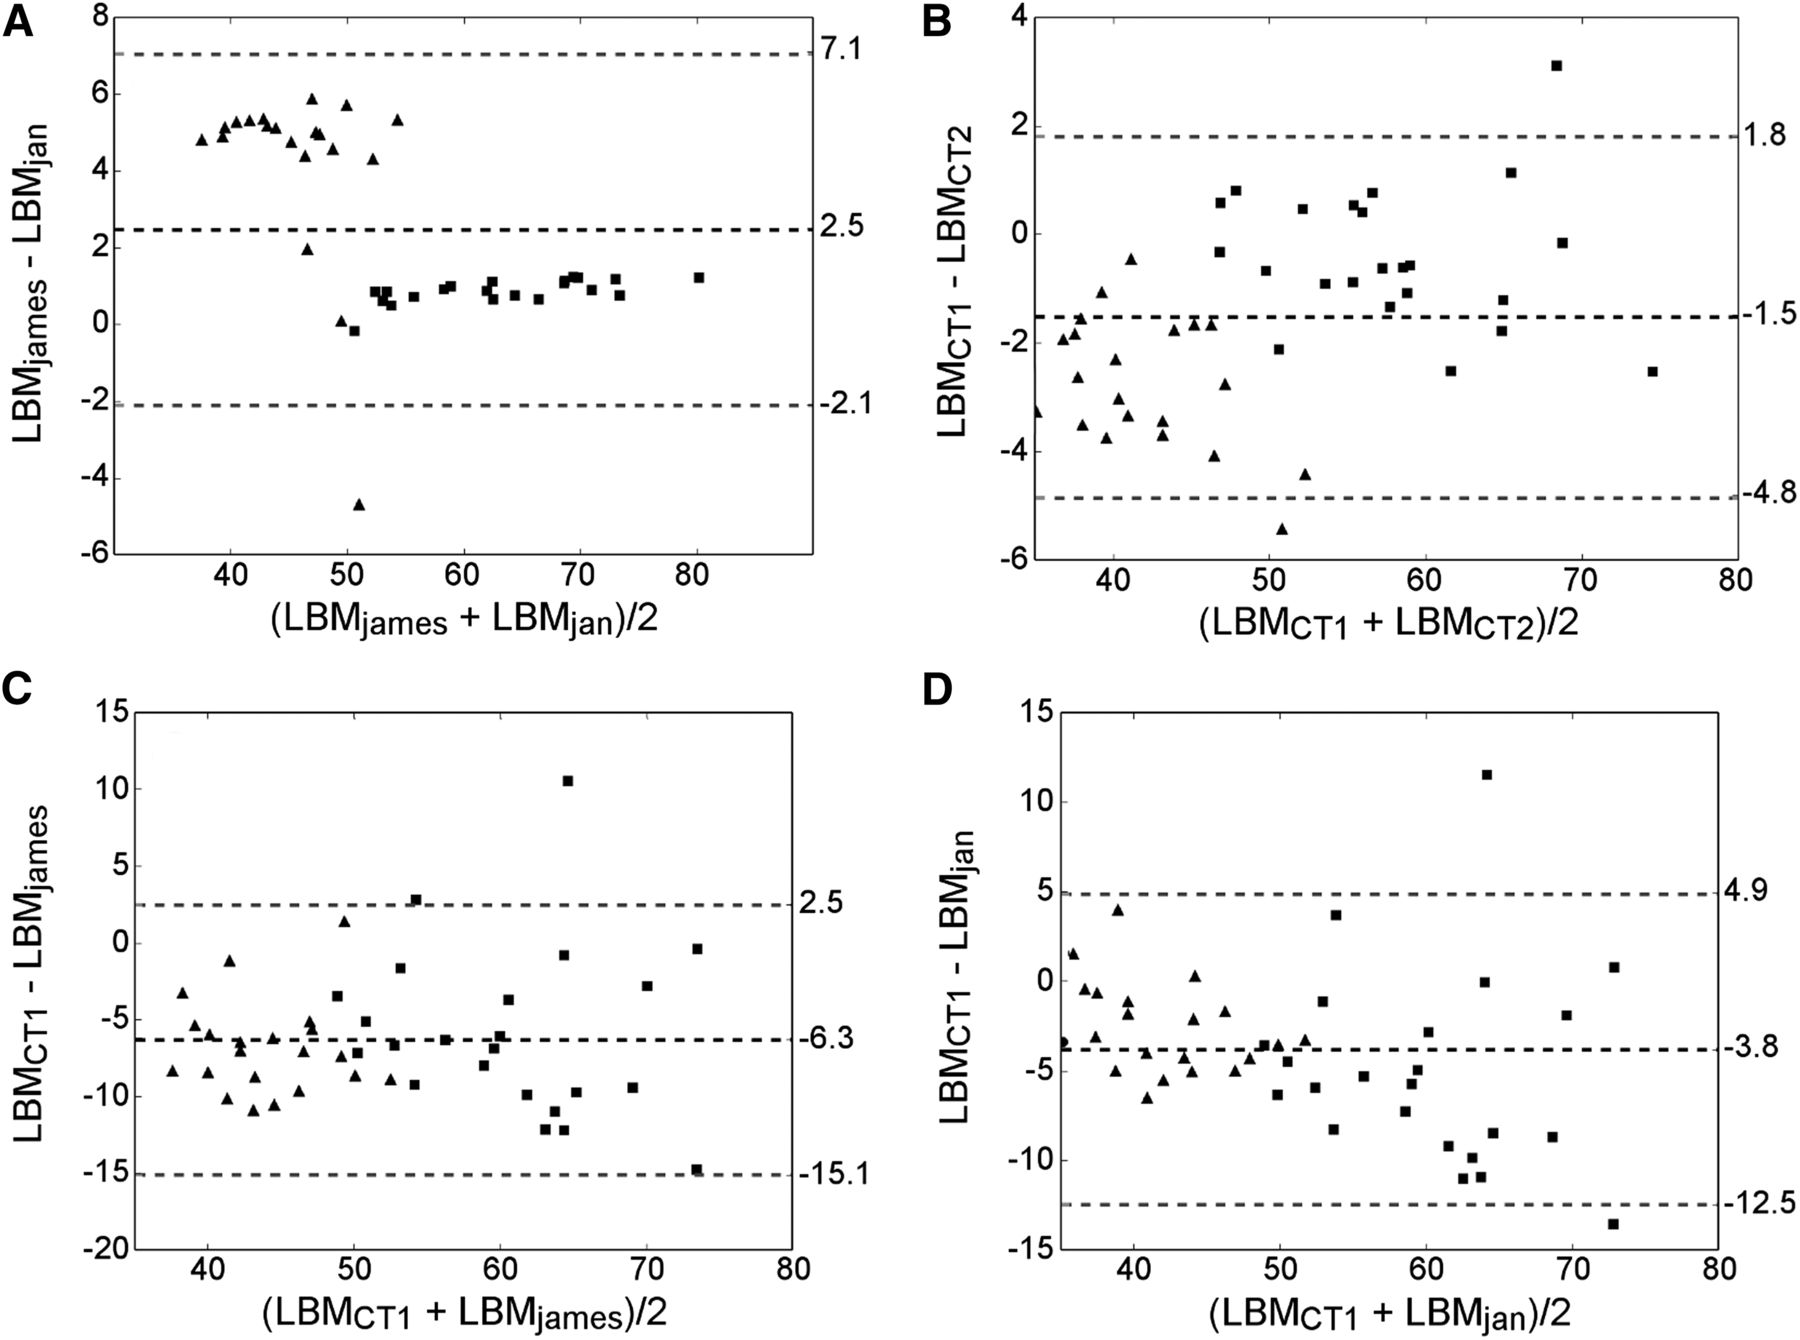
Figure 2 presents the various LBM methods compared by means of Bland–Altman plots. The mean difference and limits of agreement are computed for both sexes together.

Bland–Altman plots illustrating differences between  and
and  (A),
(A),  and
and  (B),
(B),  and
and  (C), and
  and
and  (D). Dashed black lines denote mean difference, whereas gray dashed lines denote limits of agreement. Squares and triangles denote male and female patients, respectively.
We found good agreement between  and
and  , especially for men (Fig. 2A). For women,
  introduced a systematic overprediction compared with
  (∼5 kg). The negative outlier resulted from a female patient with a BMI of 42.
We observed a bias in the direction of LBM overestimation for both  and
and  when compared directly with
  (6.3 and 3.8 kg, respectively) (Figs. 2C and 2D). The limits of agreement were approximately the same (95% confidence interval, 8.8 and 8.7 kg for
  and
and  , respectively), showing that the interpatient variation was about the same. The ICCs shown in Table 2 yielded similar results, with an ICC of 0.87 (95% confidence interval, 0.60–0.94) for
  and 0.77 (95% confidence interval, 0.11–0.91) for
  .
.
ICCs Using  as Reference
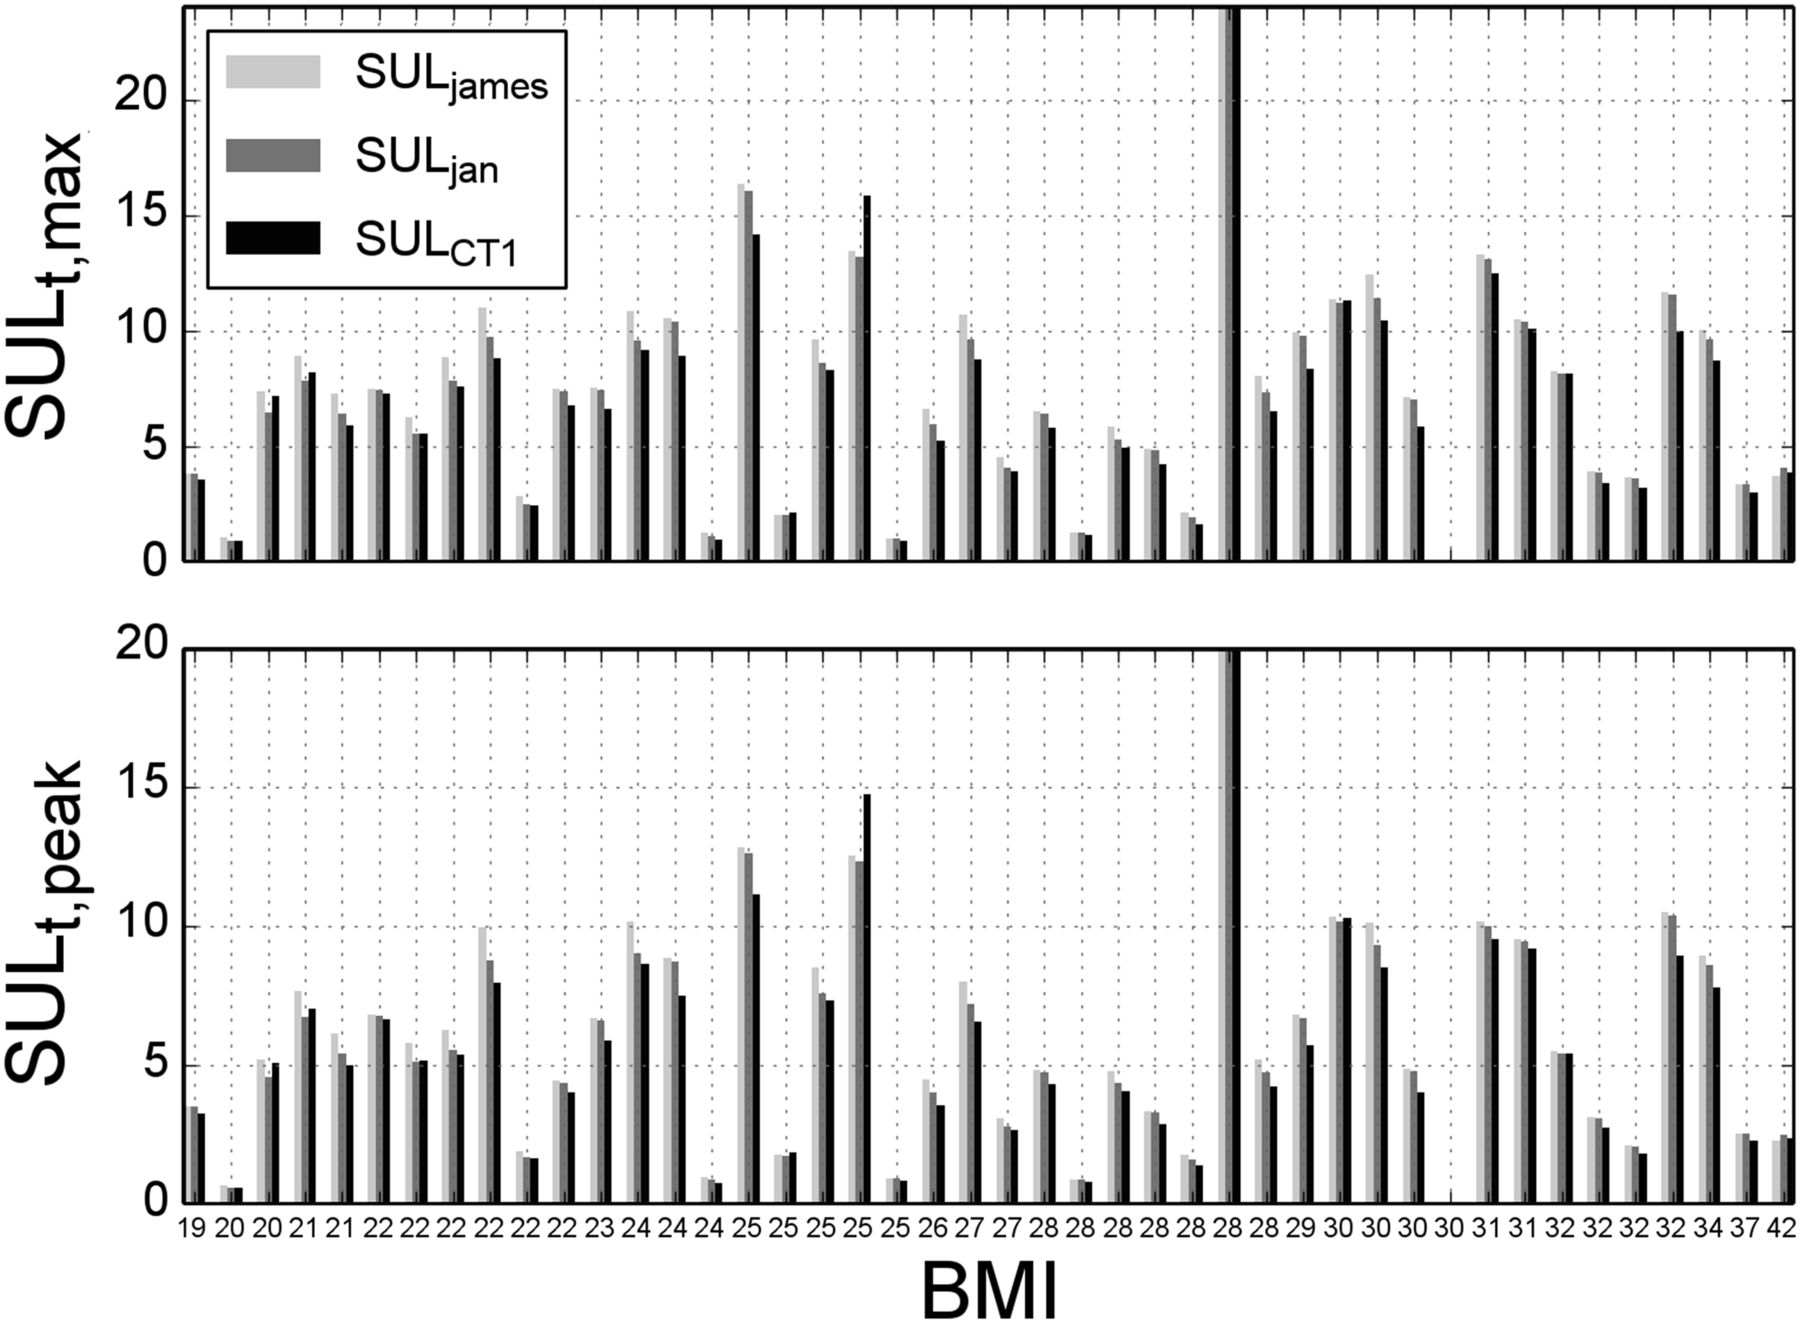
The impact of each method on measured tumor SUL was investigated for each patient individually. The tumor SULpeak and SULmax, computed for all patients using the 3 LBM formulations in Equations 2–4, are shown in Figure 3.

Bar plots showing how variations in LBM calculation can affect maximum and peak SUL for individual tumors. SUL of a single tumor is given for each patient, with patients being sorted by increasing BMI.
The overall trend was for  to be greater than
  , which again tended to be greater than our chosen gold standard method,
  . There were, however, exceptions. The interpatient variation was greater than the method differences. Compared with
  ,
,  gave a median tumor SULmax of 0.64 (range, 0.0–1.3) and a median tumor SULpeak of 0.58 (range, 0.0–1.2). No significant differences between
  and
and  in relation to
  were found (
 for peak values and maximum values).
In Figure 4, liver SUL and SUVmean are plotted against BMI together with an associated linear regression line to show the impact of BMI on the computed uptake values. The range of mean liver SUV, 1.70–2.87, was within that specified in the European Association of Nuclear Medicine guidelines (16).
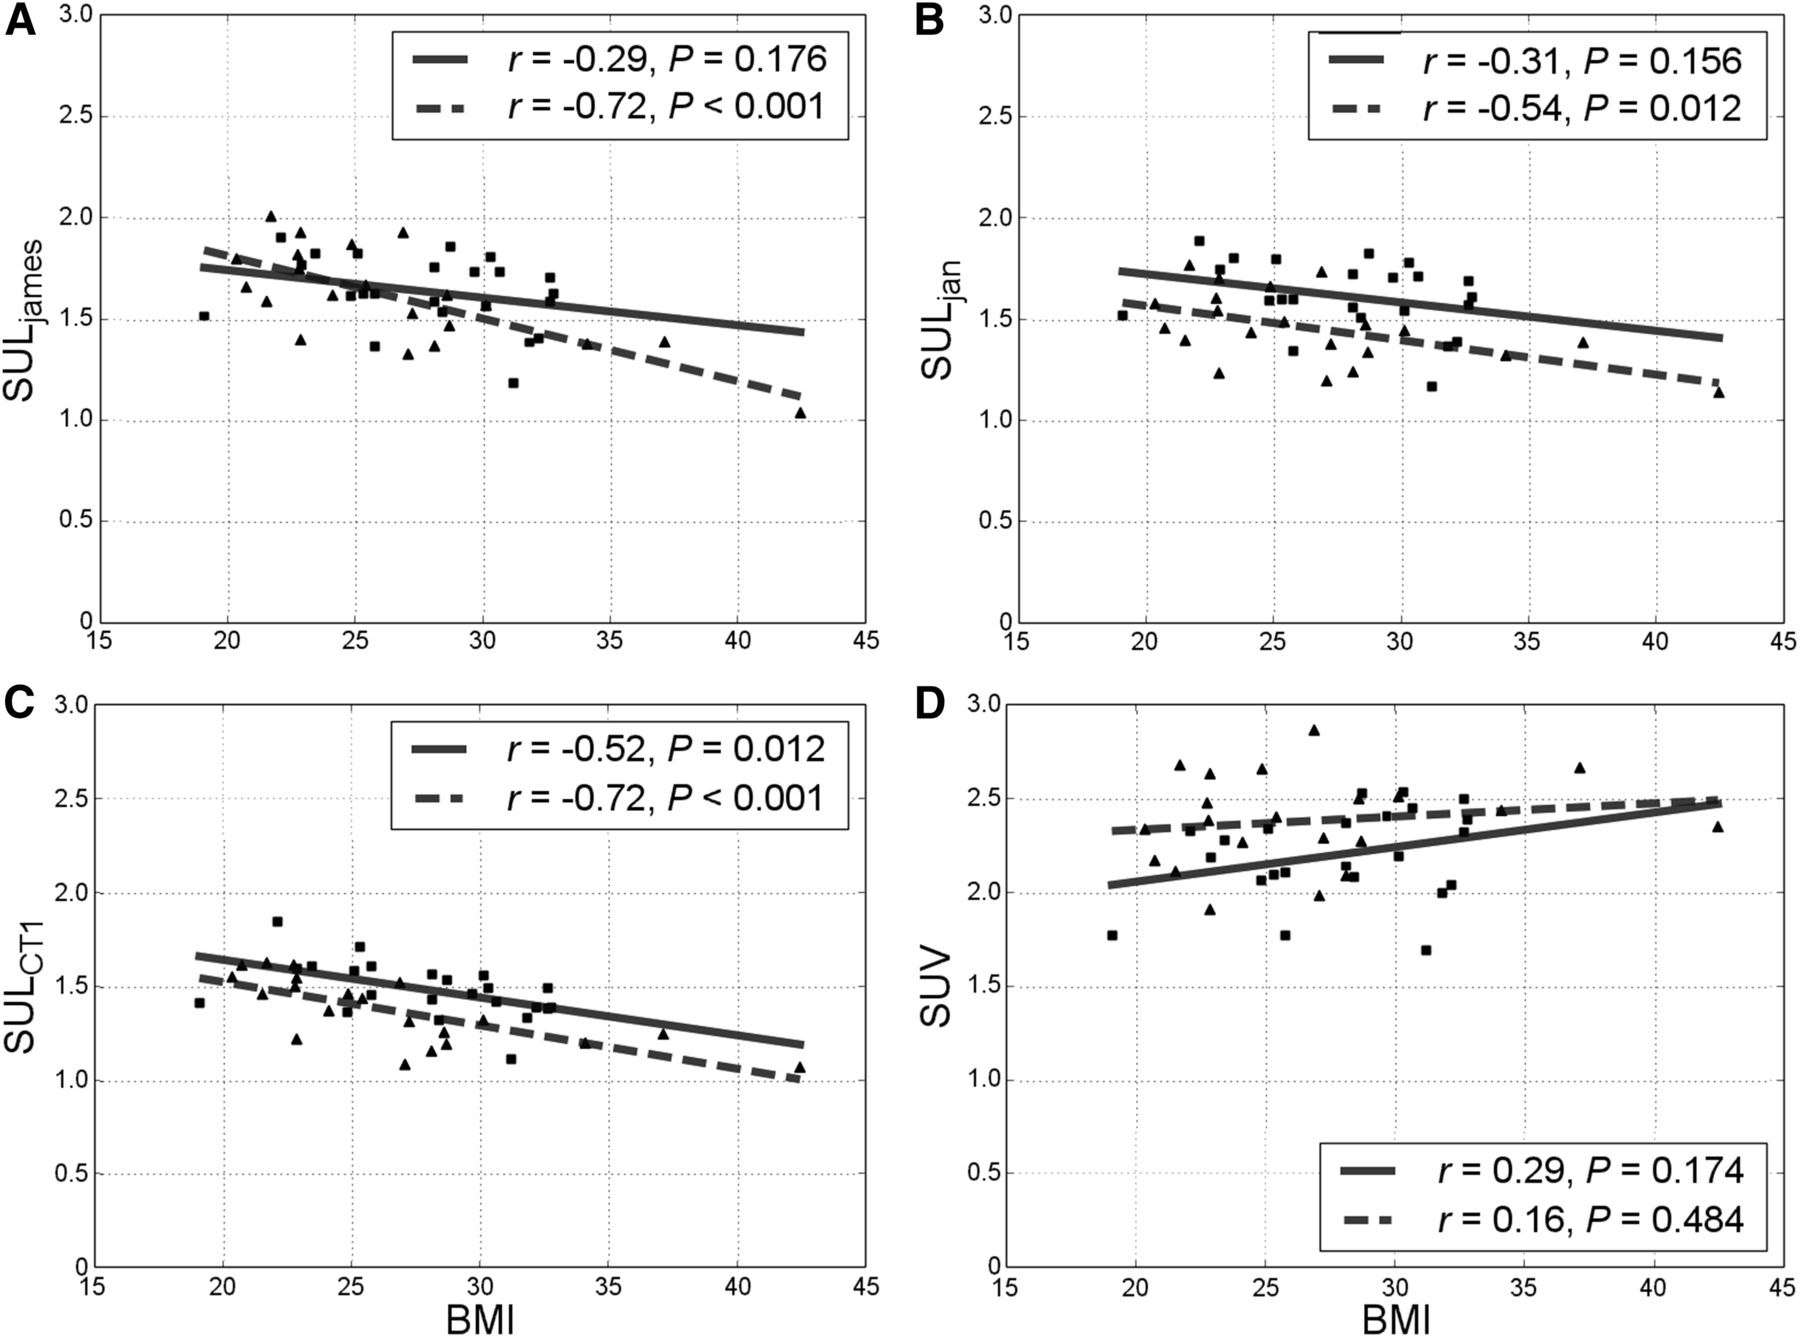
Liver SUL vs. BMI for  (A),
(A),  , (B)
, (B)  (C), and BMI (D). Squares and triangles denote male and female patients, respectively, with associated solid regression lines.
Two methods for CT-derived LBM were implemented. These were compared, and the results (Fig. 2B; Table 2) showed only a modest disagreement: an ICC of 0.98 (95% confidence interval, 0.89–0.99), bias of −1.5 kg, and a limit of agreement of −4.8 to 1.8 kg.
Our dataset included 4 patients with metallic implants: 3 with a hip replacement and one with a pacemaker. In the case of the pacemaker, the difference after removing 6 partially distorted axial planes in the middle of the mediastinum was 0.1% for  and therefore of little concern. In the case of the hip replacements, the distortion did not affect the entire image, but we chose to exclude the axial planes of the CT series that showed the metallic implant. For these patients, the largest observed difference in
  was 2.4%, with 48.1 versus 49.2 kg, and was considered negligible.
DISCUSSION
Both  and
and  use different equations for male and female patients. Our results showed a systematic difference between
  and
and  for the female patients, whereas the results for the male patients were in relatively good correspondence. Consequently, changing from
  to
to  will most strongly affect female patients.
It is to be expected that patients with a very high BMI show up as outliers in the results when  and
and  are compared directly. This is a consequence of the James equations, which have a known negative bias for high-BMI patients, originating from the parabolic nature of the equations (10). The female equation obtains its maximum when BMI is approximately 37. After that point, LBM will decrease with increasing BMI. Such is also the case for the male equation, but with a higher maximum, at a BMI of about 43. In their paper, Tahari et al. (10) argue for the replacement of
  with
with  because of the significant difference for high-BMI patients, but their lack of quantitative comparison between
  and
and  does not reveal the method difference in the lower-BMI regions. Although the Pearson correlation coefficients for SUV and SUL versus body weight were lower for
  than for
  ,
,  was not validated as a reliable measure for true LBM.
We observed a bias in the direction of LBM overestimation for both  and
and  compared with
  (6.3 kg and 3.8 kg, respectively). The lower bias for
  makes this the preferred method. The ICCs shown in Table 2 yield the overall same results as the Bland–Altman analysis; that is,
  has better agreement with
  than
than  . The ICC of 0.87 for
  shows a better extent of correspondence between the methods than does the ICC for
  , at 0.77.
Decazes et al. (14) used the same statistical techniques, that is, Bland–Altman plots and ICCs, to verify Chan’s CT models (13) but seemingly implemented  incorrectly using 120 instead of 128 in the second term for males and h instead of
  in the first term for females. Hence, their results may not be comparable. Both their comparison with other equation-based methods and the comparisons made by Erselcan et al. (12) find discrepancies with a reference standard, using dual-energy x-ray absorptiometry in the latter case. The general trend is that if the mean values from a Bland–Altman analysis are smaller, those come at the cost of an overestimation for the leanest patients and an underestimation for the most adipose patients, leaving us with a biased function. In cases without a biased function, the limits of agreement are about the same size as for
  in these studies.
The positive outlier in Figures 2B–2D was due to a subject with a large muscular mass with low percentage of fat. It is to be expected that predictive equations using BMI as a measure of fat content have difficulty estimating LBM in this type of patient.
We chose the  methods as the gold standard in our analysis based on multiple studies (2,6,13,14), although there are several variations within these CT-based methods, including differences in Hounsfield unit range and tissue density. Besides these differences, Decazes et al. (14) argued that the nonuniform tissue distribution in Chan’s method reflects reality better than the uniform distribution of fat, lean, and bone used in
  . On the other hand,
  is meant to consider the case of nonuniform distribution, introducing tracer uptake in fat and differences in fat content in the head. There are differences in LBM calculations from the various CT methods, although these differences are smaller than those obtained with the predictive equations. Hence, we included the
  method in our study and observed a good correspondence between the 2 CT-based methods. In comparison,
  also tells us something about the uncertainty of the limited field of view in
  . Less bias and high ICCs, −1.5 kg and 0.98 (95% confidence interval, 0.89–0.99), respectively, confirm the robustness of the latter method. Because
  is not considered validated, according to the author (18), we performed the SUL analysis using CT1 as the reference.
Metallic implants are a challenge when CT is used for LBM. An increase in BMI also tends to correlate with the number of people having metallic implants as a result of overuse injuries. But on the basis of our experience, the CT-based methods yield more consistent results than the predictive equations for this group. In accordance with Hamill et al. (18), the change was smaller for  . This finding also corresponds to earlier studies that found CT methods to agree well across variations in field of view (14). Another challenge for CT-based methods is the presence of large-volume ascites, pleural effusions, or soft-tissue edema. Here, one could experience a relative bias toward overestimation of LBM because these regions will falsely be characterized as lean tissue while usually taking up no 18F-FDG. That said, the predictive equations using such parameters as body weight and height would also struggle with these types of volumes. In our patient population, none of the above-mentioned volumes were present.
The results from our SUL computations in Figure 3 underscore the result from Figure 2, that  in general overpredicts LBM, compared with
  and
and  . The only case in which the opposite is evident in Figure 3 (a patient with a BMI of 25) is one with SULmax and SULpeak higher for
  than for
  and
and  . This patient is the same as referred to earlier: the muscular subject with a low percentage of fat compared with the others. None of these patients would be diagnosed differently based on the results from the 3 LBM formulations, since the diagnosis often is based on the overall evaluation and not on SUL alone. However, it is obvious that a more precise SUL will contribute to better patient diagnostics and treatment evaluation in the long term.
Figure 4 shows a classic way to evaluate results by plotting BMI versus liver SUL with associated regression lines, which ideally should be uncorrelated. In contrast to Tahari et al. (10), we systematically found a negative correlation for female patients in both  and
and  (Figs. 4A and 4B). That said, the overall results were about the same. The number of patients in the compared study was significantly higher (i.e., 1,033 vs. 44), with emphasis on patients with a BMI of less than 30. However, the lack of a direct quantitative comparison between the methods makes this study important in terms of validation.
CONCLUSION
We have verified the reliability of the suggested  formulas against a CT-derived reference standard.
  tended to yield better agreement with the CT-based method, especially for female patients, than did
  , which is the most available SUL formulation used today. It is anticipated that the new LBM-adjusted SUV, which is also recommended in version 2.0 of the European Association of Nuclear Medicine guidelines for tumor imaging, can improve the accuracy and consistency of SUL calculations in research and clinical practice.
DISCLOSURE
No potential conflict of interest relevant to this article was reported.
Acknowledgments
We greatly appreciate the assistance of the nuclear medicine technicians at Rikshospitalet, Oslo University Hospital.
Footnotes
Published online Mar. 29, 2018.
REFERENCES
- Received for publication November 8, 2017.
- Accepted for publication December 24, 2017.


