


Abstract
The utility of 99mTc-tetrofosmin myocardial SPECT for assessment of pulmonary hypertension and right ventricular thickness has not been well studied. We hypothesized that a ratio of right ventricular activity to left ventricular activity (RV/LV uptake ratio) from SPECT myocardial perfusion images could identify the presence of increased right ventricular wall thickness and elevated systolic pulmonary artery pressure with or without the use of attenuation correction. Methods: We identified 33 patients with normal findings on stress 99mTc-tetrofosmin left ventricular myocardial perfusion imaging who had a complete 2-dimensional echocardiographic study within 3 wk of the SPECT study. Two 6 × 6 pixel regions of interest were placed in the right and left ventricular free walls of both non–attenuation-corrected and attenuation-corrected SPECT images. We examined the correlation of RV/LV uptake ratio with echocardiographic right ventricular free-wall thickness and with pulmonary artery systolic pressure. Results: RV/LV uptake ratio, measured on non–attenuation-corrected images, correlated significantly with both pulmonary artery systolic pressure (r = 0.63 and P < 0.001) and right ventricular wall thickness (r = 0.6 and P < 0.001). Receiver-operating-characteristic analysis of the use of RV/LV uptake ratio to detect significant pulmonary hypertension showed that the area under the curve was 0.78 (95% confidence interval, 0.62–0.95). However, no significant correlation of RV/LV uptake ratio with pulmonary artery systolic pressure or right ventricular wall thickness was found on attenuation-corrected images. Conclusion: RV/LV uptake ratio measured on SPECT images can be used to identify patients with high pulmonary artery pressure or right ventricular hypertrophy.
Patients with pulmonary hypertension often present with symptoms similar to those of patients with coronary artery disease. Dyspnea is generally present in these patients, and many also complain of anginal chest pain, fatigue, and syncope (1). Consequently, patients with pulmonary hypertension may be referred for a myocardial perfusion scan for symptom assessment. Tomographic images of the right ventricle are readily available after stress 99mTc SPECT perfusion studies. These images are inspected visually and may reveal prominent right ventricular uptake of the 99mTc-labeled perfusion tracer or features suggestive of right ventricular dilation.
Although these finding may provide clues to underlying right ventricular volume or pressure overload, subjective interpretation of the images may be limited by significant interreader variability and limited diagnostic accuracy.
The utility of myocardial SPECT for assessment of right ventricular hypertrophy and pulmonary hypertension has not been extensively studied. Previous studies using both quantitative (e.g., ratio of right ventricular activity to left ventricular activity [RV/LV uptake ratio]) and nonquantitative (e.g., septal flattening) methods have produced conflicting results. One study, using nonquantitative methods, showed poor overall agreement between 99mTc SPECT and 2-dimensional (2D) echocardiography regarding right ventricular dilation and hypertrophy (2). However, the presence of interventricular septal flattening during gated SPECT correlated with echocardiographic evidence of pulmonary hypertension and right ventricular overload (3).
An early study using 201Tl demonstrated a correlation of a quantitative measurement of right ventricular wall thickness with clinical and electrocardiographic evidence of right ventricular hypertrophy (4). A later study used a calculated RV/LV uptake ratio obtained by 99mTc-sestamibi imaging and showed a significant relationship between the SPECT findings and invasively measured pulmonary artery pressure (5). Increased right ventricular uptake assessed by an RV/LV uptake ratio measured from 99mTc-sestamibi SPECT images has also been shown to correlate with right ventricular pressure overload and pulmonary hypertension in patients with coronary disease (6).
Attenuation-corrected SPECT images are increasingly used in clinical practice. In the present study, both attenuation-corrected and non–attenuation-corrected stress images were used to measure the RV/LV uptake ratio and to determine whether this quantitative method can be used to assess pulmonary artery pressure and right ventricular wall thickness. To our knowledge, analyses of the correlation of right ventricular perfusion tracer uptake with pulmonary artery pressure and with right ventricular wall thickness have not been done previously for attenuation-corrected images.
MATERIALS AND METHODS
Patient Selection
We identified 33 patients who underwent both 99mTc-tetrofosmin perfusion stress imaging and echocardiography at University Hospital during the period from August 2007 to March 2008. These patients had a complete echocardiographic study (including 2D imaging and Doppler interrogation) within 3 wk of the SPECT study. All patients had normal perfusion scan results, with no evidence of left ventricular ischemia or infarction. Patients with incomplete echocardiographic studies or insufficient image quality for accurate measurement of systolic pulmonary artery pressure and right ventricular thickness were excluded from this study.
SPECT Myocardial Perfusion Imaging
Patients were tested in the fasting state. A single-day rest–stress imaging protocol was used. Patients underwent treadmill exercise testing by a modified Bruce protocol. Patients who could not exercise to target heart rate underwent pharmacologic stress with 0.56 mg/kg intravenous dipyridamole over 4 min or intravenous dobutamine at incremental doses of 5, 10, 20, 30, 40, and 50 μg/kg/min at 3-min intervals. At peak dynamic exercise, peak dobutamine-induced tachycardia, or 4 min after dipyridamole infusion, the patient was injected with 925–1,295 MBq (25–35 mCi) of 99mTc-tetrofosmin. Fifteen to 30 min later, SPECT myocardial perfusion images were acquired on a dual-head γ-camera (E.CAM; Siemens Medical Solutions) equipped with high-resolution collimators. Simultaneous transmission scans were acquired using arrays of 153Gd sources aligned across from the camera detectors (Profile; Siemens Medical Solutions Inc.). Images were reconstructed with and without attenuation correction using dedicated nuclear cardiology software (E.SOFT; Siemens Medical Solutions, Inc.). Emission data were collected with a 15% window centered on a 140-keV photopeak. 153Gd transmission images were acquired with a 20% window around a 100-keV photopeak. Images were acquired over 32 stops for each head, using a circular orbit, at 25 s per stop.
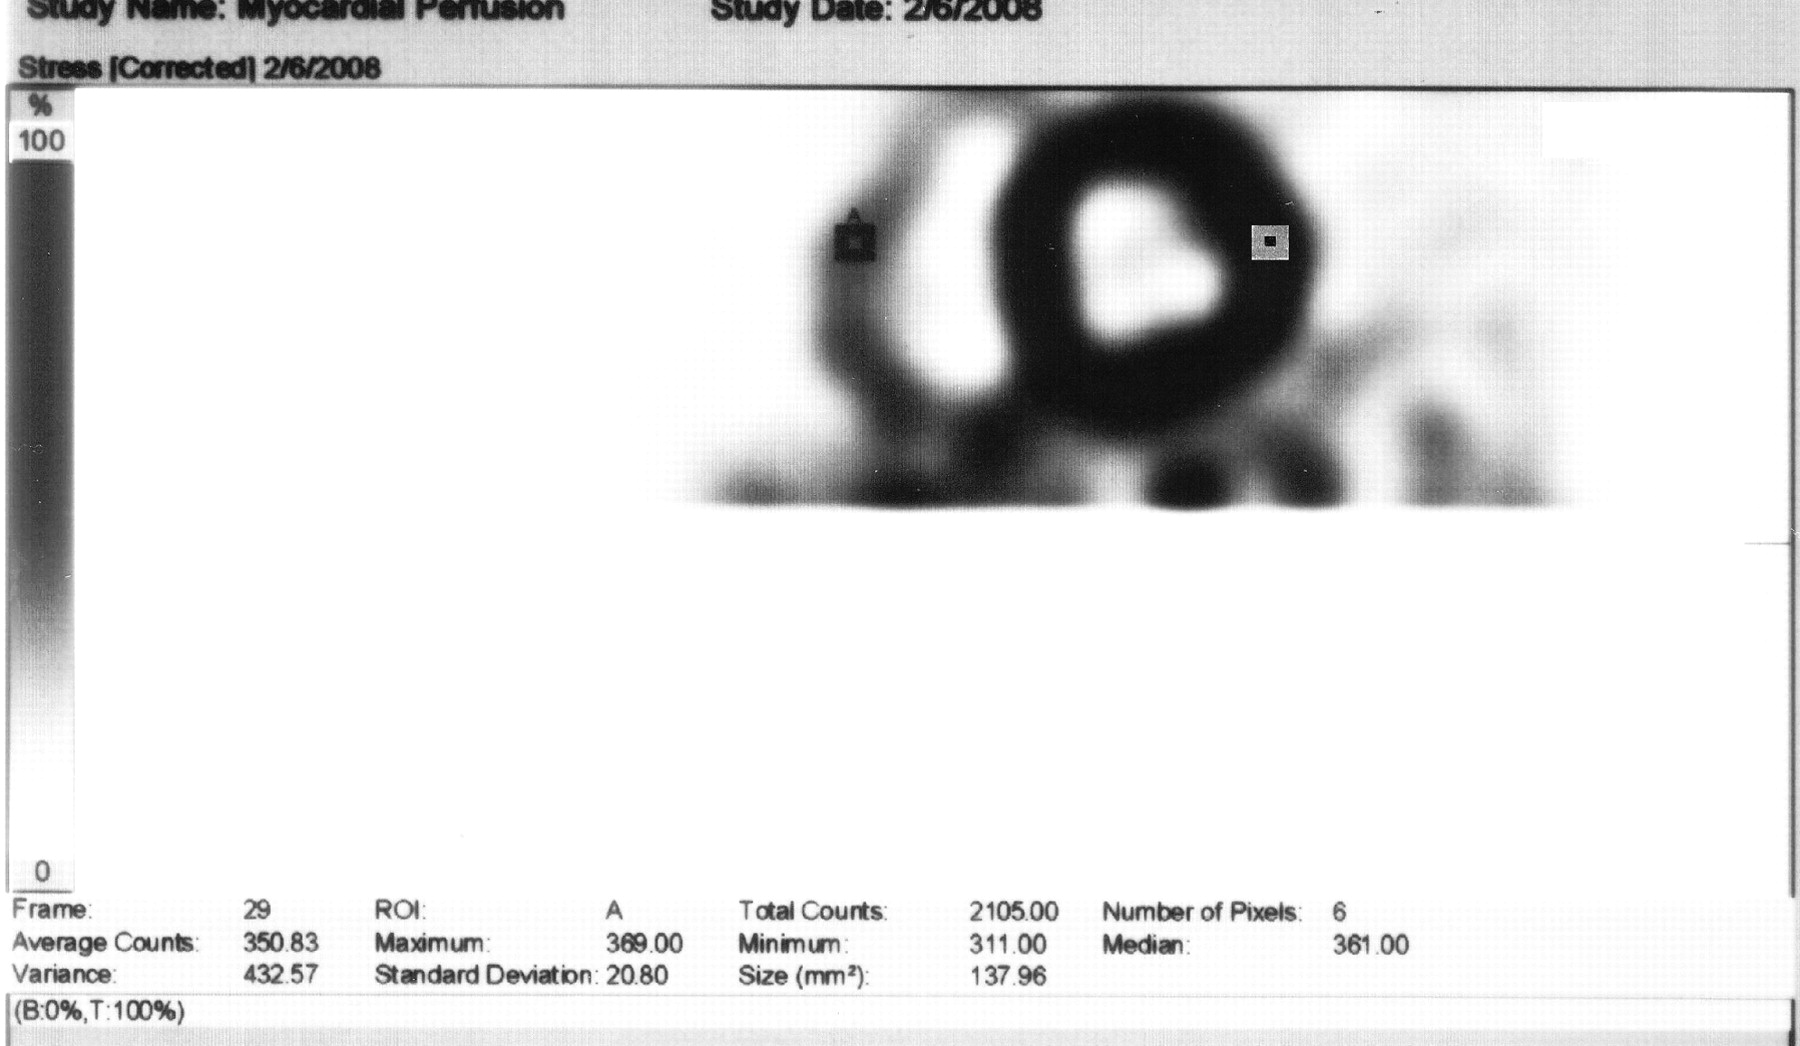
Only stress images were used for measurement of myocardial counts and calculation of RV/LV uptake ratio. From a midventricular tomographic slice, an investigator with no knowledge of the clinical or echocardiographic data placed 6 × 6 pixel regions of interest in the middle of the right ventricular free wall and the middle of the left ventricular lateral wall (Fig. 1). Myocardial counts were determined in each region of interest, and the RV/LV uptake ratio was calculated.

Selection of region of interest in lateral free wall.
2D Echocardiography
Resting 2D echocardiography was performed according to the standard clinical protocol used in the University Hospital Echocardiography Laboratory. The studies were performed by experienced sonographers and included M-mode (parasternal view) and 2D views from the parasternal, apical, suprasternal, and subcostal windows. Continuous, pulsed-wave, and color Doppler was performed to assess for tricuspid regurgitation and to measure Doppler velocities across the tricuspid valve.
Right ventricular free-wall thickness was measured using either M-mode or 2D imaging at the peak of the R wave at the level of the tricuspid valve chordae tendineae as suggested by the American Society of Echocardiography (7). Pulmonary artery systolic pressure was estimated using the modified Bernoulli equation based on the maximal velocity across the tricuspid valve. The right atrial pressure component of the pulmonary artery pressure estimate was based on the inferior vena cava size and respirophasic status (normal, blunted, or absent), as recommended by the American Society of Echocardiography (8). These measurements were performed by a study investigator trained in the field of echocardiography, who did not know the patients’ scintigraphic and clinical data.
The 2009 American College of Cardiology Foundation/American Heart Association Consensus Document on Pulmonary Hypertension recommends further evaluation for pulmonary hypertension in patients with an estimated right ventricular systolic pressure of greater than 40 mm Hg by echocardiography (9). A cut point of 40 mm Hg or greater was selected as the threshold for abnormality in the present study.
Statistical Analysis
Statistical analysis was performed on a personal computer using SPSS 16.0 (SPSS Inc.). Data for continuous variables are expressed as mean ± SD. The Pearson correlation coefficient was used to determine the relationship between right ventricular wall thickness, pulmonary artery systolic pressure, and RV/LV count ratio. A Student t test was used to compare the differences between patients with and without pulmonary hypertension. Receiver-operating-characteristic analysis was used to determine the accuracy of the RV/LV uptake ratio for diagnosis of significant pulmonary hypertension. All tests were 2-sided, and a P value of 0.05 or less was considered statistically significant.
RESULTS
A total of 33 subjects (11 men and 22 women) was included in the analysis. The mean patient age was 60 ± 16 y (range, 23–93 y). Six patients (18%) had a history of pulmonary diseases (e.g., chronic obstructive pulmonary disease), and 23 patients (70%) had a history of hypertension (Table 1). Twenty-three patients completed both imaging studies within 1 d (10 patients on the same day and 13 patients within 1 d). Twenty patients underwent pharmacologic stress with intravenous dipyridamole. Ten patients underwent an exercise stress test, and 3 patients had dobutamine stress testing. The imaging findings are summarized in Table 2.
Baseline Characteristics
Imaging Findings
SPECT Images with No Attenuation Correction
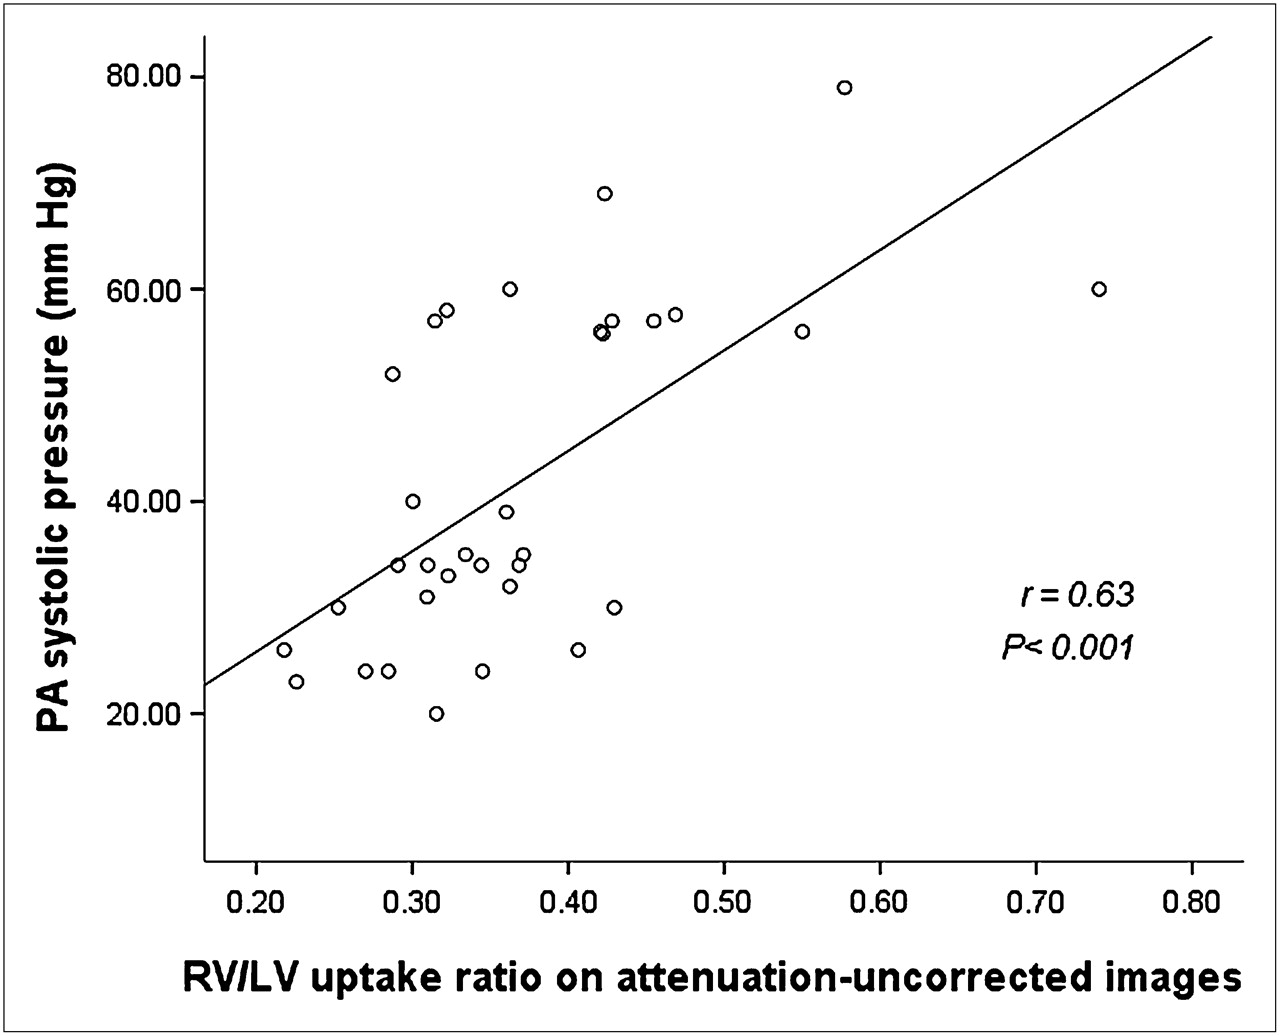
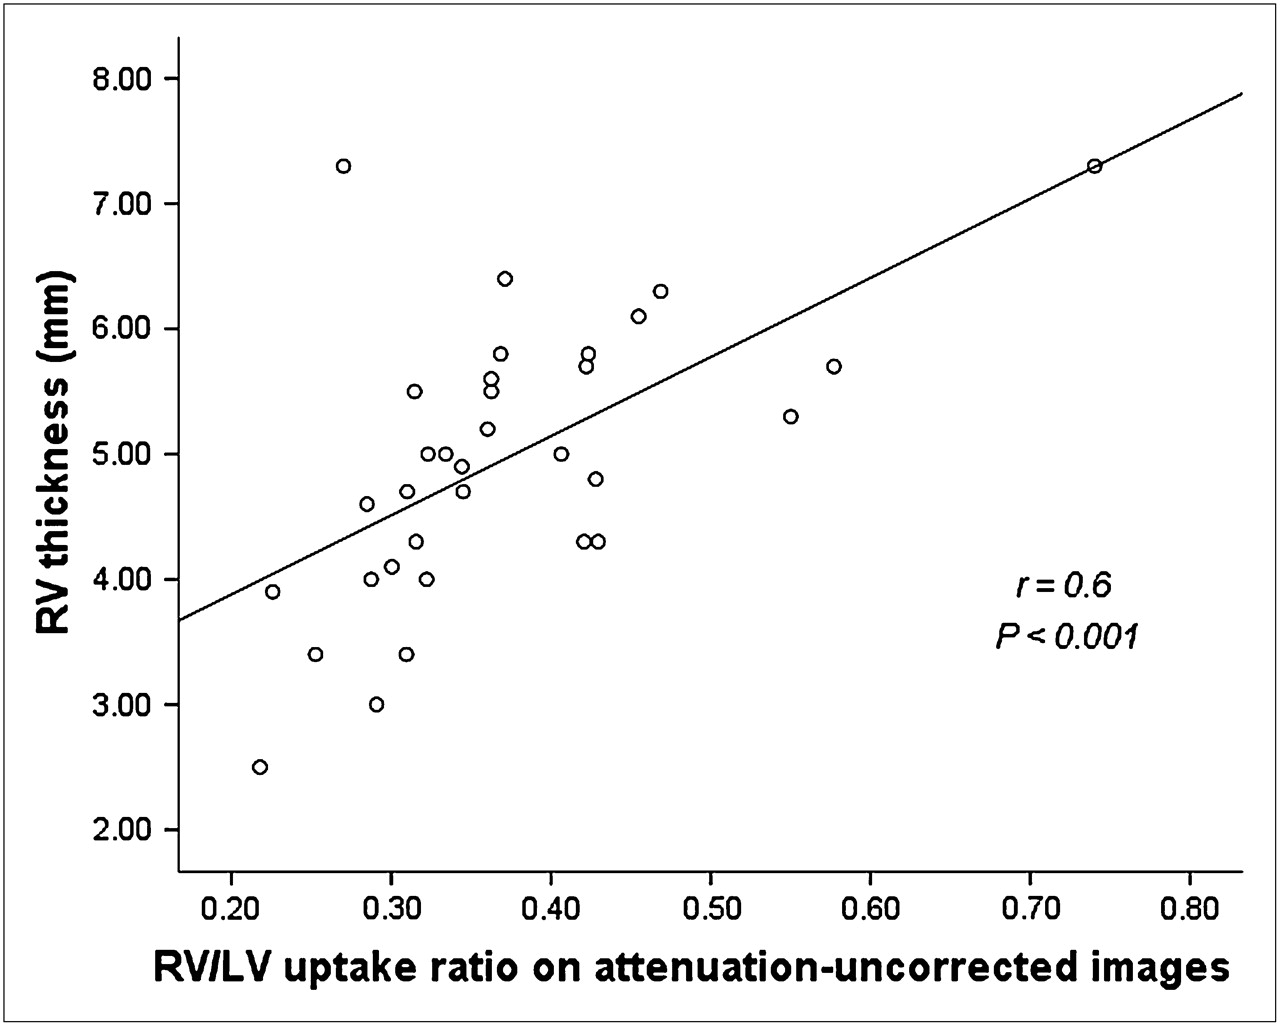
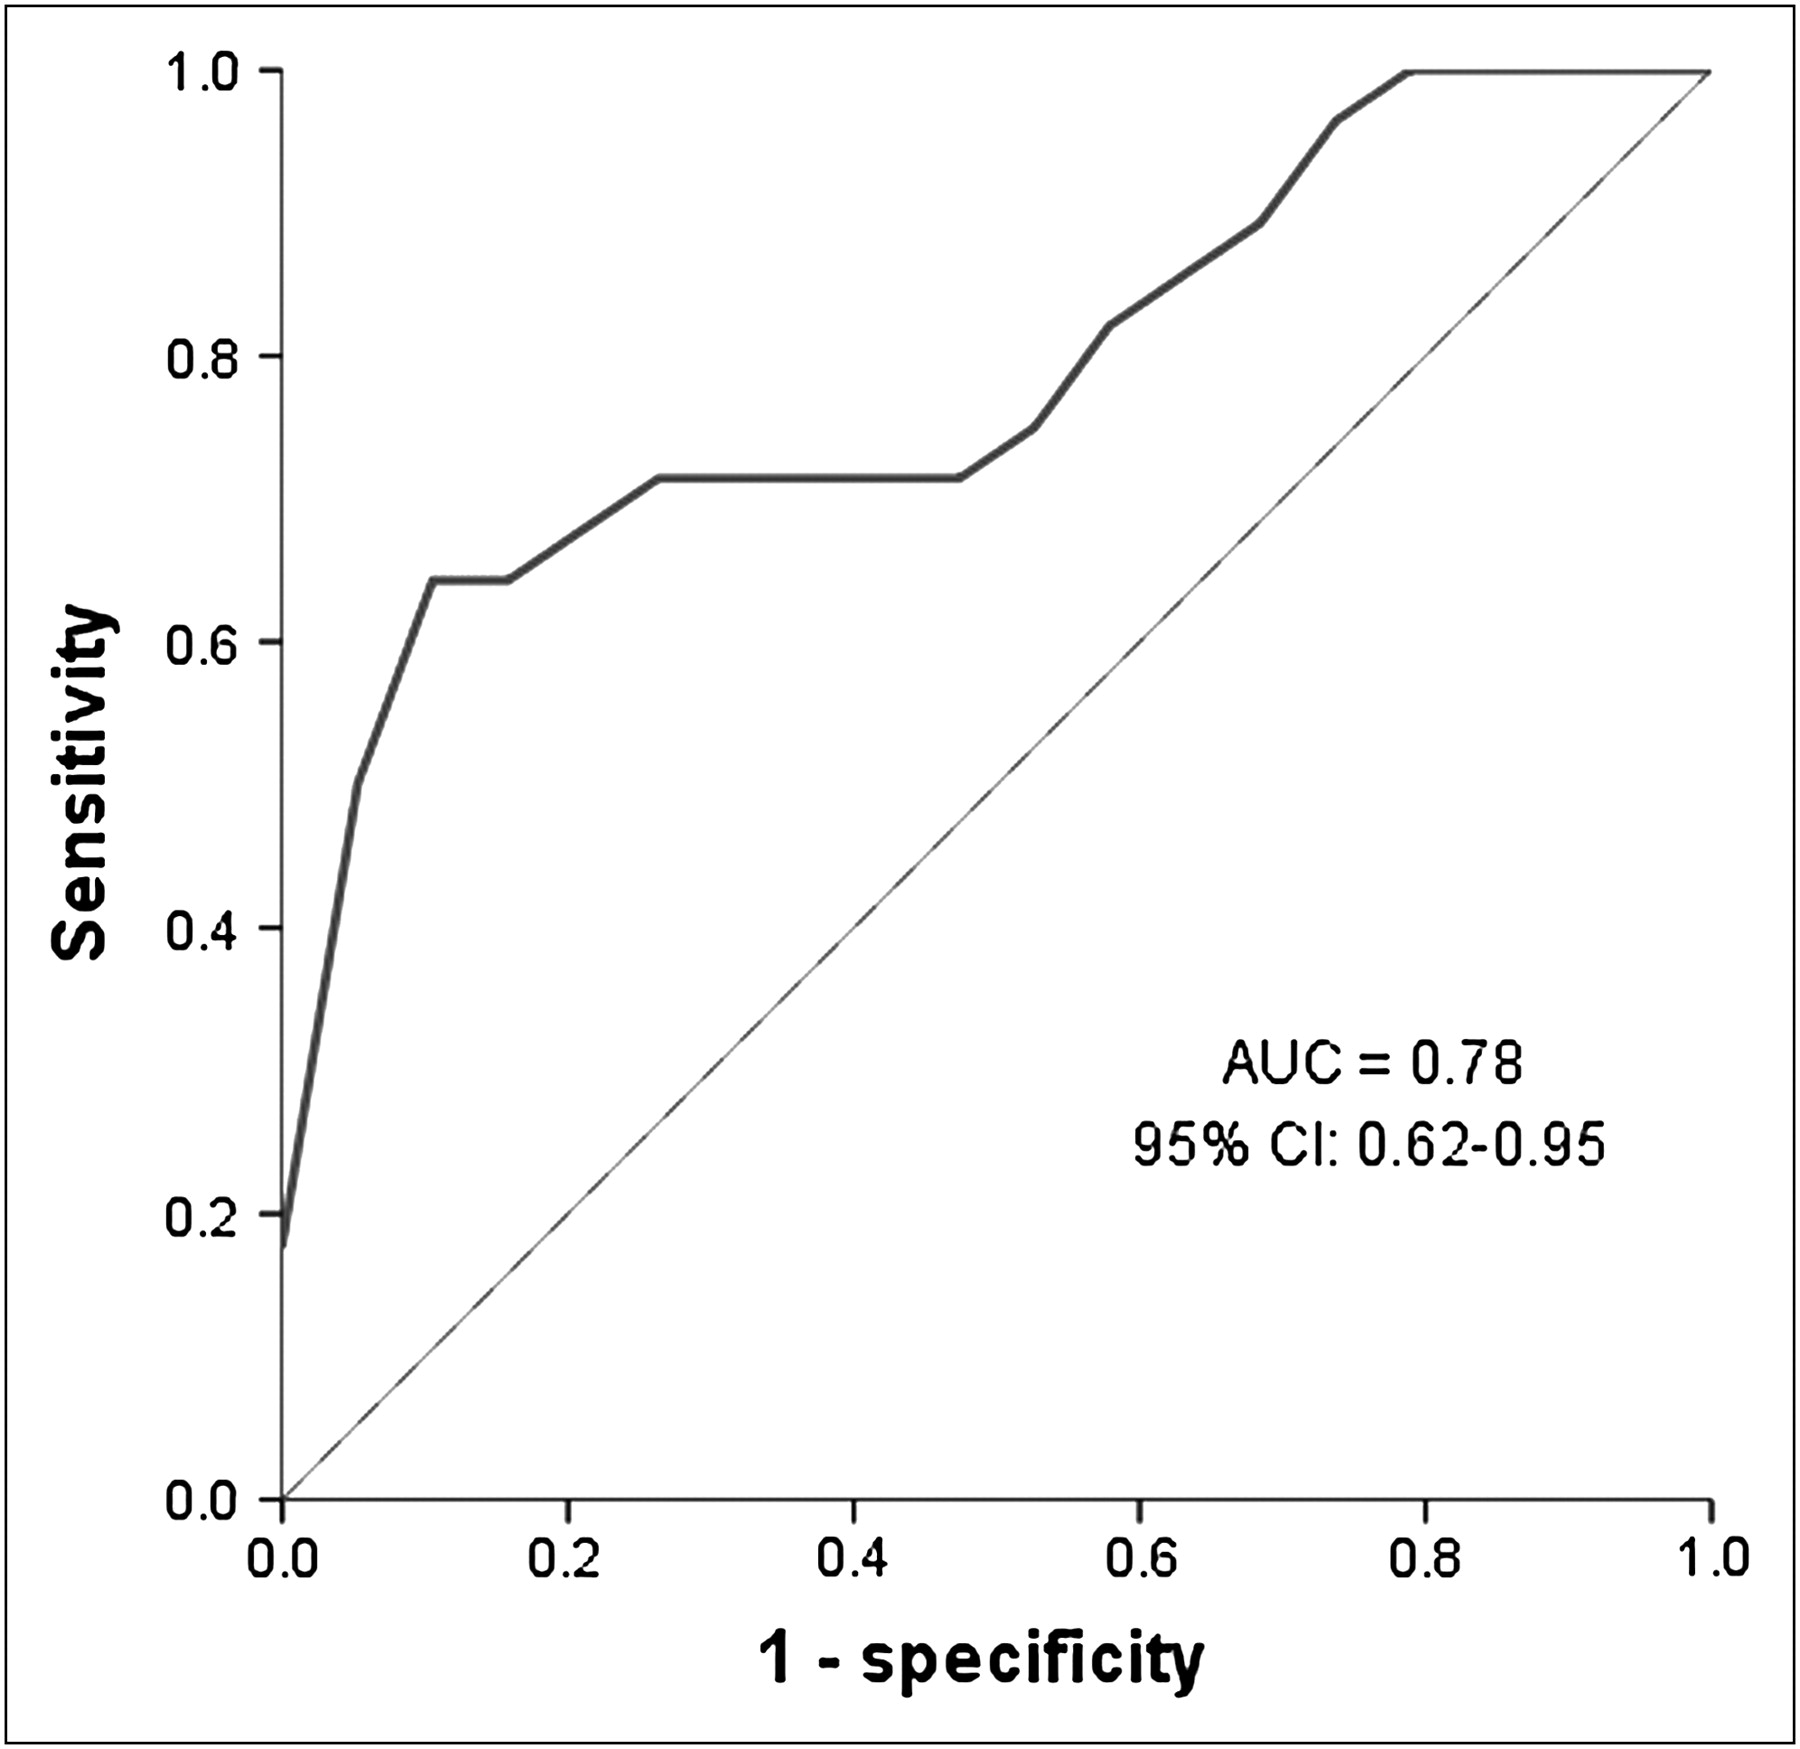
There was a significant correlation between RV/LV uptake ratio and both pulmonary artery systolic pressure (r = 0.63 and P < 0.001) and right ventricular wall thickness (r = 0.6 and P < 0.001) (Figs. 2 and 3). Using an estimated pulmonary artery systolic pressure greater than or equal to 40 mm Hg by echocardiography as significant pulmonary hypertension, 14 patients (42%) had significant elevation of systolic pulmonary pressure and 19 patients (58%) had no significant elevation. There was a significant difference in RV/LV uptake ratio between the 2 groups on non–attenuation-corrected SPECT images. Receiver-operating-characteristic analysis of detection rate for significant pulmonary hypertension (i.e., estimated pulmonary artery systolic BP ≥ 40 mm Hg) showed the area under the curve from the non–attenuation-corrected RV/LV uptake ratios to be 0.78 (95% CI, 0.62–0.95) (Fig. 4). The sensitivities and specificities at various cutoffs of the RV/LV ratio for identification of a pulmonary artery pressure greater than or equal to 40 mm Hg are shown in Table 3.

Correlation of RV/LV ratio with pulmonary artery (PA) systolic pressure in non–attenuation-corrected images.

Correlation of RV/LV ratio with right ventricular wall thickness in non–attenuation-corrected images.

Receiver operator analysis using RV/LV uptake ratio, on non–attenuation-corrected images, for detecting significant pulmonary hypertension.
Sensitivity and Specificity of RV/LV Ratio for Detection of Significant Pulmonary Hypertension
Attenuation-Corrected SPECT Images
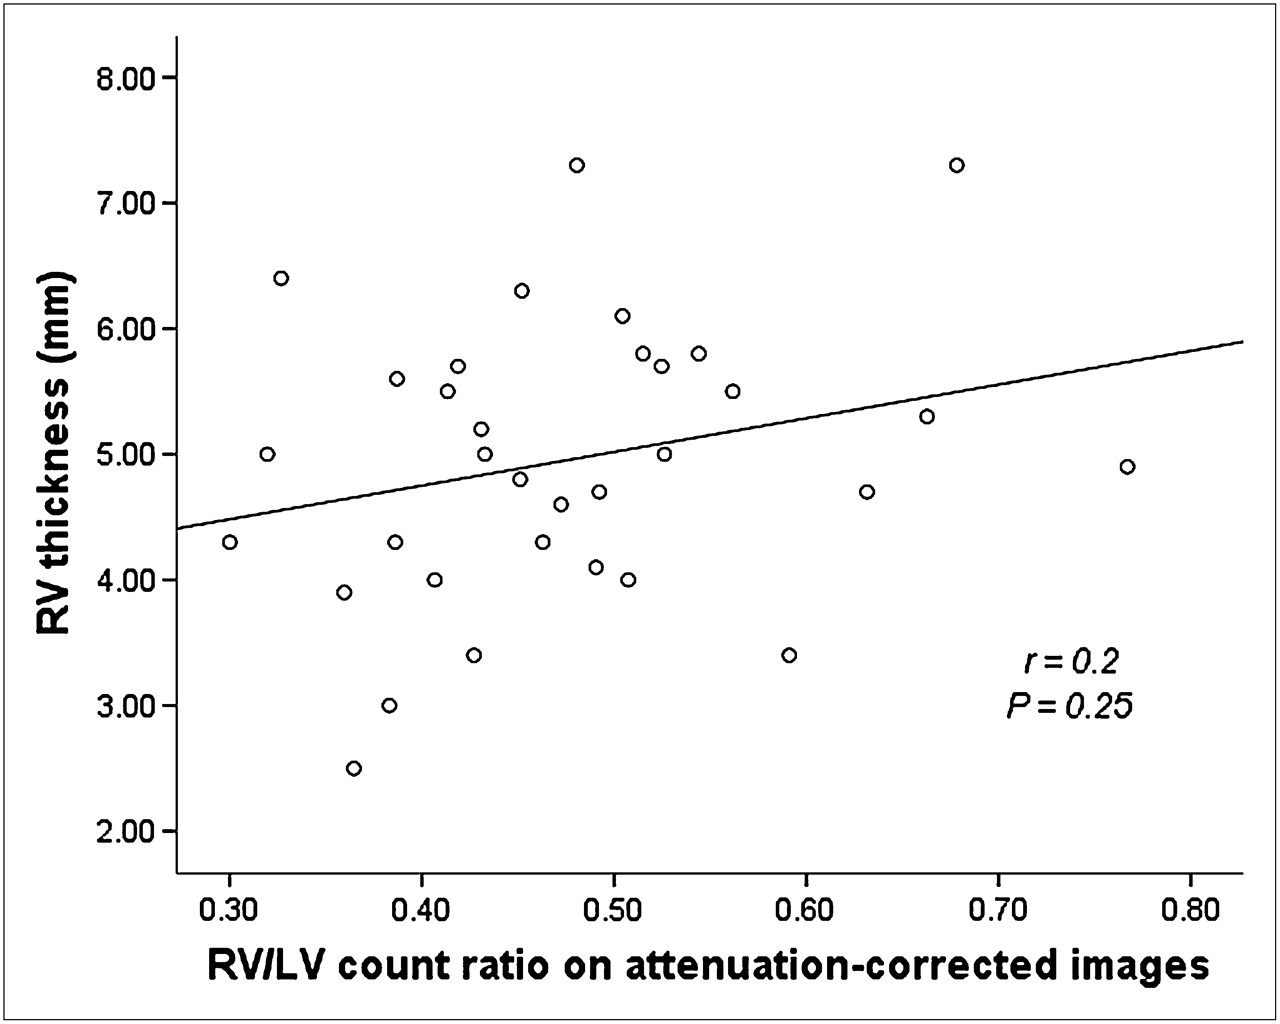
There was no significant correlation between RV/LV uptake ratio and pulmonary artery systolic pressure (r = 0.27, P = 0.27) or right ventricular wall thickness (r = 0.25, P = 0.2) on attenuation-corrected images (Figs. 5 and 6). There was no statistically significant difference in the RV/LV ratio between patients with a pulmonary artery systolic pressure greater than or equal to 40 mm Hg and those with a pressure less than 40 mm Hg (Table 4).
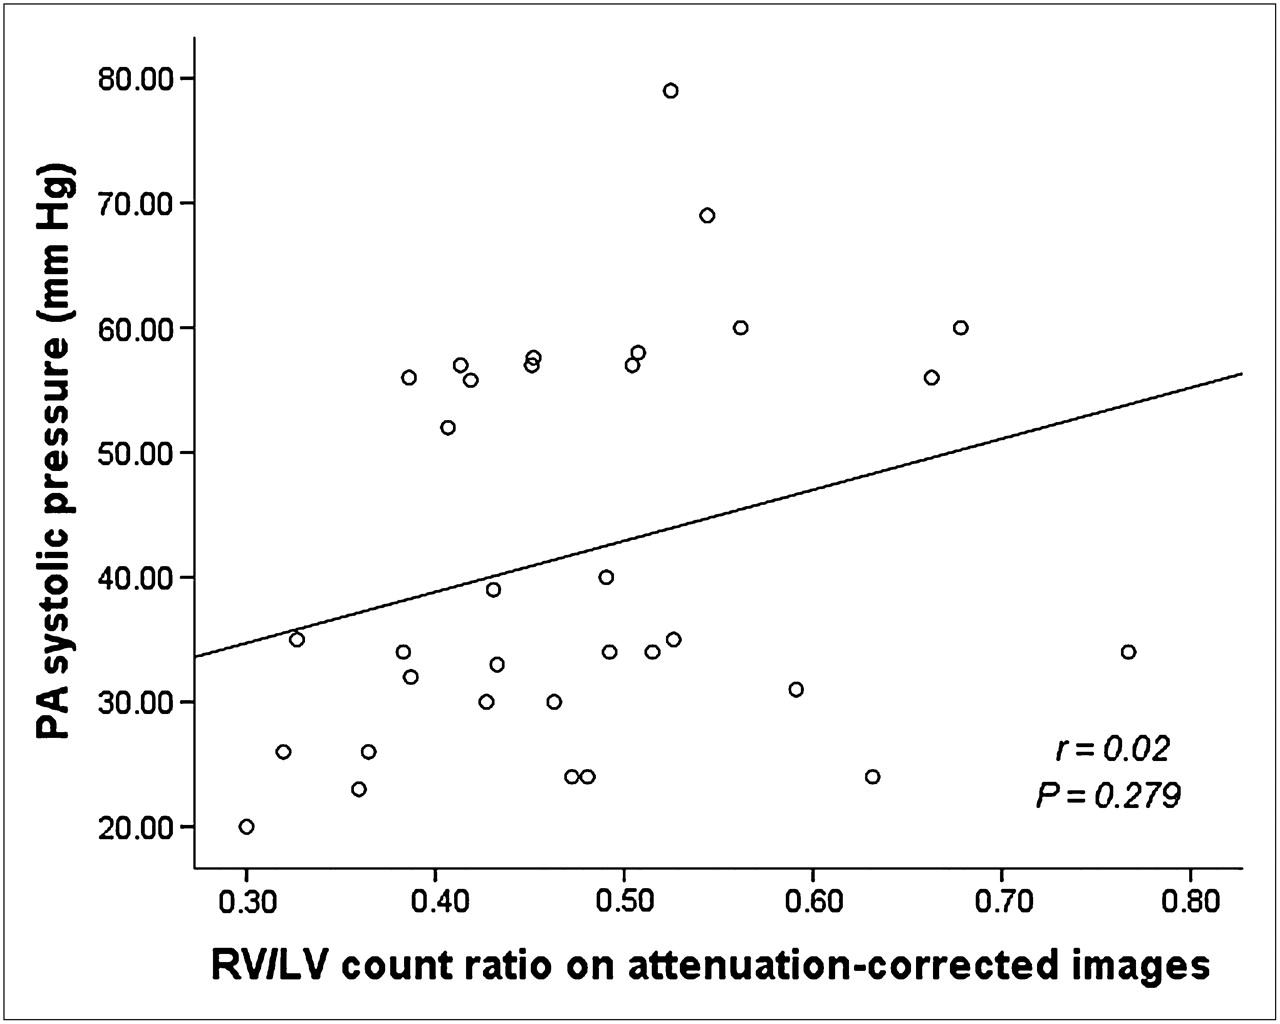
Correlation of RV/LV ratio with pulmonary artery (PA) systolic pressure on attenuation-corrected images.

Correlation of RV/LV ratio with right ventricular wall thickness on attenuation-corrected images.
RV/LV Uptake Ratio Among Patients with Abnormal and Normal Estimated Systolic Pulmonary Artery Pressures
DISCUSSION
Diagnosis of pulmonary hypertension is often delayed because of nonspecific symptoms that overlap with other conditions, including coronary artery disease. Any noninvasive test that can reliably detect the presence of high pulmonary artery pressure is potentially valuable for diagnostic purposes and for follow-up of patients with pulmonary and cardiac diseases.
The results of this study confirm the ability of quantitative 99mTc-tetrofosmin SPECT analysis to detect pulmonary hypertension. In the present study, an RV/LV ratio of 0.35 on non–attenuation-corrected SPECT images had a sensitivity of 72% and a specificity of 70% for detection of significant elevation of pulmonary artery pressure (i.e., estimated pulmonary artery systolic BP ≥ 40 mm Hg). Different cutoffs for RV/LV ratio (Table 3) may be combined with other clinical findings to direct clinicians in the selection of subsequent diagnostic and therapeutic strategies.
Another important finding from this study is the lack of correlation between attenuation-corrected RV/LV ratio and estimated pulmonary artery pressure and right ventricular thickness by echocardiography. Attenuation correction is increasingly used in nuclear cardiology to improve diagnostic accuracy and improve specificity. However, the right ventricle appears more prominent in attenuation-corrected images than in non–attenuation-corrected images and may be incorrectly interpreted as demonstrating the presence of right ventricular hypertrophy (10,11). The findings of the present study indicate that the RV/LV ratio calculated from images that were attenuation-corrected by a multiple point transmission source method cannot be reliably used to detect pulmonary hypertension and right ventricular hypertrophy.
This is the first study, to our knowledge, that has assessed the effect of attenuation correction on calculating RV/LV ratio and its correlation with pulmonary artery pressure and right ventricular thickness. Although it seemed plausible that the attenuation correction algorithm might treat both the right ventricle and the left ventricle similarly, our results suggest a disproportionate change in right ventricular relative to left ventricular counts in attenuation-corrected images. This disproportion leads to a more prominent right ventricle in attenuation-corrected images and changes in the RV/LV ratio that apparently reduce the accuracy of the ratio for estimating pulmonary artery pressure or right ventricular thickness.
The reason that attenuation-corrected RV/LV count ratios failed to accurately predict echocardiographic right ventricular wall thickness and pulmonary artery systolic pressure is not clear. Quantification of tracer uptake from SPECT images was likely affected by several factors, including scattered radiation, partial-volume errors, and photon attenuation. The resolution of SPECT images (12–16 mm) exceeds the normal right ventricular wall thickness of 5 mm, resulting in a partial-volume artifact. This partial-volume effect makes direct measurement of right ventricular wall thickness unreliable (12). This limitation can best be overcome by assessing right ventricular hypertrophy on the basis of the count density in the ventricular wall. Additionally, the right ventricle has a complex geometry and contraction pattern. It is located at different distances for each projection angle, leading to a different resolution for each projection. These artifacts diminish the accuracy of quantitative measurements. We would also speculate that because right ventricular wall thickness is normally less than left ventricular wall thickness, any statistical noise in the data collected in the transmission window may more adversely affect the accuracy of the count density determination for the lower-count right ventricle than for the higher-count left ventricle.
Attenuation correction validation studies, to our knowledge, have been performed only for the left ventricle (13). On the basis of the results of this study and previous observations, we believe that it is reasonable to use only non–attenuation-corrected images to assess right ventricular hypertrophy and estimate pulmonary artery hypertension.
LIMITATIONS
The limitations of this study are those inherent to retrospective studies of small populations, and larger prospective studies are needed to confirm our findings. In our study, myocardial SPECT and 2D echocardiography were not performed simultaneously. However, most patients completed both imaging studies within 1 d. Additionally, this study was performed without using a gold standard (i.e., right heart catheterization) for determining the pulmonary pressure. However, echocardiography is a pivotal test for screening for pulmonary hypertension, and it is frequently used to estimate pulmonary pressures and right ventricular hypertrophy (9). Additionally, we excluded patients with scintigraphic evidence of coronary disease. The RV/LV ratio cannot be applied to patients with evidence of lateral wall hypoperfusion. The results of this study are based on attenuation correction data obtained from arrays of 153Gd point sources, and the correction was performed using a specific software program (E.SOFT). These results cannot be generalized to other attenuation correction methods.
CONCLUSION
Quantitative analysis of 99mTc-tetrofomin myocardial SPECT images may be useful for detection of pulmonary hypertension and right ventricular hypertrophy in patients with cardiac and pulmonary diseases. On the basis of the present findings, we cannot recommend analysis of right ventricular wall thickness and pulmonary artery pressure from attenuation-corrected images.
Acknowledgments
This work was supported in part by a grant from the John R. Strauss Fund for Research and Education in Cardiac Imaging.
REFERENCES
- Received for publication June 16, 2010.
- Accepted for publication August 9, 2010.


Jump to section
Related Articles
Cited By...
- No citing articles found.