


Abstract
This work addresses the issue of using 18F-FDG PET in patients with renal failure. Methods: A model analysis has been developed to compare tissue 18F-FDG uptake in a patient who has normal renal function with uptake in a theoretic limiting case that assumes tracer plasma decay is tracer physical decay and is trapped irreversibly. Results: This comparison has allowed us to propose, in the limiting case, that the usually injected activity be lowered by a factor of 3. We also proposed that the PET static acquisition be obtained at about 160 min after tracer injection. These 2 proposals were aimed at obtaining a similar patient radiation dose and similar tissue 18F-FDG uptake. Conclusion: In patients with arbitrary renal failure (i.e., between the 2 extremes of normal function and the theoretic limiting case), we propose that the injected activity be lowered (without exceeding a factor of 3) and that the acquisition be started between 45 and 160 min after tracer injection, depending on the severity of renal failure. Furthermore, the model also shows that the more severe the renal failure is, the more overestimated is the standardized uptake value, unless the renal failure indirectly impairs tissue sensitivity to insulin and hence glucose metabolism.
An 18F-FDG PET examination begins with the intravenous injection of the tracer. Then, from blood, the tracer enters tissue cells, where it is phosphorylated and hence trapped. Conversely, the tracer can be dephosphorylated and therefore can go back to the blood while being simultaneously cleared from the blood by the kidneys. For simplicity, the 18F-FDG blood time–activity curve can be assumed to exponentially decrease within a time period T1/2. The value of this constant is critical since it is required to manage the acquisition timing (1,2) and to assess the tracer residence time (τ = 1.44 T1/2), which is involved in the patient radiation dose (3–5).
To the best of our knowledge, the issue of how to use 18F-FDG PET in patients with renal failure has not yet been considered, except when intravenous CT contrast material is to be applied (6). The aim of this work was to establish a model describing tissue 18F-FDG uptake in a theoretic limiting case that has allowed us to propose landmark injected activities and acquisition timings for use in clinical practice to reduce the radiation dose to the patient and medical staff.
MATERIALS AND METHODS
The limiting case is defined by theoretic conditions that lead, after an arbitrary 18F-FDG injected activity, to the highest possible patient radiation dose and the longest possible time to peak tracer activity in the tissue. The first condition (highest possible dose) is fulfilled by assuming that the tracer plasma decay is the tracer physical decay (no biologic decay). The second condition (longest possible time to peak) is fulfilled with the first condition and by assuming that the tracer is trapped irreversibly.
In patients with normal renal function, a 2-compartment model (the blood pool is counted as 1 compartment) has been proposed to quantify the 18F-FDG uptake rate in tissues, assuming the tracer is trapped irreversibly (1). At the steady state, the rate of trapped tracer change per tissue volume unit dCT/dt is Eq. 1where K is the uptake rate constant, λ is the 18F physical decay constant (λ = Log2/110 min−1), and Cp(t) is the tracer concentration in the plasma at any time t. For simplicity, let us assume that Cp(t) decays monoexponentially:
 Eq. 2with α = (Log2)/T1/2. In patients with normal renal function, T1/2 involves both the physical and the biologic decay of the tracer. Furthermore, Cp(t = 0) is usually assessed by the ratio of the injected activity to the patient's weight, assuming that the patient's weight is proportional to the patient's volume (Cp(t = 0) ≈ Ainj/W) (7). The solution of Equation 1 is
 Eq. 3
Eq. 3
Therefore, the equation of the time–activity curve of trapped 18F-FDG per tissue volume unit is Eq. 4
Eq. 4
Furthermore, let us note that dividing Equation 4 by λCp(t) yields a ratio R, which reflects the tumor-to-background ratio.
In the limiting case, when only the physical decay of the tracer occurs, that is, T1/2 = 110 min (α = λ), the equation of the time–activity curve of trapped 18F-FDG per tissue volume unit becomes Eq. 5
Eq. 5
Furthermore, dividing Equation 5 by λCp(t) yields a ratio R that is quite simple: Eq. 6
Eq. 6
RESULTS
Figure 1 shows the 18F-FDG blood time–activity curves for T1/2 = 110 and 37 min, that is, in the limiting case and in patients without renal failure, respectively. The value of 37 min has been derived from α3 = 0.0125 + 0.0063 min−1 by Hunter et al., when the tracer physical decay is considered (8).
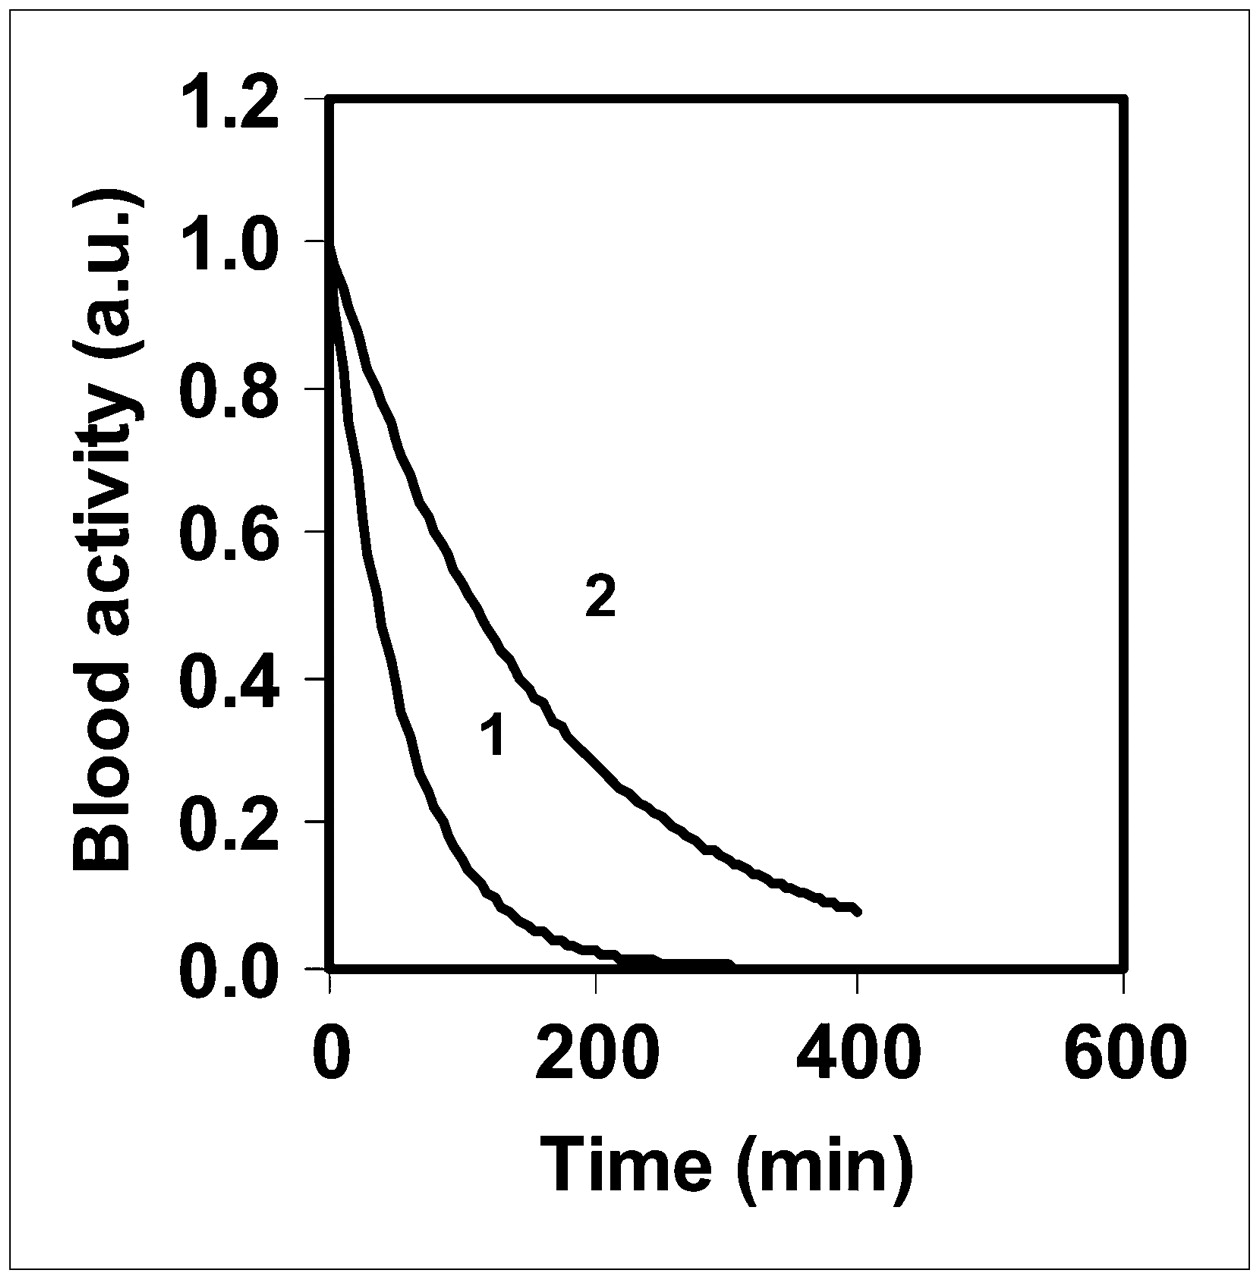
Theoretic 18F-FDG blood time–activity curve for T1/2 = 37 min (patient with normal renal function) (1) and T1/2 = 110 min (limiting case) (2). Value of λCp(t = 0) has been arbitrarily set to 1. a.u. = arbitrary unit.
Figure 2 shows theoretic 18F-FDG tissue time–activity curves from Equation 4 (T1/2 = 37 min) and Equation 5 (T1/2 = 110 min). The value of K has been arbitrarily set to 0.05 min−1 (9). The maximal tracer activity in the tissue occurs at about t = 85 and 160 min, for T1/2 = 37 and 110 min, respectively. At t = 160 min, the value of CT(t) for T1/2 = 110 min is 2.3 times greater than that at t = 45 min for T1/2 = 37 min. At the peak times, the value of CT(t) for T1/2 = 110 min is 1.9 times greater than that for T1/2 = 37 min, respectively. At t = 60 min after 18F-FDG injection, the value of CT(t) for T1/2 = 110 min is 1.4 times greater than that for T1/2 = 37 min. When a triexponential input function is used (patients with normal renal function), the tracer activity peak is near that obtained with a monoexponential input function (<5 min difference).
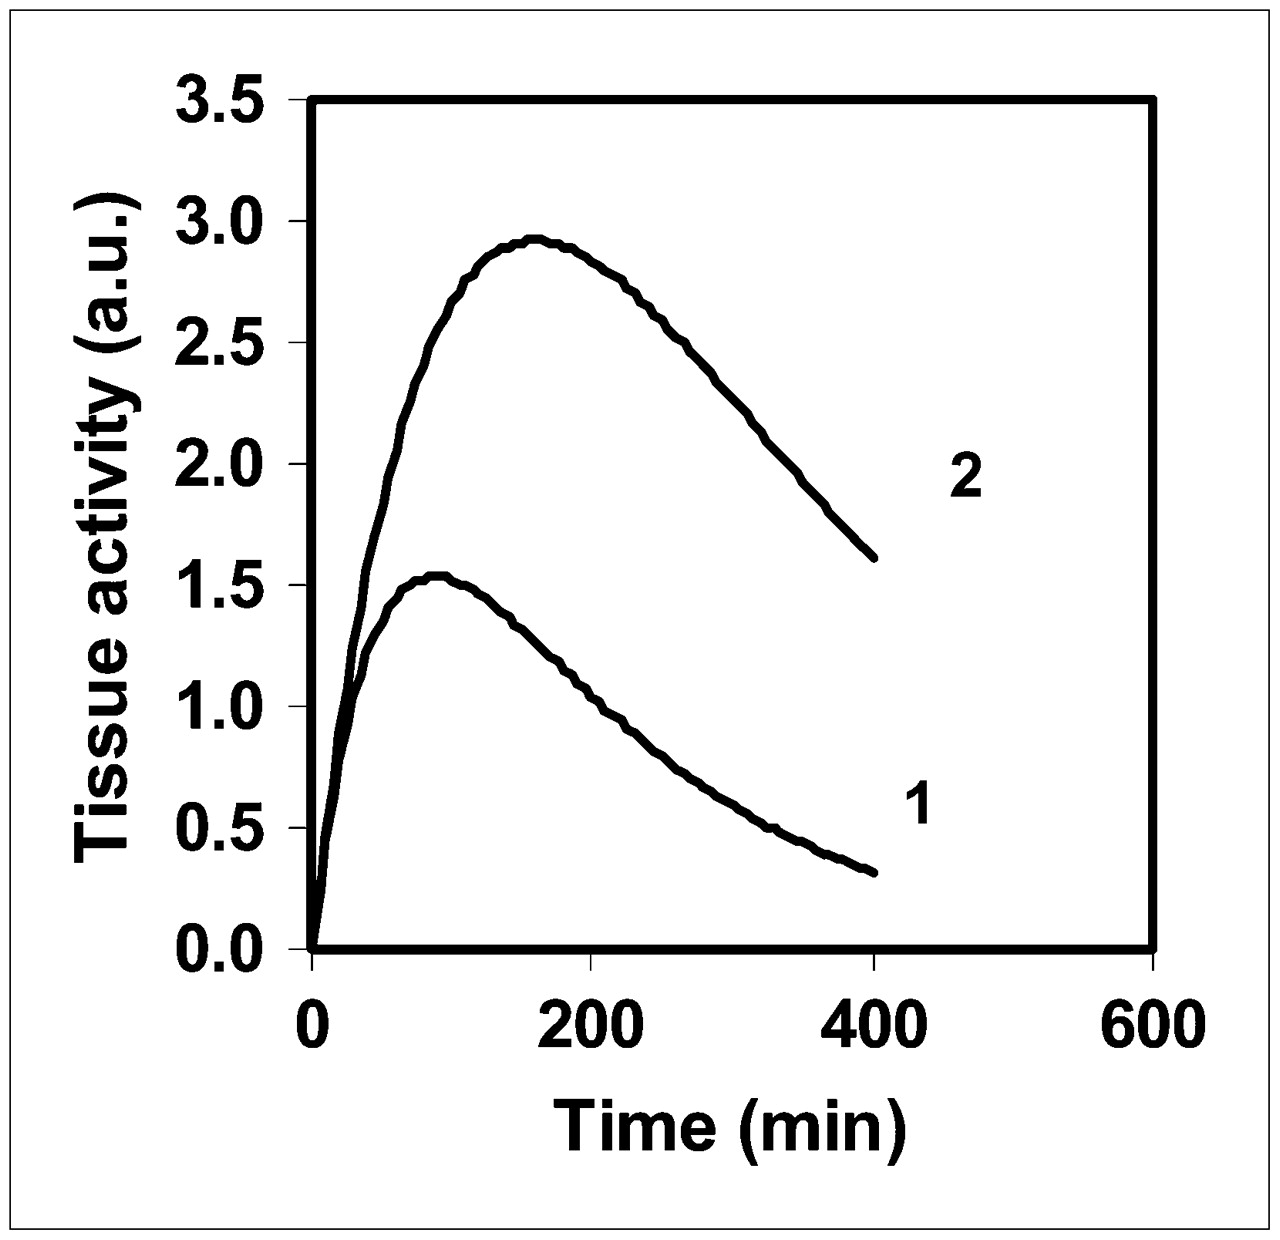
Theoretic 18F-FDG tissue time–activity curve from Equation 4 for T1/2 = 37 min (1) and from Equation 5 for T1/2 = 110 min (2). Values of λCp(t = 0) and K have been arbitrarily set to 1 and 0.05 min−1, respectively. a.u. = arbitrary unit.
The patient radiation dose depends on T1/2 by way of the residence time; consequently, for the same amount of injected activity the factor of increase is about 3 (≈110/37) in the limiting case, compared with patients with normal renal function.
Figure 3 shows the ratio R versus the time delay between injection and acquisition for T1/2 = 37 and 110 min: R is the ratio of the curves in Figure 2 to those in Figure 1. The values of R for T1/2 = 37 min in the 45- to 60-min range are similar to those found for T1/2 = 110 min in the 60- to 90-min range. The value of R for T1/2 = 37 min at t = 45 min is 2.7 times lower than that for T1/2 = 110 min at t = 160 min.
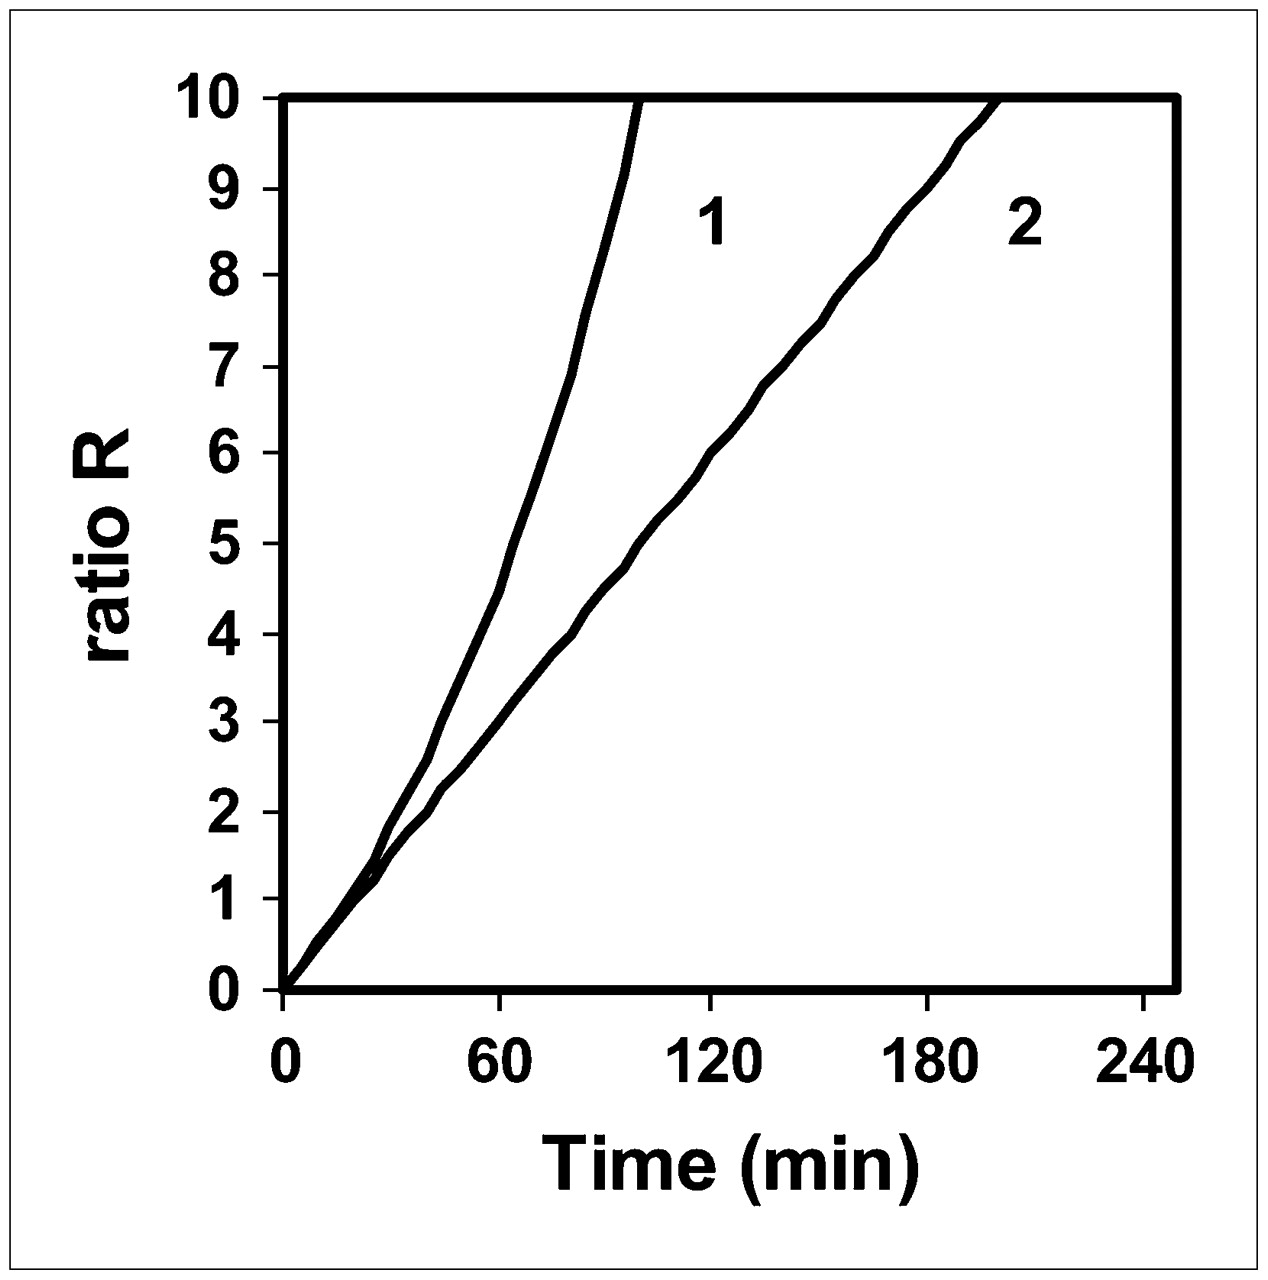
Ratio R vs. time delay between 18F-FDG injection and PET acquisition for T1/2 = 37 min (patient with normal renal function) (1) and T1/2 = 110 min (limiting case) (2).
DISCUSSION
A 2-compartment model has allowed us to compare the time–activity curve of 18F-FDG tissue uptake in patients who have normal renal function with that of a theoretic limiting case that leads to the highest possible patient radiation dose (for an arbitrary injected activity) and the longest possible time to peak tracer activity in tissues. The conditions of this limiting case have been arbitrarily set to define extremes for tracer activities to be injected and acquisition times. The condition of the highest possible patient radiation dose is achieved when one assumes that the plasma decay of the tracer is the tracer physical decay. The second condition is fulfilled with the first condition since the tracer plasma decay is the longest one possible, and the second condition also requires the tracer to be trapped irreversibly because the occurrence of a release rate constant can lessen the time to peak tracer activity (2). An anuric patient might fulfill the first condition but would not fulfill the second condition. Indeed, the anuric-patient radiation dose is the highest possible, even if some tracer is taken up in whole-body tissues; however, this last feature is not exactly compatible with the second condition of the proposed framework, that is, the longest possible time to peak tracer activity in tissues (even if the tracer may be partly released back to the blood). Furthermore, the model presented here assumes that, in patients with normal renal function, the 18F-FDG blood time–activity curve monoexponentially decays after the injection, although it has been shown that the 18F-FDG plasma clearance was triexponential (8). It is suggested that, in a first approximation, the use of a monoexponential input function in this work may be justified: the third exponential function of a triexponential input function represents the major portion of the whole-blood 18F-FDG available to the tumor, 89% by Hunter (8); the 18F-FDG tissue time–activity curves using a tri- or monoexponential input function are similar; and this work emphasizes PET beyond 1 h after the tracer injection, when the third part of a triexponential input function plays the only role.
The comparison of the 18F-FDG tissue time–activity curve in the limiting case with that of a patient who has normal renal function (Fig. 2) shows that the more severe the renal failure is, the longer is the blood tracer availability to the tissue, the greater is 18F-FDG tissue uptake, and the later does tracer activity in the tissue maximize (with a limit of 160 min). This reasoning may be extended to the standardized uptake value (SUV) of a tissue, which includes trapped tracer, that is, CT(t) (Eqs. 4 and 5), and free tracer in the blood and interstitial volumes. Consequently, in patients with renal failure, the tissue SUV should be overestimated (when comparing 2 similar patients with and without renal failure and using similar PET examination parameters). As an example, although free tracer in the blood and interstitial volumes is not considered in the present model, Figure 2 shows that at 60 min after 18F-FDG injection, the tissue SUV might be about 1.4 times greater in the limiting case than in a patient with normal renal function. However, the tissue SUV should be overestimated in patients with renal failure unless the failure indirectly impairs tissue sensitivity to insulin and hence glucose metabolism (10). Indeed, besides results in various tissues showing an SUV overestimation, Minamimoto et al. reported a small but significant decrease of 18F-FDG accumulation in the brains of patients with suspected renal failure, compared with healthy volunteers (11). Although the relationship between kidney disease and insulin resistance of the brain is not known, these authors discussed this particular result with the results of other investigators studying diabetes (12,13).
This work presents 2 extremes, that is, normal renal function and a theoretic limiting case, whereas real patients present a spectrum of renal function between these 2 extremes. Therefore, in current clinical practice, this work leads us to propose landmark injected activities and acquisition times for the use of 18F-FDG PET in patients with renal failure. To obtain a patient radiation dose and tissue 18F-FDG uptake similar to those of patients without renal failure, and to reduce the dose to the medical staff, we suggest that the injected activity be lowered and that the static PET acquisition be obtained later, depending on the severity of renal failure: the more severe the failure, the lower the injected activity and the later the imaging. Although the model does not allow us to accurately propose what activity should be injected and what imaging timing should be used in a patient with arbitrary renal failure (i.e., between the 2 extremes of normal function and the theoretic limiting case), the model nevertheless suggests that it is not necessary to divide the usually injected activity by a factor of more than 3 or to start the imaging beyond t = 160 min after injection. Indeed, the study of the limiting case shows that to obtain a similar radiation dose to that of patients without renal failure, the injected activity should be divided by a factor of 3 and that one cannot fully compensate for such a lowering factor by performing the acquisition at t = 160 min, since the value of CT(t) for T1/2 = 110 min is “only” 2.3 times greater than that at t = 45 min for patients with normal renal function (usual timing in current practice). However, the ratio R, reflecting the tumor-to-background ratio, for T1/2 = 110 min at t = 160 min is 2.7 times greater than that for T1/2 = 37 min at t = 45 min.
CONCLUSION
This work shows that 18F-FDG PET in patients with renal failure can be achieved with an optimized radiation dose, without reducing the tracer tissue uptake: the more severe the renal failure, the lower the injected activity (without exceeding a factor of 3) and the later the imaging (without necessarily beginning the acquisition beyond 160 min after injection). Furthermore, the model also shows that the more severe the renal failure is, the more overestimated is the SUV, unless the renal failure indirectly impairs tissue sensitivity to insulin and hence glucose metabolism.
Acknowledgments
We gratefully acknowledge helpful discussions with Bernard Lambert, GE Healthcare engineers, and Cisbio International and the technical assistance of Henri Dupouy.
Footnotes
-
COPYRIGHT © 2008 by the Society of Nuclear Medicine, Inc.
References
- Received for publication December 5, 2007.
- Accepted for publication September 23, 2008.


Jump to section
Related Articles
Cited By...
- Myelin Imaging of the Spinal Cord in Animal Models and Patients with Multiple Sclerosis Using [11C]MeDAS PET: A Translational Study
- Value of metabolic parameters in distinguishing primary mediastinal lymphomas from thymic epithelial tumors
- Is the Physical Decay Correction of the 18F-FDG Input Function in Dynamic PET Imaging Justified?