


Abstract
In this theoretic note, the rationale for the physical decay correction of the 18F-FDG input function in dynamic PET is investigated, using the Patlak equation as an example. Methods: The Patlak equation conventionally obtained when correcting the 18F-FDG input function and correcting the tissue activity measurement for 18F physical decay can also be derived from a 2-compartment analysis that does not conceptually involve any physical decay correction of the 18F-FDG input function but accounts only for the physical decay of the trapped tracer. Results: We demonstrate that exactly the same equation can be derived from the 2 conceptual approaches, and hence each approach yields the correct uptake rate of the tracer. Conclusion: No advantage in 18F-FDG dynamic PET can be expected from using the concept of uncorrected data rather than that of decay-corrected data. Nevertheless, conceptually, we show that correcting the 18F-FDG input function for radioactive decay cannot be justified and that this correction is not compatible with the calculation of patient radiation dose.
With 18F FDG PET, physicians can measure 18F-FDG uptake and hence obtain insight into the glucose metabolism rate. The increase in the tracer uptake of rapidly proliferating tumors can be assessed either by a semiquantitative analysis, that is, the standardized uptake value (1), or by quantitative kinetic analyses. Different methods of quantitative kinetic analyses have been described (2–7). These methods always require an estimate of the input function, that is, of the blood time–activity curve of the tracer, to determine the quantity of tracer that is made available to the tissues at each time point (8). This input function can be obtained by arterial sampling. Data obtained from blood sampling, that is, the 18F-FDG blood time–activity curve, as well as data from PET, that is, the 18F-FDG tissue time–activity curve, are conventionally corrected for the 18F physical decay (4,9–12). However, after the 18F radioactive decay, (i.e., 18F is transformed into 18O), any blood-borne 18F-FDG molecule has been definitely changed into a different molecule and is then no longer available for the tissue. The relevance of the 18F-FDG input function decay correction is thus questionable, and this note aims at showing that it is not conceptually justified. Here, as an example, we take a 2-compartment model in which it is assumed that no decay correction of the input function is needed, but which accounts for the physical decay of the trapped tracer, and compare it with the conventional Patlak analysis as often used in kinetic analysis of 18F-FDG PET data (2,3), that is, using in particular a decay-corrected input function.
MATERIALS AND METHODS
Two-Compartment Model Without Input Function Decay Correction
A 2-compartment model has been previously developed to measure 18F-FDG uptake in tissues, assuming that the tracer is trapped irreversibly (13,14). In this model, the rate of trapped tracer change per tissue volume at steady state, dCT/dt, is described by: Eq. 1where Cp(t) is the tracer plasma concentration at time t, K is the uptake rate constant (assuming an irreversible uptake), and the second term accounts for the 18F decay of the tracer trapped in the tissues. Cp(t) is not corrected for radioactive decay as it is assumed that, after 18F decay, an 18F-FDG molecule has been changed into a different molecule and will no longer be metabolized as 18F-FDG. The solution of Equation 1 is (13,14):
 Eq. 2The total quantity of radioactive molecules, at time t, per tissue volume unit, CTot(t), without any additional decay correction can be derived from Equation 2 by including the free tracer in the blood and interstitial volumes:
 Eq. 3
Eq. 3
The parameters fb and fi are the fractions of blood and interstitial fluid volumes in the tissue volume, respectively. Equation 3 can be rewritten as (13): Eq. 4
Eq. 4
Patlak Analysis Involving Input Function and Tissue Activity Decay Corrections
The equation conventionally used in Patlak analysis is (2,3): Eq. 5where CTot*(t) is defined as the total quantity of tracer at time t per tissue volume unit that includes both trapped tracer and free tracer in the blood and interstitial volumes. The K parameter is the tracer uptake rate constant as defined in Equation 1. Cp*(t) is defined as the tracer plasma concentration at time t. The parameters fb and fi are the fractions of blood and interstitial fluid volumes, respectively, in the tissue volume as defined in Equation 3. The original paper by Sokoloff et al. (15) did not involve any physical decay correction, because 14C-deoxyglucose was used, and the 14C period (about 5,700 y) was much greater than the experiment's duration. When 18F-FDG is considered, CTot*(t) and Cp*(t) are conventionally corrected for physical decay thus:
 Eq. 6
Eq. 6 Eq. 7where λ is the 18F physical decay constant (λ = ln 2/110) in min−1 if t is expressed in min.
Patlak graphical analysis consists of plotting: Eq. 8Introducing Equations 6 and 7 into Equation 8 yields:
 Eq. 9
Eq. 9
Equation 9 may be simplified as: Eq. 10
RESULTS
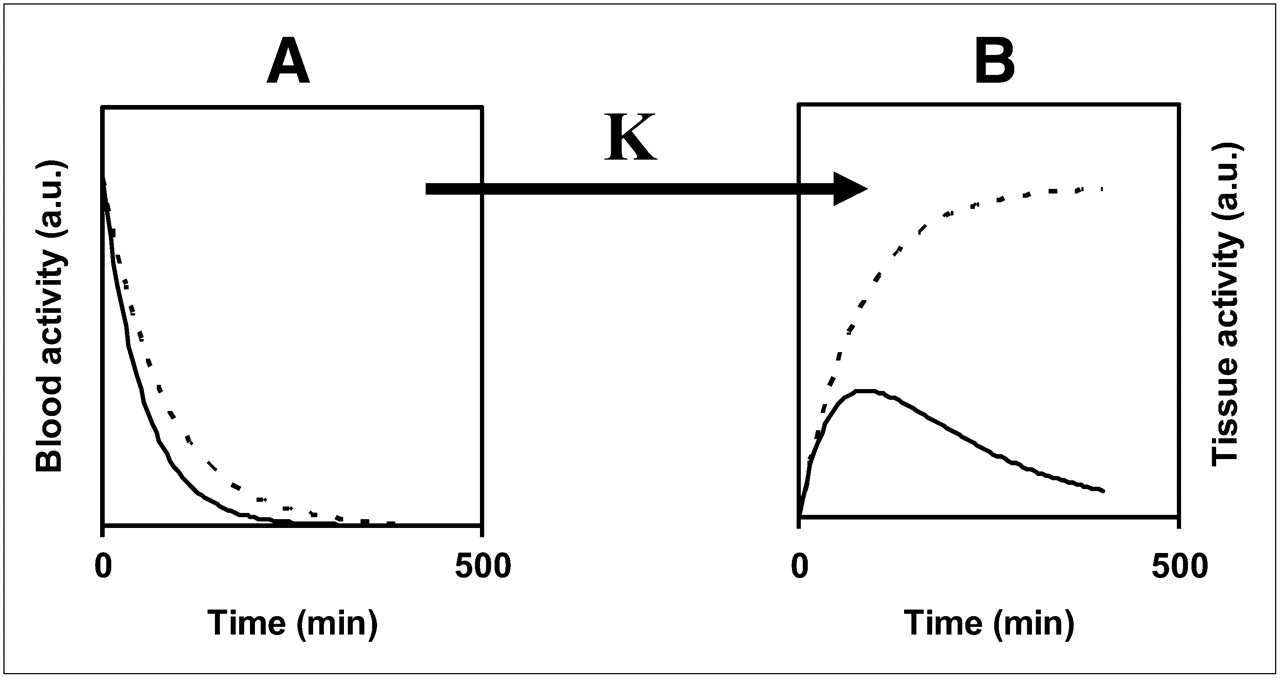
The 2 conceptual approaches are compared in Figure 1, with the 2 compartments involving free 18F-FDG in the blood (compartment A) and 18F-FDG trapped in intracellular cytoplasm (compartment B). The time–activity curves of the molecules are shown in each compartment, without or with 18F decay correction. The uncorrected 18F-FDG blood time–activity curve within compartment A has been drawn assuming, for simplicity, a monoexponential (physical + biologic) decay, with a rate constant α = 0.0188 min−1, according to literature data (9,12). Then, the trapped 18F-FDG time–activity curve within compartment B has been derived from Equation 2, yielding (13,14): Eq. 11

Theoretic free 18F-FDG blood time–activity curve and trapped 18F-FDG tissue time–activity curve included in compartments A and B, respectively, when no 18F decay correction is applied (solid line) and when 18F decay correction is applied (dashed line). a.u. = arbitrary unit.
The decay-corrected 18F-FDG blood time–activity curve within compartment A has been derived from Equation 7, that is, assuming only a biologic decay, and the decay-corrected time–activity curve of trapped 18F-FDG within compartment B has been derived from Equation 11, thus: Eq. 12
Assuming irreversible trapping and according to Equations 4 and 10, the same 18F-FDG uptake rate constant occurs between the 2 compartments whether a decay correction occurs or not. In Figure 1, the value of K has been arbitrarily set to 0.05 min−1, according to literature data (16). Therefore, the Patlak plot, without or with decay-corrected data, that is, from Equation 11 or from Equation 12, and from uncorrected or decay-corrected input functions, respectively, provides exactly the same graph with a linear slope of 0.05 min−1 (graph not shown).
DISCUSSION
A 2-compartment model in which it is assumed that no decay correction of the input function is needed has been compared with Patlak analysis that conventionally uses a decay-corrected 18F-FDG input function (Fig. 1). The use of decay-corrected data is not specific to Patlak analysis, but this example has allowed us a comparison with an analytic solution provided by the 2-compartment model. Equation 4 provided by the 2-compartment model analysis and Equation 10 provided by the Patlak analysis are identical, and hence each approach yields the correct uptake rate of the tracer. Therefore, this note does not present a new method, and simulations investigating different tracers (in particular with fast-decaying radionuclides) cannot discriminate between the 2 conceptual approaches. In other words, no advantage in 18F-FDG quantitative imaging can be obtained using the concept of uncorrected data (17) rather than that of decay-corrected data. Nevertheless, this note emphasizes that correcting the 18F-FDG input function for radioactive decay cannot be conceptually justified and that this correction is not compatible with the calculation of patient radiation dose.
Derivation of Equation 4 accounts only for the physical decay of trapped tracer in the tissues. On the other hand, Equation 10 was obtained after explicit decay correction of both the input function and the tissue activity value. The right-hand sides of Equations 4 and 10 are identical, but the exponential function exp(λt) associated with the input function comes from 2 different origins as a function of the derivation involved: It comes from the physical decay of the trapped tracer in Equation 4 and from a physical decay correction of the input function in Equation 10. Once 18F has emitted a positron, it becomes 18O, and hence a blood-borne 18F-FDG molecule is likely to be transformed into a blood glucose molecule. Correcting an 18F-FDG input function for the physical decay of the tracer does not appear conceptually justified because, after 18F decay, a blood-borne 18F-FDG molecule has definitely changed into a different molecule. Therefore, the original blood-borne 18F-FDG molecule is no longer available for the tissue, and the transformed molecule does not significantly compete with the remaining blood-borne 18F-FDG (compared with its competition with blood glucose molecules) since the experiment is performed at tracer dose. In fact, the competition of the blood-transformed molecule with blood-borne 18F-FDG would not exist if the transformed molecule were not a glucose molecule, for example, if the radioactive tracer were 11C-deoxyglucose. Therefore, it does not appear legitimate to correct the 18F-FDG input function for radioactive decay. Yet, conventional Patlak analysis uses an input function decay correction. This correction goes along with a decay correction of the tissue tracer activity yielding a correct formula and hence the correct uptake rate of the tracer and explains why the conventional approach is effective. However, our derivation suggests that the justification of an exponential function exp(λt) associated with the input function in the correct formula may be explained from a 2-compartment model and should not be considered an input function decay correction as in a conventional Patlak derivation.
Furthermore, this line of argument also highlights that correcting the 18F-FDG input function for radioactive decay is not compatible with the calculation of patient radiation dose. Indeed, 18F physical decay occurring with blood 18F-FDG molecules must be considered for calculations of the blood radiation dose (Fig. 1). The 2-compartment model, in which it is assumed that no decay correction of the input function is needed, agrees with kinetic models for absorbed dose calculation (18).
CONCLUSION
Although no advantage in 18F-FDG dynamic PET can be expected by using the concept of uncorrected data rather than that of decay-corrected data, this note nevertheless shows that correcting the 18F-FDG input function for radioactive decay cannot be conceptually justified and that this correction is not compatible with the calculation of patient radiation dose.
Acknowledgments
We gratefully acknowledge the invaluable assistance of Sinclair Wynchank for improving the manuscript.
Footnotes
-
COPYRIGHT © 2009 by the Society of Nuclear Medicine, Inc.
References
- Received for publication November 17, 2008.
- Accepted for publication February 18, 2009.


Jump to section
Related Articles
Cited By...
- No citing articles found.