
Abstract
We evaluate the accuracy of scaling CT images for attenuation correction of PET data measured for bone. While the standard tri-linear approach has been well tested for soft tissues, the impact of CT-based attenuation correction on the accuracy of tracer uptake in bone has not been reported in detail. We measured the accuracy of attenuation coefficients of bovine femur segments and patient data using a tri-linear method applied to CT images obtained at different kVp settings. Attenuation values at 511 keV obtained with a 68Ga/68Ge transmission scan were used as a reference standard. The impact of inaccurate attenuation images on PET standardized uptake values (SUVs) was then evaluated using simulated emission images and emission images from five patients with elevated levels of FDG uptake in bone at disease sites. The CT-based linear attenuation images of the bovine femur segments underestimated the true values by 2.9 ± 0.3% for cancellous bone regardless of kVp. For compact bone the underestimation ranged from 1.3% at 140 kVp to 14.1% at 80 kVp. In the patient scans at 140 kVp the underestimation was approximately 2% averaged over all bony regions. The sensitivity analysis indicated that errors in PET SUVs in bone are approximately proportional to errors in the estimated attenuation coefficients for the same regions. The variability in SUV bias also increased approximately linearly with the error in linear attenuation coefficients. These results suggest that bias in bone uptake SUVs of PET tracers ranges from 2.4% to 5.9% when using CT scans at 140 and 120 kVp for attenuation correction. Lower kVp scans have the potential for considerably more error in dense bone. This bias is present in any PET tracer with bone uptake but may be clinically insignificant for many imaging tasks. However, errors from CT-based attenuation correction methods should be carefully evaluated if quantitation of tracer uptake in bone is important.
Export citation and abstract BibTeX RIS
General scientific summary We evaluated the accuracy of measured PET uptake values in bone regions when CT-based attenuation correction is used. Through PET/CT ex-vivo bone imaging, simulations, and patient data, we evaluated the magnitude of error and impact of error from CT-based attenuation correction on PET standardized uptake values (SUVs). Bias in bone SUVs of PET tracers ranged from 2.4% to 5.9% when using CT scans at 140 and 120 kVp for attenuation correction. At lower kVp settings there is a potential for increased bias. Errors in PET SUVs in bone are approximately proportional to errors in the estimated attenuation coefficients for the same regions. This bias may be clinically insignificant for many imaging tasks. However, errors from CT-based attenuation correction methods should be carefully evaluated if quantitation of tracer uptake in bone is important.
1. Introduction
PET/CT has become an effective diagnostic tool in oncology imaging as it provides combined functional and anatomic imaging, resulting in improved lesion characterization and localization compared to PET alone (Beyer et al 2000, Wahl 2004).
An important synergy of PET/CT scanners is the use of the CT images for attenuation correction of the PET emission data (Kinahan et al 1998, 2003, Burger et al 2002). There are several advantages of this approach compared to the earlier standard of PET transmission (TX) scans with 68Ga/68Ge sources. These include (i) a less noisy image, (ii) shorter acquisition times and (iii) insensitivity of the attenuation image to emission contamination (Kinahan et al 2003). An important issue, addressed in this paper, is the potential bias due to the fact that CT data, acquired as a weighted average of photon energies ranging from approximately 30 to 140 keV, have to be transformed into estimates of the attenuation coefficients of PET photon energies at 511 keV (Burger et al 2002, Kinahan et al 2003, Ay et al 2011). Three main methods have been proposed to implement this conversion: dual-kVp CT scans, segmentation and scaling. Dual-kVp (or dual-energy) CT scanning potentially allows for the most accurate approach (Kinahan et al 2006), but is complex and can increase patient radiation dose. Segmentation methods can also be complex, and have the potential to introduce bias (Schleyer et al 2010). The simplest and most commonly employed method is bi- or tri-linear scaling (Kinahan et al 1998, 2003, Burger et al 2002), which closely approximates the electron density as a function of CT number in most tissues (Schneider et al 2000).
Quantitative PET images of tracer uptake in bone tissue are important for assessing both normal bone and cancer spread (Wahl et al 1991), as bone is a common site of metastasis (Stafford et al 2002). FDG PET/CT is commonly used for cancer staging, including the identification of bone metastases, and 18F-fluoride PET/CT is increasingly used for bone imaging, including bone metastasis detection (Even-Sapir et al 2007). Accurate estimates of tracer uptake are particularly important for assessing bone metastases response to therapy, where FDG has shown considerable promise (Stafford et al 2002, Du et al 2007, Specht et al 2007, Meirelles et al 2010).
There are several studies presenting results on the accuracy of the linear attenuation coefficients (LACs) derived from CT images in soft tissue, with or without contrast agents, in phantoms, human data, or small animals (e.g. (Burger et al 2002, Nakamoto et al 2002, Visvikis et al 2003, Berthelsen et al 2005, Mawlawi et al 2006)). However, the impact of CT-based attenuation correction (CTAC) on the accuracy of PET tracer uptake values for bony regions has not been carefully evaluated. A means of constructing a phantom that accurately mimics PET tracer uptake in both compact and cancellous bone has not yet been found. Cancellous bone is less dense but with a higher surface area than compact bone. It typically occupies the interior region of bones, is highly vascular and frequently contains bone marrow.
The purpose of this work is to assess the errors from using the CT images for attenuation correction of PET data on estimates of tracer uptake in compact and cancellous bone. We performed three experiments using a combination of simulations, phantom studies and patient data. Preliminary results were presented earlier (Abella et al 2007); here, we refine the methods and extend the analysis of the results.
2. Materials and methods
The bi-linear scaling method for PET/CT (Burger et al 2002, Kinahan et al 2003) assumes that all pixels in a CT image with CT numbers between approximately −1000 and 0 Hounsfield units (HU) are a mixture of air and water, while pixels with a CT number greater than 0 HU are composed of a mixture of water and bone. The theory is described in detail elsewhere (Kinahan et al 2003). Our experiments were based on the Discovery STE PET/CT scanner (GE Healthcare, Waukesha, WI), which uses a tri-linear scaling approach. With this method the LAC at 511 keV is estimated by LAC = a × CT + b, where a and b are constants listed in table 1 (conversion factors were determined from internal scanner calibration factors and were derived based on the work by Lonn (2003)) and 'CT' is the CT number in HU. The corresponding conversions are illustrated in figure 1.
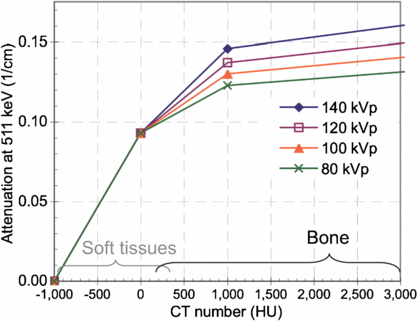
Figure 1. Tri-linear scaling method used to convert CT numbers to LACs at 511 keV for different x-ray tube potentials (values provided by the manufacturer). Approximate ranges for CT numbers of soft tissues and osseous tissues are indicated.
Download figure:
Standard imageTable 1. Coefficients used for tri-linear scaling according to LAC = a × CT + b.
| −1000 < CT < 0 | 0 < CT < 1000 | 1000 < CT < 300 00 | ||||
|---|---|---|---|---|---|---|
| Tube potential (kVp) | a (cm−1-HU) | b (cm−1) | a (cm−1-HU) | b (cm−1) | a (cm−1-HU) | b (cm−1) |
| 80 | 9.30e-5 | 0.093 | 3.28e-5 | 0.093 | 4.10e-6 | 0.122 |
| 100 | 9.30e-5 | 0.093 | 4.00e-5 | 0.093 | 5.00e-6 | 0.128 |
| 120 | 9.30e-5 | 0.093 | 4.71e-5 | 0.093 | 5.89e-6 | 0.134 |
| 140 | 9.30e-5 | 0.093 | 5.59e-5 | 0.093 | 6.98e-6 | 0.142 |
Images were reconstructed with filtered backprojection (FBP) using a 5 mm Hanning window. All simulations and image-based analysis were performed with IDL version 6.4 (ITT Visual Information Solutions, Boulder, CO).
The primary measure of tracer uptake used was the standardized uptake value (SUV):  , where R (kBq ml−1) is the activity concentration estimated from the region of interest (ROI), D' (kBq) is the decay-corrected injected dose and
  is a surrogate for the volume of distribution of tracer inside the body, in our case body weight (g). In this case the SUV units were g ml−1.
2.1. Experiment 1: CT-derived attenuation bias
The goal of the first experiment was to determine the bias in the CT-derived attenuation coefficients of bone in large portions, immune to partial volume errors (bovine phantom) and in realistic human-sized bone regions (limited patient study). To this end, we compared the LACs derived from the CT image (LACCTAC) by means of the tri-linear transform (figure 1) with those obtained from a PET transmission image (LACTX) using a 68Ga/68Ge positron source.
We performed a single scan of three frozen bovine femur segments positioned in a 20 × 20 cm2 cylindrical phantom. The phantom also contained a 5 cm diameter cylinder with dilute iodine-based contrast agent as a reference. A 10 min 2D PET transmission scan was acquired on a GE Advance PET Scanner (GE Healthcare, Waukesha, WI) and reconstructed with the FBP algorithm with a 5 mm Hanning window, obtaining a set of 65 4.25 mm thick slices, each 128 × 128 pixels of size 2.3 mm × 2.3 mm. A CT scan of the same phantom was acquired with the GE Discovery STE PET/CT scanner using 140, 120 and 80 kVp with 200 mAs. The attenuation coefficients from CT were calculated from a filtered version of the CT image covering a FOV of 70 cm, yielding a data set of 73 × 3.75 mm image slices, each with 512 × 512 pixels of size 1.37 mm × 1.37 mm. The CT image was then downsampled (with linear interpolation) to match the PET transmission pixel size and both images were aligned manually as shown in figure 2. This final phase of the CT image converted to a PET attenuation map is termed the CTAC image. The accuracy of alignment was visually assessed to be better than 2 mm in all directions. Both the CTAC and TX images represent the spatial distribution of the LACs at 511 keV with units of cm−1.

Figure 2. Axial and sagittal views of frozen bovine femur segments in a 20 × 20 cm2 cylindrical phantom. (A) CTAC image (140 kVp) interpolated to match the PET transmission resolution and after scaling attenuation coefficients to 511 keV using the tri-linear transform (figure 1 and table 1). (B) 10 min PET transmission (TX) image at 511 keV used as a reference standard.
Download figure:
Standard imageFive volumetric regions of the bones were segmented by thresholding and erosion of the CT image to obtain equivalent volume masks for the PET TX and CTAC images. Two regions were from compact bone, two were from cancellous bone and one was from the contrast cylinder. Two of these volume masks are shown in supplemental figure 1 (supplemental materials are available online only, from stacks.iop.org/PMB/57/2477/mmedia). Differences between the average LACs within each region from the two images were then calculated. The numerical results are reported as the per cent error in the average LACs at 511 keV by

We repeated the above analysis for previously acquired scans of a patient from both scanners using 140 kVp for the CT scan component. The PET transmission image was acquired pre-injection. All patient data were analyzed under the Institutional Review Board approval for retrospective patient data analysis. Figure 3 shows the CTAC and TX images of this patient.

Figure 3. Axial and coronal views of the CTAC (A) and PET TX (B) images of patient 1. Grayscale units are for the LAC at 511 keV with units of 1 cm−1.
Download figure:
Standard imageIn this case, it was not possible to accurately register both images using rigid transformations to be able to use the CT-derived region mask for both. Instead, we calculated the mean LAC for the entire bone region in both data sets using thresholding. It was determined experimentally that thresholds of 0.1070 cm −1 for CTAC and 0.1074 cm −1 for PET TX images obtained very similar regions (volumes of 87.7 cm3 and 87.2 cm3, respectively). In order to assess the consistency of results using this method, we repeated the same process with the bovine femur phantom image regions to compare with the analysis using the CT-derived region mask.
2.2. Experiment 2: evaluation of the bias in simulated PET tracer uptake due to inaccuracies in measured CTAC images
In the second experiment, we evaluated the impact of inaccuracies in the CTAC image on the estimated tracer SUV in the corresponding PET image. Due to the difficulty of introducing a known quantity of FDG into the bovine bone, we instead simulated an emission image by thresholding the CT image to determine bone regions and then assigned different activity values to each segmented region (figure 4). The assigned PET tracer uptake values are given in table 2. To simplify the analysis we removed the contrast cylinder and the smaller bone (no. 3) from the bovine phantom images.
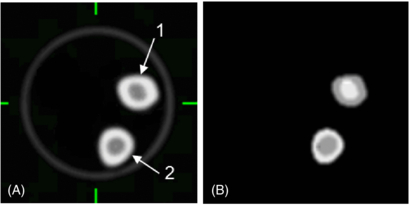
Figure 4. Transaxial sections of the CTAC (A) and simulated PET (B) emission images of tracer uptake in bone used to evaluate effect of CTAC errors on PET SUVs measured from bone tissue in the bovine femur phantom.
Download figure:
Standard imageTable 2. Assigned ('true') PET tracer uptake values in the bovine femur phantom for experiment 2.
| VOI | SUV (g ml−1) |
|---|---|
| Compact bone 1a | 10.0 |
| Compact bone 2 | 7.0 |
| Cancellous bone 1 | 7.0 |
| Cancellous bone 2 | 10.0 |
The effect of incorrect CTAC factors was determined by forward-projecting the simulated PET image, including attenuation (by using the inverse of the 'true' attenuation correction factors obtained from the PET transmission scan), and correcting for attenuation with the 'erroneous' attenuation correction factors (obtained from the CTAC image). The attenuation corrected data were then reconstructed with FBP. The process is outlined in figure 5.
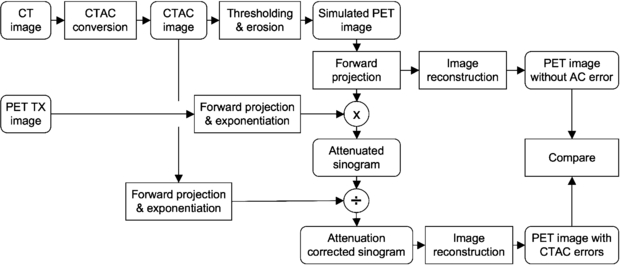
Figure 5. Flowchart of the process followed to evaluate the bias in PET image quantification due to inaccuracies in the CTAC data using the reconstructed images of the bovine femur phantom.
Download figure:
Standard imageFor a reference image, we forward-projected and reconstructed the simulated emission data. In this manner the sampling and resolution effects were the same for the two PET emission images. The numerical results calculated were the per cent error in the average SUV within each region between the PET emission images using the PET TX scan (SUVTX) and CTAC scan (SUVCTAC) attenuation correction factors as follows:

2.3. Experiment 3: sensitivity analysis using patient emission images
In the third experiment, we used CT and PET images from five patient exams with significant FDG uptake in bone tissue. Similar to experiment 2, we measured the bias of the FDG uptake due to simulated errors in attenuation correction. The experimental process is outlined in figure 6. Since patients were imaged only on the PET/CT scanner (figure 7 shows one of these studies), 511 keV PET TX images were not available. For these patient exams we used the measured LACCTAC and SUV images as the reference standards.

Figure 6. Flowchart of the process followed to evaluate the bias in tumor quantification due to inaccuracies in CTAC data. 'CT image' and 'PET SUV image' are the reconstructed images for each patient.
Download figure:
Standard image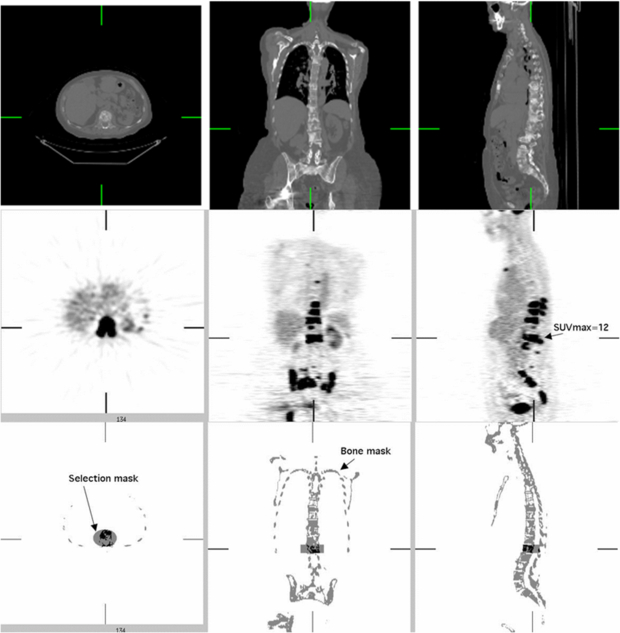
Figure 7. Illustration of masking process used for one of the five PET/CT patient scans with significant FDG uptake in bone. Top: axial, sagittal and coronal views of 70 cm diameter FOV CT image. Middle: PET FDG images. Bottom: bone mask based on PET and CT images with one of the cylindrical selection masks used to isolate one vertebra for analysis.
Download figure:
Standard imageThe values used for comparison in each selected site corresponding to a bone metastasis were expressed in terms of maximum (SUVMAX) and mean value (SUV75) in a contiguous volume of interest (VOI) covering all voxels with SUVs at least 75% of SUVMAX5. We used 12 VOIs selected from the five studies of pre-treatment breast cancer patients with extensive bone metastases in the thoracic spine, lumbar spine and pelvis.
The VOIs were obtained by the following procedure. First a bone mask image was segmented by thresholding the CT image after resampling and filtering to match the PET image resolution. Cylindrical VOIs were then manually defined to select specific bony areas with elevated FDG uptake. The tumor volume values were then obtained by including the voxels in the intersection of both the cylindrical VOIs and the bone image mask with values higher than 75% of SUVMAX (figure 7). We measured the dependence of the error in SUVCTAC images as a function of the estimated SUVMAX values, as well as the dependence on introduced errors in LACCTAC (we tested errors in LACCTAC of 2%, 4%, 6% and 8%).
3. Results
3.1. Experiment 1: CT-derived attenuation bias
Table 3 shows the error in LACs (equation (1)) measured for the five volumes segmented in the bovine femur phantom. In this case, the values from the PET transmission scan are used as a reference standard.
Table 3. LACs measured from the bovine femur phantom from experiment 1. Errors from CT-based measures compared to those from 511 keV PET transmission image are also given. The coefficient of variation of all LAC values ranged from 3% to under 1%.
| 511 keV | 140 kVp | 120 kVp | 80 kVp | ||||
|---|---|---|---|---|---|---|---|
| Energy Material and region | LACTX (cm−1) | LACCTAC (cm−1) | ΔLAC (%) | LACCTAC (cm−1) | ΔLAC (%) | LACCTAC (cm−1) | ΔLAC (%) |
| Compact bone 1a | 0.151 | 0.149 | −1.3 | 0.141 | −6.8 | 0.129 | −14.1 |
| Compact bone 2 | 0.150 | 0.148 | −1.3 | 0.140 | −6.6 | 0.129 | −13.6 |
| Cancellous bone 1 | 0.096 | 0.093 | −3.1 | 0.093 | −2.9 | 0.092 | −3.4 |
| Cancellous bone 2 | 0.096 | 0.094 | −2.5 | 0.093 | −2.6 | 0.093 | −3.0 |
| Contrast cylinder | 0.097 | 0.124 | 27.3 | 0.123 | 26.7 | 0.124 | 27.5 |
a Numbers correspond to regions indicated in figures 2 and 4.
Errors in LACs (ΔLAC) for cancellous bone were 2.9 ± 0.3% regardless of the kVp used during CT acquisition. For compact bone the underestimation ranged from approximately 1.4% at 140 kVp to 13.8% at 80 kVp. The alternative region selection method yielded ΔLAC of −2.0 ± 0.2% in both the patient 1 scan and the bovine phantom at 140 kVp, confirming consistency between phantom and patient results. The errors for the contrast cylinder were significantly higher at 27.2%.
3.2. Experiment 2: evaluation of the bias in simulated PET tracer uptake due to inaccuracies in measured CTAC images
The differences between the assigned SUV (table 2) and SUVTX in table 4 reflect the effects of the numerical processing. For this reason, the SUVs calculated using CTAC (SUVCTAC) are compared to SUVTX as described in equation (2). As indicated in table 4, the underestimation of PET SUV when using biased LACCTAC values (using the PET transmission image LACTX as a gold reference) ranged from −2.4% to −5.9% at 140 and 120 kVp.
Table 4. Simulated errors in emission SUV values from experiment 2 based on measured errors in bone LAC (ΔLAC). True SUV values are listed in table 2 and ΔLAC values are from table 3.
| 511 keV | 140 kVp | 120 kVp | 80 kVp | ||||
|---|---|---|---|---|---|---|---|
| Energy Material and region | SUVTX (g ml−1) | SUVCTAC (g ml−1) | ΔSUV (%) | SUVCTAC (g ml−1) | ΔSUV (%) | SUVCTAC (g ml−1) | ΔSUV (%) |
| Compact bone 1a | 9.66 | 9.43 | −2.4 | 9.14 | −5.5 | 8.76 | −9.4 |
| Compact bone 2 | 7.01 | 6.83 | −2.6 | 6.60 | −5.9 | 6.31 | −10.0 |
| Cancellous bone 1 | 7.08 | 6.79 | −4.1 | 6.72 | −5.0 | 6.66 | −5.8 |
| Cancellous bone 2 | 10.04 | 9.80 | −2.4 | 9.70 | −3.4 | 9.60 | −4.4 |
3.3. Experiment 3: sensitivity analysis using patient images
The estimated bias in SUVMAX as a function of 'true' SUVMAX is presented in figure 8(A) for each LACCTAC bias (−2%, −4%, −6% and −8%) introduced to the 12 lesions from five patient emission images. Here 'true' SUVMAX was found using the default LACCTAC because LACTX were not available for these images.
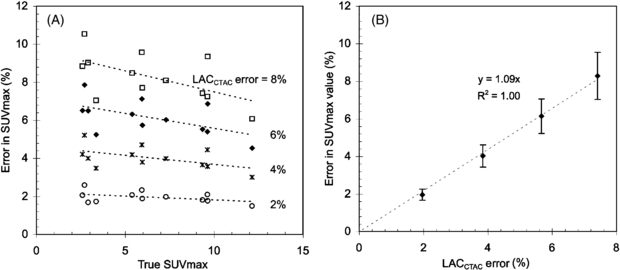
Figure 8. (A) SUV errors as a function of nominal SUV values for different values of percentage of CTAC error (LACCTAC error). (B) SUV errors as a function of percentage of error in CTAC (LACCTAC error (%)) averaged over all nominal SUV values.
Download figure:
Standard imageWhen the results are averaged for all SUV values (figure 8(B)) there is an approximate error in SUVMAX of 1% for each percentage error in LACCTAC, which is in agreement with our previously reported results for soft tissue (Kinahan et al 2006). The variability in the SUV bias also increased approximately linearly with the error in LACCTAC (figure 8(B)). There was a weak inverse dependence of bias in SUVMAX on the true SUV value (figure 8(A)). Similar results to those described above for SUVMAX were found for SUV75.
4. Discussion
Photon attenuation and its correction are nonlinear processes (Bai et al 2003), and thus it is challenging to characterize errors in attenuation correction. The use of CTAC adds an additional level of complexity due to the inability of CT to provide accurate measures of attenuation (Hsieh 2009). There are several factors such as tumor size and tumor-background ratio that may alter how errors in attenuation correction affect PET image quantitation in bone. Our initial evaluations, which avoided partial volume effects, indicated that PET image biases are linearly dependent on errors in CT-based estimates of bone attenuation coefficients when those errors are < 10%, and also slightly dependent on the magnitude of true SUV. We therefore focused on the impact of these effects.
There are significant technical challenges in measuring quantitative errors in PET tracer uptake in bone when CTAC is used. Appropriate phantom design is difficult (e.g. tracer uptake in bony structures), and patient-based comparisons are confounded by changes in tracer uptake duration, non-rigid image registration and the typically resolution-limited measurements. To explicitly evaluate the mechanisms that introduce error into estimated tracer uptake values in bone when CTAC is used, we performed three experiments using simulations, phantoms and clinical data. Experiment 1 determined the bias in the CT-derived attenuation images. Experiment 2 determined the bias in simulated PET images due to measured errors in attenuation correction, not confounded by partial volume effects. Experiment 3 determined the bias in PET images due to errors in attenuation correction for realistic attenuation and emission distributions.
We first determined the estimated LACs (LACCTAC) at different kVp (table 3). For cancellous bone the errors in LACs (ΔLAC) were approximately −3% regardless of the kVp used for CT acquisition. For compact bone the lowest error in LACCTAC of −1.4% was obtained at 140 kVp. As the kVp decreased to 80 kVp, ΔLAC increased to approximately −14%. At 120 kVp, arguably the most common voltage used in CT, ΔLAC was approximately −7% in compact bone. We used the manufacturer's tri-linear slope and intercept parameters (table 1) to evaluate error for an actual system. Considering that all estimated LACCTAC values were below the reference standard for compact bone, the conversion parameters (slope) could be increased for CT numbers above 1000 HU for all regions to reduce bias. Results suggest that the conversion factors for the lower kVp acquisitions may need to be increased more than the higher kVp studies. It will be more challenging to improve the conversion for cancellous bone considering it has CT numbers in the range of water (−100–100 HU). Adjustments to the conversion for this range may lead to increased errors in non-bone, soft-tissue regions. Evaluation of the combined bone regions revealed an error of −2% for both the bovine femur phantom and the patient studies at 140 kVp. This error is between the errors for compact and cancellous bone at 140 kVp. Thus the error in LACCTAC at 120 kVp can be expected to vary between −3% and −7%, although this will vary based on the mixture of bone type and other factors (e.g. object size/shape and partial volume effects).
As expected, values for the region with CT contrast agent showed the largest error since the conversion curves applied are intended for images without contrast. The application of tri-linear CTAC conversion curves specific for contrast media (Lonn 2003) lowered these errors in contrast areas at the expense of dramatically increasing the error in bone areas (data not shown). Therefore, for studies with contrast media and where bone uptake is expected, a different approach, such as a dual-energy method or hybrid classification/scaling algorithm, may be advisable for converting the CT values to LAC values at PET energies (Kinahan et al 2006). The effects of CT contrast agents were not considered any further in this study.
Using the expected range of errors in LACCTAC for bone, we then evaluated the effect on estimated SUV values of the bovine femur phantom (table 4). The differences between the assigned SUV in table 2 and SUVTX in table 4 reflect the effects of the numerical processing (forward projection, attenuation and image reconstruction). For this reason the SUVs calculated using CTAC (SUVCTAC) are compared to SUVTX (equation (2) and figure 5) so that both estimates have the same effects from numerical processing. At 140 kVp, the estimated SUVCTAC was lower than the reference SUVTX value by approximately 2.5% in compact bone and 2.4%–4.1% in cancellous bone.
While the results from tables 3 and 4 determine the impact of errors in LACCTAC on PET SUVs, they do not take into account the important effects of the location and size of attenuating material in patient images. To include these effects and perform a more extended sensitivity analysis, we used five additional patient images with significant FDG uptake in bone lesions (e.g. figure 7). This allowed estimation of the error in FDG uptake as a function of the error in the CTAC and nominal SUV uptake as shown in figure 8(A). From figure 8(B) we see that the per cent error in PET SUVMAX is roughly proportional to the per cent error in LACCTAC. Very similar results were found for SUV75 (data not shown). These results are consistent with our previous results for soft tissues (Kinahan et al 2006). As expected, the variability of SUV measurements increased with increasing error in LAC factors because of the propagation of error from multiplicative terms.
Based on figure 8(B), with a typical error in LACCTAC of up to −3.1% at 140 kVp and up to −6.8% at 120 kVp, we would thus expect an SUVMAX error of approximately −3.1% and −6.8% at 140 and 120 kVp. This represents a range for PET/CT imaging parameters on clinical scanners using the tri-linear transform method described above (figure 1 and table 1).
Very similar results were found for SUVMAX and SUV75. The definition of the SUV75 metric was motivated by several factors. It is generally not feasible to define a mean SUV for bone lesions since the boundaries are difficult to determine by either PET or anatomic imaging such as CT. Likewise, our goal was not to compensate for resolution loss along boundaries of lesions (Soret et al 2007), which can lead to substantial variability in different definitions of mean SUV, but rather to assess the underlying bias from attenuation correction. The SUV75 metric provides a small amount of local averaging to reduce the statistical fluctuations in bias assessment derived from SUVMAX, which is based on a single voxel. Other approaches, such as a small fixed-size ROI, e.g. SUVpeak, may also be useful in this regard (Velasquez et al 2009, Wahl et al 2009).
To compare our results with those previously published, we note that, as far as we know, no study reports both the errors in attenuation coefficients and their propagation to PET tracer uptake in bone. Burger et al (2002) demonstrated an overall qualitative agreement in estimated LAC at 511 keV (LACCTAC) using the bi-linear method for 114 mixed soft-tissue and bone regions in patient studies, but there was no differentiation of bone versus soft-tissue results for emission data. Inspection of the key results of the study by Burger et al shows little significant bias for LACCTAC versus LACTX for a range of CT values that should encompass bone, i.e. in the range of 200–800 HU, although there is some variability in the results. In addition, a single measurement with a bovine femur segment showed a slight bias of LACCTAC versus LACTX. Thus the results of the study by Burger et al appear to be consistent with those presented here. In contrast, Visvikis et al (2003) found that with a similar implementation of the bi-linear scaling method, CT-based attenuation coefficients (LACCTAC) were higher by 4.5% than those measured using a 68Ga/68Ge transmission source for cortical bone. This study analyzed the impact on PET tracer uptake values for lung and soft tissue, but not in bone regions.
The study by Nakamoto et al (2002) evaluated the impact of CTAC versus 68Ga/68Ge transmission sources on measured PET tracer values, but did not report on differences in LAC. They found that calculated radioactivity concentrations were significantly greater in osseous lesions than in non-osseous lesions (11.0% versus 2.3% for the mean value in an ROI, based on n = 9 bone lesions). A weak positive correlation was observed between the CT HU within the ROIs and the percentage difference in apparent tracer activity in the CT-corrected images. They hypothesized that errors exist in the conversion of high CT values to 511 keV attenuation coefficients. As we have shown here, such errors would impact the estimation of PET tracer uptake in bone. The errors reported by Nakamoto et al are higher than those reported in our study. The reason for this difference is not clear, in particular as similar PET/CT scanners were used, but it could be due to the small sample size, differences in the tri-linear scaling parameters, calibration of the CT scanner, or differences in the processing of the CTAC images. In addition, a segmented attenuation correction method was used to suppress noise from the 3 min PET transmission scan, which can render low-density bone as soft tissue. Furthermore, we reconstructed PET images with FBP, whereas the study by Nakamoto et al used ordered-subsets expectation–maximization (OSEM). Due to the nonlinear nature of OSEM, its behavior when there are errors in data is unpredictable. Nakamoto et al suggest using FBP-based germanium-corrected images as a standard for a more direct error assessment (Visvikis et al 2003). However, since FBP and OSEM provide accurate results when attenuation (and other) corrections are applied, we expect in general quantitative results for FBP and OSEM to be similar in the presence of CTAC bias.
For diagnostic purposes the small errors in estimated PET tracer values will most likely not influence clinical interpretation (Du et al 2007, Tateishi et al 2008). The underestimation of the attenuation correction factors should lead to fixed biases in the SUVs, and with a variability that is below reported reproducibility for SUV measurements for PET imaging (Boellaard 2009). However, if PET/CT imaging is being used to evaluate response to therapy, then the bias in the estimation of PET tracer uptake may well become significant. Since all positron emitting tracers have the same annihilation energy of 511 keV, these results will apply to all PET tracers, including 18F-NaF for bone lesion imaging (Even-Sapir et al 2007).
5. Conclusion
Our results show that the per cent error in PET SUV for bone imaging is roughly proportional to the per cent error in the linear attenuation coefficients estimated from the CT scan (LACCTAC). The errors in bone LACCTAC in turn ranged from −1.3% to −6.8% at 140 and 120 kVp, depending on the experiment and type of analysis performed. Thus we expect the error to be between −1.3% and −6.8% for PET tracer uptake values in bone lesions over a wide range of SUVs, with smaller errors for the higher kVp scans. Errors increased for cortical bone as the scan kVp was reduced. While errors in estimated PET tracer values most likely do not influence clinical interpretation, quantitative studies evaluating therapeutic response in bone should account for changes in bone composition. These results will apply to all PET tracers and are based on the specific tri-linear scaling method implemented in the PET/CT scanner we used for the experimental studies (figure 1 and table 1). On other PET/CT scanners there are variations in how the scaling method is implemented. For those systems these results should be re-evaluated.
Acknowledgments
We gratefully acknowledge the help of the meat department staff at the Sand Point Metropolitan Market (Seattle, WA) for the preparation of the bovine femur phantom. We also acknowledge helpful discussions with Steven Kohlmyer of GE Healthcare Technologies. This work was supported by grants TEC2004-07052-C02 (Ministerio de Educación y Ciencia), CD-TEAM (Ministerio de Ciendia e Innovación) and GR/SAL/024104 (Comunidad de Madrid), and NIH grants R01-CA115870 and R01CA124573.
Footnotes
- 5
The subscripts SUVTX and SUVCTAC are used to differentiate between the attenuation correction methods used in generating SUVs, while SUVMAX and SUV75 indicate the method of measuring SUVs.