


Visual Abstract

Abstract
68Ga-prostate-specific membrane antigen (PSMA) ligands are used for prostate cancer but also show high renal cortical uptake. In this study, we aimed to assess whether there is any correlation between renal PSMA PET parameters and renal function tests using the images of prostate cancer patients. Methods: 68Ga-PSMA-11 PET/CT images of the patients with prostate cancer were retrospectively evaluated. The following PET parameters were obtained: SUVmax, SUVmean, SUVmax corrected for lean body weight, SUVmean corrected for lean body weight, volume, lean body weight--corrected total lesion glycolysis (TLGSUL), and counts of both kidneys, as well as SUVmean of the liver, blood pool, and spleen. Total TLGSUL, total volume, kidney-to-liver ratio, and kidney–to–blood pool ratio were calculated. Creatinine values were obtained, and glomerular filtration rate (GFR) was calculated using the “Modification of Diet in Renal Disease” formula. Statistical analysis was performed to understand whether there is a correlation between the above parameters and renal function tests. Results: Twenty-five patients were included in this study. GFR was significantly and positively correlated and creatinine was significantly and negatively correlated with the ratios of renal SUV to liver SUV and renal SUV to blood pool SUV. GFR was marginally positively correlated with renal SUVmean corrected for lean body weight, and creatinine was marginally negatively correlated with total TLGSUL. Total renal parenchymal volume was significantly and directly (positively) associated with GFR and significantly and inversely (negatively) associated with creatinine. Conclusion: Renal 68Ga-PSMA uptake appears to be correlated with renal function tests. Our method of measuring approximate renal parenchymal volume on PET images appears to be reliable.
Prostate-specific membrane antigen (PSMA), also known as glutamate carboxypeptidase II or folate hydrolase, is a type II transmembrane protein that is found mainly in prostate tissue. PSMA is overexpressed in prostate cancer and various other malignancies and in extraprostatic normal tissues, with the highest expression being in the kidneys and salivary glands (1–3). In immunohistochemical analysis, detectable PSMA levels were identified in the brush borders and apical cytoplasm of a subset of proximal renal tubules, where PSMA is responsible for the reuptake of folates via epithelial brush cells (1,4). Renal folate reabsorption seems to be mediated primarily by the glycosylphosphatidylinositol-anchored protein folate receptor α, which is highly expressed at the brush-border membrane of proximal tubule cells (1,4–6).
68Ga-PSMA ligands or inhibitors are novel PET radiotracers to image prostate cancer and its metastases (7,8). Recently, 68Ga-PSMA-11 was approved by the Food and Drug Administration for prostate cancer imaging, and other PSMA ligands (68Ga and 18F) are currently being evaluated in Europe for approval by the European Medicines Agency (9). PSMA ligands radiolabeled with 177Lu and 225Ac are also used to treat prostate cancer metastases, with increasing success (10,11). Studies have reported no significant effect on renal function, although therapeutic radiolabeled PSMA ligands show high renal uptake and excretion (12,13).
In various articles, Sarikaya et al. have reported that 68Ga-PSMA-11 shows excellent uptake and distribution in the renal parenchyma and demonstrates defects caused by various sizes of simple cortical cysts (14–16). In a patient with chronic pyelonephritis, the image resolution of renal PSMA PET as part of a prospective study in adults was superior to that of dimercaptosuccinic acid (DMSA) scanning (17).
DMSA is the current gold standard for renal cortical imaging, but there is a shortage of this tracer in various countries, including the United States, and there is a need for alternative radiotracers to image the renal cortex (18).
Renal uptake of 99mTc-DMSA has been shown to correlate well with the effective renal plasma flow, glomerular filtration rate (GFR), and creatinine clearance (19–23).
In this study, we wanted to determine whether there is a correlation between renal PSMA PET parameters and renal function tests. Our aim was to understand whether PSMA PET is suitable for renal cortical imaging and whether PSMA uptake parameters can be used to assess or estimate renal function in patients treated with radiolabeled PSMA ligands.
MATERIALS AND METHODS
We retrospectively analyzed the 68Ga-PSMA-11 PET/CT images of prostate cancer patients who had undergone renal function testing (creatinine) within 14 d of imaging. All images were obtained in the Nuclear Medicine Department at Dresden Municipal Hospital.
Tracer Production and Image Acquisition
68Ga-PSMA-11 was radiolabeled with an automated module (Scintomics GRP) as described previously (24).
Whole-body PSMA PET/CT images were obtained using a Biograph 16 PET/CT camera (Siemens Healthineers) approximately 60 min after intravenous injection of 100–150 MBq (2.7–4.0 mCi) of 68Ga-PSMA-11.
Before PET image acquisition, a low-dose, unenhanced CT scan from vertex to mid thigh was obtained for attenuation correction, anatomic localization, and gross anatomic correlation. The CT parameters included 16 mAs, 120 kV, a 0.8 pitch, 0.5s, 20 × 0.6 mm collimation, and a 5-mm reconstructed slice thickness.
The PET acquisition time was 3 min per bed position. The images were corrected for attenuation on the basis of the CT data, reconstructed using an iterative algorithm (Siemens TrueX), and reformatted, as well as fused online into transaxial, coronal, and sagittal views with Syngo Via MM Oncology VB40 (Siemens Healthineers).
PET Image Analysis
Because of intense activity in the kidneys, PET images were analyzed in low-intensity settings to better see the renal cortical uptake and distribution and accurately place a volume of interest (VOI) without including pelvicalyceal activity. For each kidney, the 3 orthogonal planes on CT and PET were adjusted to optimally draw an ovoid VOI around the respective kidney and exclude possible extrarenal or calyceal activity (Fig. 1). After the plane alignment, the VOI was drawn around the kidney and fitted around the external border of the cortex. To exclude the renal pelvis, we used a lower limit of at least 10 for SUVmax for an automatically created isocontour VOI (Fig. 1). Another attempt using a lower limit of 10% of SUVmax yielded suboptimal results, as a larger part of the renal pelvis was often included in the isocontour VOI when the kidney SUVmax was too low.
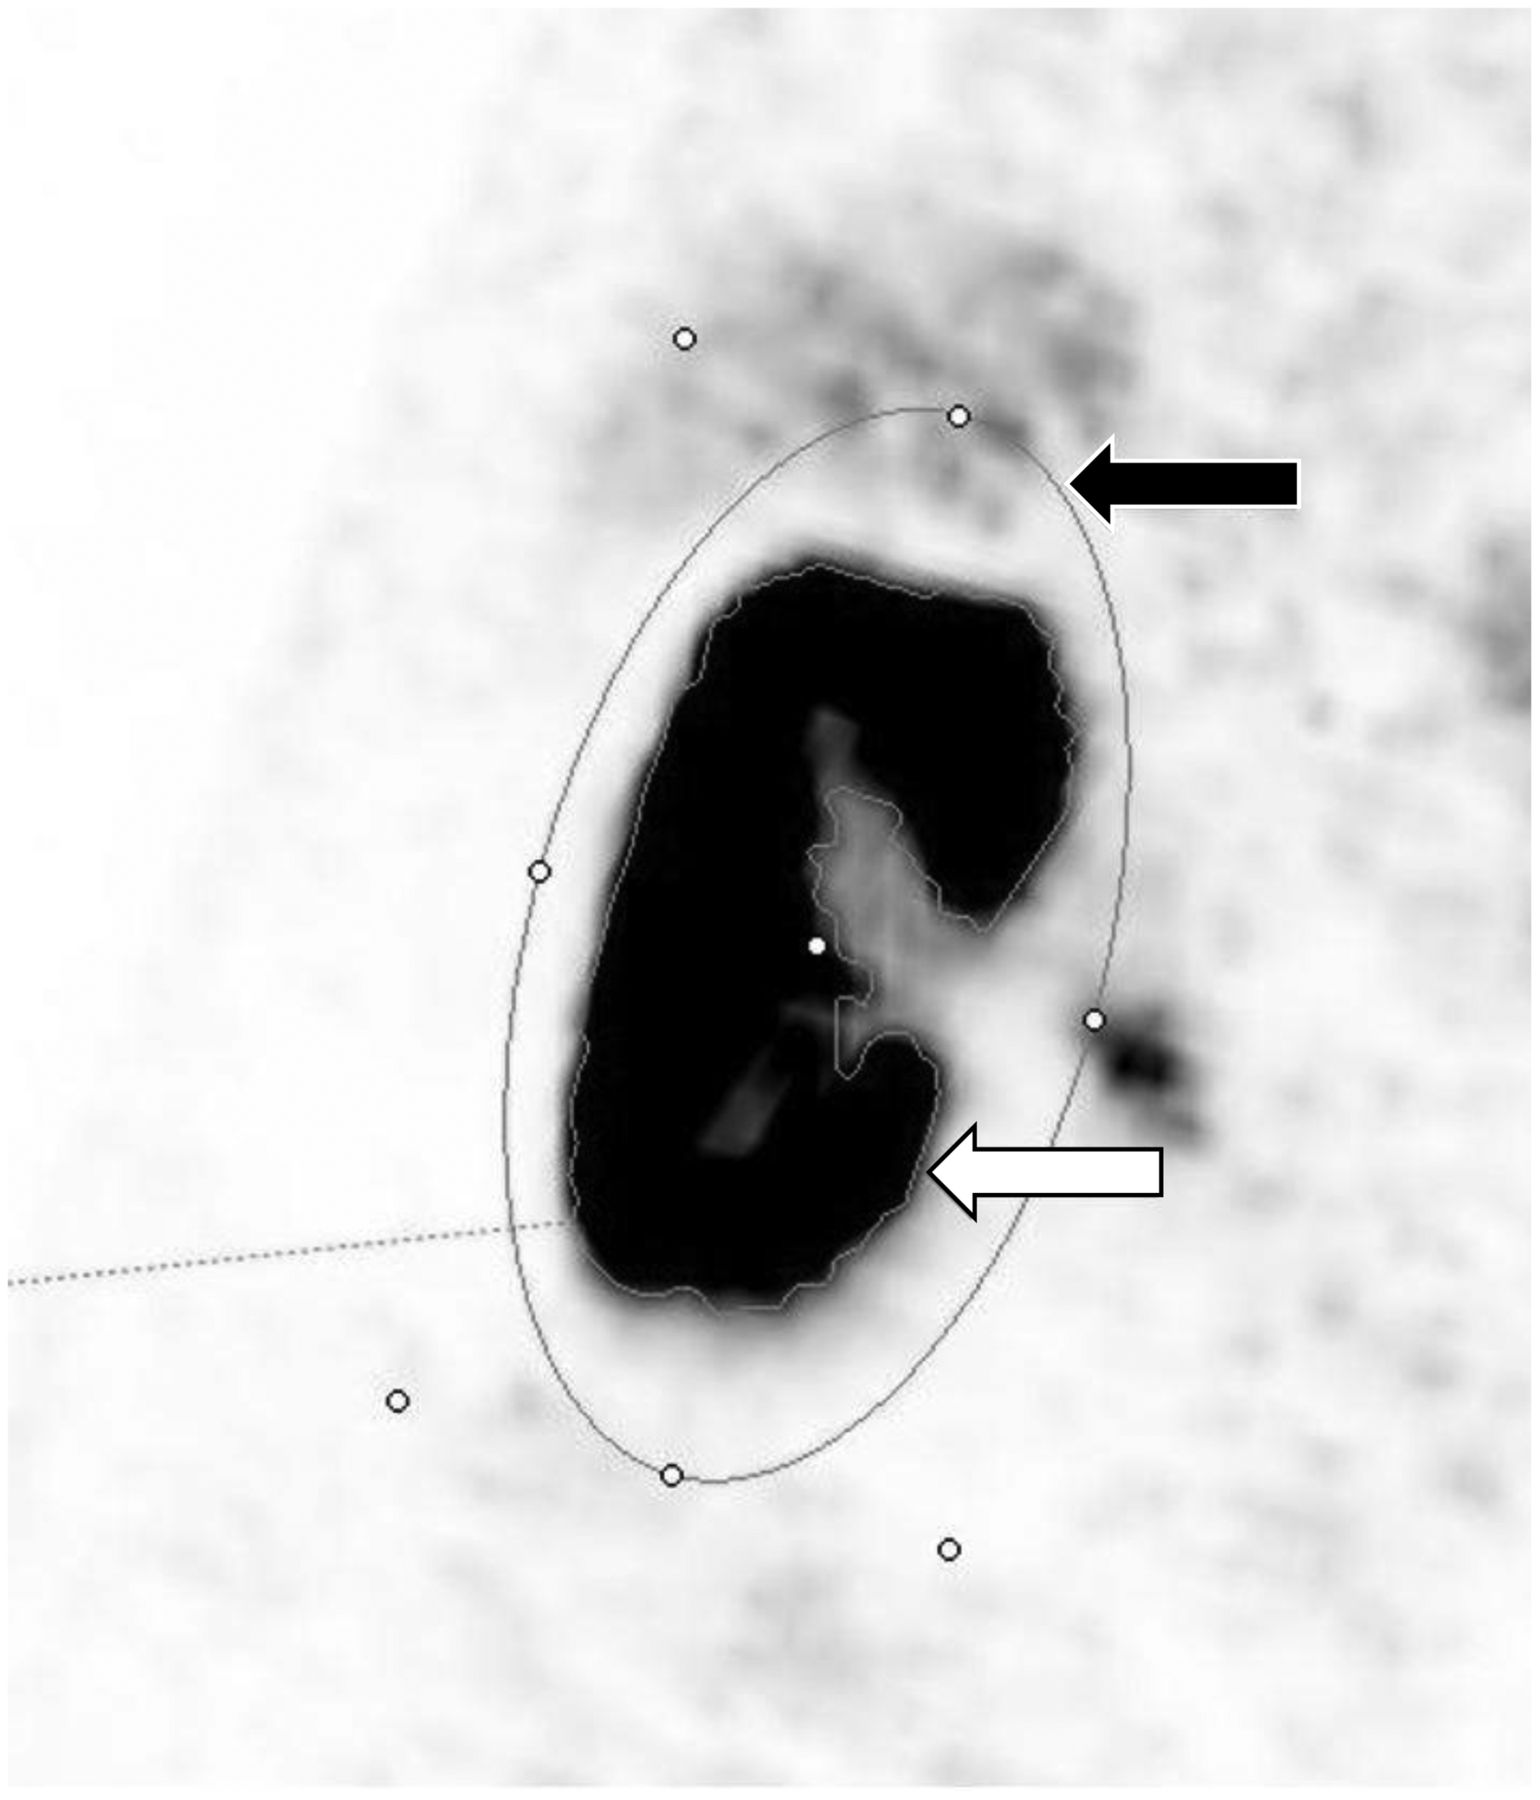
Example of VOI placement. Ovoid VOI is placed around kidney (black arrow). Software automatically traces edge with previously defined lower boundary of SUVmax of 10, thus establishing isocontour VOI with whole cortical kidney volume (white arrow).
Measured Values
PET parameters (SUVmax, SUVmean, volume, and total counts) for each kidney were determined on attenuation-corrected PET images. The SUVmean of the liver, spleen, and blood pool was also obtained with standard VOIs provided by the software (Fig. 2).

Example of VOI placement for liver (A), spleen (B), and blood pool (C). VOIs for liver and blood pool are drawn by software, whereas splenic VOI had to be drawn manually. Color version of this figure is available as supplemental file at http://tech.snmjournals.org.
Calculated Values
From the measured values, SUVmax corrected for lean body weight (SULmax), SUVmean corrected for lean body weight (SULmean), and lean body weight–corrected total lesion glycolysis (TLGSUL) were calculated for each kidney using the lean body mass that was determined using the Janmahasatian formula to take into account the highly variant patient body mass index (ranging from 22.7 to 37.6) (25).
Finally, we calculated the mean renal SUVmax, SULmax, SUVmean, and SULmean (arithmetic mean of right and left kidneys), as well as kidney-to-liver and kidney–to–blood pool ratios, using mean renal SUVmax and SUVmean.
We also calculated the total counts, total TLG, and total volumes of both kidneys (sum of values of both kidneys).
GFR was calculated using the “Modification of Diet in Renal Disease” formula (26).
Statistical Analysis
Statistics were analyzed using SPSS statistical software (version 27.0; IBM Corp.). Data were checked and cleaned for any abnormalities and coded accordingly. Simple descriptive statistics including mean, SD, minimum, and maximum were calculated.
The most common procedure to get a point estimate for strength of linear relationship between 2 continuous variables is to use the Pearson correlation coefficient—provided that the variables follow normal distributions. In the presence of outliers or when the data are not normally distributed but can be ranked, the Spearman rank correlation is the best option.
To get a CI estimate of the correlation coefficient in the case of nonnormal data or with a small sample size, and to diminish the effects of outliers, the bootstrap procedure (a computer-intensive resampling technique) can be implemented to produce a CI estimate for the correlation coefficient.
In this analysis, since some of the covariates were not normally distributed and there were some outliers, we used the Spearman rank correlation coefficient to estimate the strength of the linear relationship, and we used the bias-corrected and accelerated bootstrap method based on 2,000 resamplings to produce 95% CIs for the correlation coefficient.
To find the most parsimonious multiple-linear-regression model with covariates that are significantly associated with GFR and creatinine, a stepwise regression method with backward substitution was implemented.
In the final multiple-linear-regression model, which resulted from the stepwise procedure, only significant covariates, their P values, and 95% CIs for their effect sizes were estimated. Outcomes were tested for normality. The linearity assumption between the outcome and the covariates was checked by Spearman rank correlation.
The final models were tested for significance, residuals were tested for normality, and multicollinearity was checked for all covariates to ensure that no 2 covariates that were highly correlated were included in the final model. All tests were 2-tailed, and a P value of less than 0.05 was considered statistically significant.
RESULTS
From 2018 to 2020, we included 25 men in this study, with a mean age of 71.6 y (SD, 9.84 y) and a mean body mass index of 28.7 (SD, 4.0). Patient characteristics, GFRs, and creatinine values are shown in Table 1. Two patients were excluded because of high calyceal activity. All patients received a diuretic (furosemide) injection. None of the patients had pyelonephritis or hydronephrosis. The mean interval between injection and imaging was 64 min, and the range was 60–70 min.
Descriptive Statistics for Patient Characteristics (n = 25)
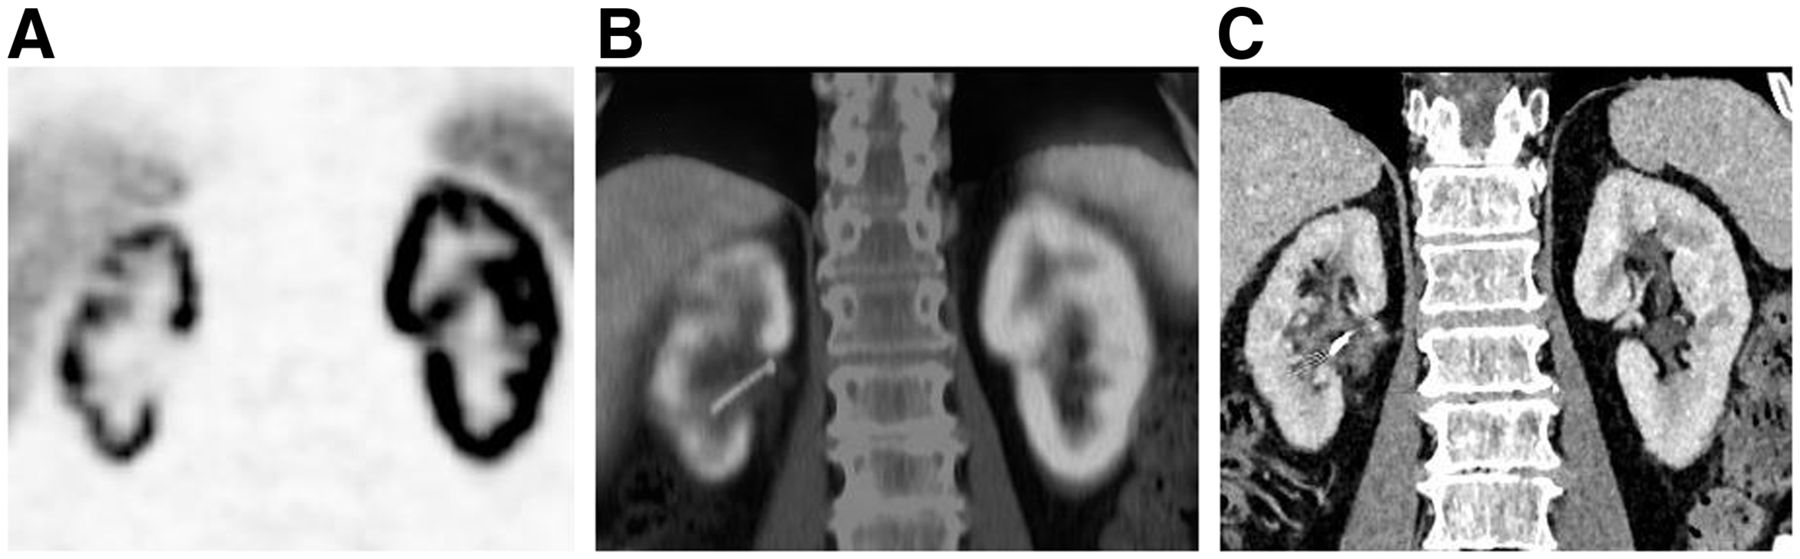
Isocontour VOIs using a lower threshold of more than 10 for SUVmax made it possible to quickly estimate the approximate renal parenchymal volume (Fig. 1), provided the renal pelvis contained no residual tracer, which would overestimate the renal counts, SUVs, and renal volumes (Fig. 3). In most patients, the kidneys had a symmetric appearance and uptake. Seven patients, however, showed either large cysts or defects, and 2 of those showed remarkable asymmetry in measured volume and TLG but not in uptake (SUVmax and SUVmean) (Fig. 4).

Example of excluded patient. Because of the large portion of calyceal tracer (circled), patient was omitted from measurement as software would add this area, falsifying measured values.

Example of strong asymmetry between kidneys. Because of mechanic outflow obstruction, right kidney atrophied and, later, nephrostomy was placed. Shown are PET (A), PET/CT (B), and contrast-enhanced CT (C). Color version of this figure is available as supplemental file at http://tech.snmjournals.org.
Table 2 shows the mean SUVmax, SUVmean, SULmax, SULmean (arithmetic mean of right and left kidneys), total volume, and total TLG of the kidneys and the SUVmean of the liver, blood pool, and spleen.
Measured Values for Renal PSMA PET Parameters (n = 25)
The estimated Spearman rank correlation coefficient between GFR and creatinine with several covariates, along with their P value and 95% CI estimate, are presented in Table 3. GFR was significantly and positively correlated with renal-to-liver and renal–to–blood pool ratios (mean renal SUVmax–to–liver ratio, mean renal SUVmax–to–blood pool ratio, mean renal SUVmean–to–liver ratio, mean renal SUVmean–to–blood pool ratio) and age, whereas it was marginally significantly and positively correlated with mean SULmean. GFR was significantly and negatively correlated with the SUVmean of the blood pool.
Spearman Rank Correlation Coefficient Estimate Between GFR and Creatinine, with Several Covariates Along with Their CI Using Bootstrapping with Bias-Corrected and Accelerated Method Based on 2,000 Resamples
On the other hand, creatinine was significantly and negatively correlated with renal SUV–to–liver and renal SUV–to–blood pool ratios (mean renal SUVmax–to–liver ratio, mean renal SUVmax–to–blood pool ratio, mean renal SUVmean–to–liver ratio, mean renal SUVmean–to–blood pool ratio) and age, whereas it was marginally significantly and negatively correlated with total TLGSUL. It was marginally positively correlated with age and marginally negatively correlated with the SUVmean of the blood pool.
In 2 stepwise regression models for GFR and creatinine as outcomes, total renal parenchymal volume was significantly and directly (positively) associated with GFR (β = 0.12; P = 0.008; 95% CI, 0.035–0.205) and significantly and inversely (negatively) associated with creatinine (β = −0.113; P = 0.009; 95% CI, −0.195 to −0.032).
DISCUSSION
99mTc-DMSA is a radiotracer widely used to image the renal cortex. The scan is used mainly to detect renal parenchymal defects caused by acute pyelonephritis or renal sequelae (scarring) 6 mo after acute infection (27–29). It also helps detect renal abnormalities. The uptake quantification (percentage contribution to total renal function or parenchyma) is used to decide whether surgery is necessary and to assess the split renal function before surgery.
Currently, there is a shortage of DMSA cold kits in various countries, including the United States (18). 99mTc-glucoheptonate is another radiotracer used to image the renal cortex when 99mTc-DMSA is not available, but 99mTc-glucoheptonate is only partially concentrated in the kidneys and then excreted in the urine (30). 68Ga-alizarin red S was studied in animals and humans as a renal cortical PET radiotracer in the 1980s (30). Recently, MRI has been gaining popularity in the diagnosis of pyelonephritis; however, because of complex planning and scan times, it is used only occasionally—that is, in cases of pregnancy, where it has its own drawbacks (31). In a recent metaanalysis study, Sarikaya et al. found overall equivalent sensitivity between MRI and DMSA scanning in detecting parenchymal changes in pyelonephritis, particularly in scar detection (32). There is a need for PET radiotracers to image the renal cortex with a higher resolution. Overall, PET scanners have higher spatial resolution than conventional γ-cameras and can detect smaller defects. On the other hand, new SPECT systems with cadmium-zinc-telluride detectors have better resolution than conventional scanners with sodium iodide detectors (33). Recently, Sarikaya et al. reported that 68Ga-PSMA PET provides excellent images of the renal cortex, shows defects caused by various sizes of cysts, and provides higher-resolution images than DMSA scanning can (14–17).
Renal uptake of 99mTc-DMSA through planar and SPECT imaging in humans and animals has been shown to correlate well with renal function tests, such as effective renal plasma flow, GFR, and creatinine clearance (19–23). Because of high renal cortical parenchymal uptake and an excellent distribution with 68Ga-PSMA-11, in the current study we wanted to determine whether PSMA uptake correlates with renal function tests. We found a significant positive correlation between GFR and renal SUV–to–reference region ratios (liver and blood pool), as well as a marginal positive correlation with renal SULmean. Our statistical analysis also found a significant negative correlation between creatinine and renal SUV–to–reference region ratios, as well as a marginal correlation with renal sum TLGSUL. Because the SUVs are affected by body weight and various other factors, we used renal SUV–to–reference region ratios and lean body mass–corrected SUVs. Blood pool SUV correlated negatively with GFR and positively with creatinine, as expected. Age also correlated negatively with GFR and positively with creatinine, as expected. In 2 stepwise regression models, total renal parenchymal volume was significantly and directly (positively) associated with GFR and significantly and inversely (negatively) associated with creatinine, as expected. With aging, kidney volumes reduce (34). Our method of measuring the approximate renal parenchymal volume on PET images appears to be reliable. Other studies tried to correlate CT kidney volume with renal function but found only weak or moderate correlations in selected patient populations (35).
Because radiolabeled PSMA ligands show high renal parenchymal uptake and renal excretion, studies have assessed renal function after 177Lu-PSMA ligand treatments in metastatic prostate cancer patients. Studies have reported low renal toxicity in castration-resistant metastatic prostate cancer treated with 177Lu-PSMA-617 (12,13). However, it would be interesting to study larger numbers of patients who underwent 177Lu-PSMA therapy and correlate the renal function with the renal PSMA uptake parameters as we did in the current study. In animal models, DMSA uptake correlated with renal function loss in patients receiving chemotherapy (36). In a recent study, PSMA PET quantification of split renal function was compared with mercaptoacetyltriglycine scintigraphy, which showed a significant correlation between the 2 methods (37).
The limitations of our study include the relatively small number of patients and having no patients with a GFR below 50 mL/min, thus measuring GFR only in or just below the reference range for the ages. Further work on the mechanism and physiologic meaning of 68Ga-PSMA-11 renal cortical uptake is also required.
CONCLUSION
68Ga-PSMA-11 renal cortical uptake correlates with renal function tests, such as GFR and creatinine. Our method of measuring the approximate renal parenchymal volume on PET images appears to be reliable.
DISCLOSURE
No potential conflict of interest relevant to this article was reported.
Footnotes
Published online July 30, 2021.
REFERENCES
- Received for publication April 19, 2021.
- Revision received July 7, 2021.


