


Abstract
Evaluation of PET image quality is central to annual physics surveys, quality assurance, and laboratory accreditation. A common method is to image the American College of Radiology (ACR) PET phantom, which contains hot and cold structures of various sizes in a warm background. Performance evaluation involves qualitative assessment of hot and cold structure visibility and overall image quality. Some criteria are quantitative and rely on manually drawn regions of interest (ROIs) to measure SUV. Fully automated scoring of ACR PET phantom images would improve efficiency, avoid observer-related dependencies, and possibly provide more robust evaluation of image quality. Methods: Software was developed to coregister PET images to a phantom template and to compute ROI measurements of hot vial activity (SUVmax) and background activity (SUVmean) automatically. In addition, 3-dimensional volumes of interest (VOIs) were generated to measure hot vial activity (SUVvial), background activity, and cold rod contrast. Consistency of the ROI-based and VOI-based methods was evaluated using phantom data from a total of 17 annual physics surveys of 3 PET/CT scanners with the same PET detector design. Results: The automated software processed all PET phantom datasets successfully. SUV consistency for hot vials was improved through use of cylindric VOIs and through normalization with respect to assayed activities and dilution volumes used in phantom preparation. Average vial SUV SD improved from 8.0% for standard SUVmax to 3.2% for normalized SUVvial. Similarly, the SD for the SUV ratio of 16- to 25-mm vials improved from 5.0% for SUVmax to 3.2% for SUVvial. Background SUVmean had a similar consistency between the ROI and VOI methods. Cold rod contrast was highly consistent, offering a potential alternative to qualitative visual assessment of low-contrast performance. Conclusion: Automated quantitative scoring of the ACR PET phantom is feasible and offers the advantages of more efficient, consistent, and thorough performance characterization. Acceptance ranges for SUVs and ratios likely can be tightened if normalized VOI measurements are used. Further testing with phantom data from a variety of PET scanners is necessary to establish suitable quantitative thresholds for acceptable performance.
Evaluation of PET image quality is a component of laboratory accreditation, annual physics surveys, and routine quality assurance. The American College of Radiology (ACR) PET phantom is commonly used for this purpose (1). The ACR PET phantom consists of a 20-cm cylinder with 6 sectors of cold rods (12.7-, 11.1-, 9.5-, 7.9-, 6.4-, and 4.8-mm diameters) and a lid with 4 hot vials (25-, 16-, 12-, and 8-mm diameters) and 3 cold vials or cylinders (25-mm diameter) representing bone, air, and water. The hot vials and warm background chamber are filled with 18F solutions, prepared by drawing syringes of prescribed activity (±10%) and diluting to a 2.4:1 activity concentration ratio. The phantom is scanned using the laboratory’s typical whole-body imaging protocol, starting 60 min after assaying the syringes in a dose calibrator.
Evaluation of ACR PET phantom images involves 3 steps (2). First, the reconstructed PET images are reformatted as a series of transaxial images of 10-mm slice thickness. Second, the images are evaluated qualitatively with regard to the visibility of the hot vials and cold rods and the uniformity of the background region. Third, region-of-interest (ROI) measurements are made in a single 10-mm-thick slice through the hot and cold vials to measure the SUV of each vial and the central background region (Fig. 1).

Example of standard quantitative measurements specified for ACR PET phantom evaluation. Transaxial slice of 10-mm thickness is generated that includes hot and cold vials. Circular ROIs of 25-mm diameter are drawn, centered over each vial. Circular ROI (diameter between 60 and 70 mm) is drawn over background region. Some pass/fail criteria are based on SUV measurements of these regions, whereas other pass/fail criteria depend on qualitative assessment of hot vial visibility, cold rod visibility, and background uniformity. SUVbw = SUV normalized to body weight. Color version of this figure is available as supplemental file at http://tech.snmjournals.org.
When an institution is applying to the ACR for accreditation, a complete set of phantom slice images and a slice through the vials showing the ROIs and SUV measurements must be submitted. To be considered satisfactory, the phantom study must demonstrate all of the following quantitative criteria (2): SUVmax of 1.8–2.8 for the 25-mm hot vial, SUVmax ratio of the 16-mm vial to the 25-mm vial of at least 0.7, and SUVmean of 0.85–1.15 for the background. In addition, a qualitative assessment of phantom image quality, as performed by 2 trained physicist reviewers, must meet the following criteria. The 12-mm hot vial and the 9.5-mm cold rods must be “visualized with low contrast,” and larger hot vials and cold rods must be “visualized with high contrast.” Artifacts must not be present in more than a few slices of the complete set and “not thought to be clinically significant.”
Several groups have developed automated software for computing quantitative measurements of PET and SPECT phantom studies (3–8). Automated quantitative analysis is desirable for reasons besides saving time and effort associated with manual drawing of ROIs and calculations. Visual assessment of phantom image quality relies on verbal scoring criteria that might be perceived differently by individuals. Manual image-based measurements, though quantitative, also have limited repeatability and are suitable only for simple metrics. By implementing more complex algorithms without user interaction, automated software is expected to avoid interobserver and intraobserver variability and to potentially allow for more consistent and meaningful assessment of image quality. Robust measures are necessary for monitoring changes in scanner performance in annual physics surveys and for harmonizing image quality in multicenter clinical trials (9).
Toward the goal of robust assessment of PET performance, software was developed to perform automated quantitative measurements from PET images of the ACR phantom for evaluation of image quality. In addition to measuring the standard single-slice ROIs specified by the ACR, additional 3-dimensional (3D) volume-of-interest (VOI) measurements were made to evaluate high-contrast performance, low-contrast performance, and uniformity. The reliability of these measurements was assessed and compared by retrospective analysis of images acquired during PET annual physics surveys of scanners having similar PET detector designs spanning multiple years.
MATERIALS AND METHODS
Software was developed in C#/C++ (Visual Studio Express; Microsoft) along with the open-source gdcm library (10) for DICOM files to perform the following multiple steps associated with data analysis:
Template generation. The first step was to compute digital template images of the phantom based on its known geometry, as determined from drawings provided by the manufacturer. This task was complicated by the fact that the phantom may be assembled in various configurations. The cold rod insert may be attached so that the rods are increasing in diameter in a clockwise or counterclockwise direction, and the lid with fixed hot and cold vials may be attached in 6 possible orientations at 60° intervals. For each possible configuration, a template image was generated with the phantom centered in a 256-mm cubic volume with 192 × 192 × 192 sampling (voxel size, 1.333 mm). These template images were precomputed using linear interpolation and stored to a disk.
Data input interface. The user interface allowed the user to identify the DICOM images to be processed. The DICOM headers provided most parameters needed to process images and to compute SUV. The user also entered the necessary data associated with phantom preparation (syringe activities, residual activities, assay times, and type of dilution vessel).
PET preprocessing. After DICOM data had been read and the SUV volume images generated, the scan configuration was determined. The PET slices were analyzed to determine whether the phantom had been positioned with the vials’ side or the rods’ side facing the gantry. The slices were then analyzed to determine the actual phantom configuration (cold rod orientation and lid attachment angle).
Coregistration. The PET image volume was coregistered to the template matching the scan configuration as determined in the prior step, using the mutual-information algorithm with 256 gray levels, with linear interpolation, and without landmarks (11,12). For analysis of low-contrast performance, a separate coregistration was performed using a template only having cold rods, to allow for potential variability in the attachment of the cold rod insert to the phantom body. The PET data were resampled to match the template voxels by linear interpolation.
Standard ACR measurements. Slices 10 mm thick were generated, as specified by the ACR. The standard ROIs were placed on the central slice through the vials to obtain SUV measurements. The background activity concentration was measured as the SUVmean of a 70-mm-diameter circle centered on this slice. The hot vials were characterized by the SUVmax of 25-mm-diameter circles centered on each hot vial of this slice.
High-contrast performance. In addition to the single-slice measurements specified by the ACR, the hot vials were characterized using 3D VOIs. For each hot vial, a cylindric VOI 30 mm high and half the diameter of the vial was centered in the vial. The SUVmean of this cylindric VOI, designated SUVvial, reflected the contrast recovery performance for each hot vial.
Low-contrast performance. The cold rod portion of the phantom characterized the low-contrast performance of the PET scanner. For each of the 6 sectors of the cold rod pattern, cylindric VOIs were positioned on the centers of the cold rods and on the midpoints between adjacent cold rods. The VOI diameter was half the cold rod diameter, and the VOI height was 80 mm. The contrast for each sector was calculated as the difference between the mean midpoint VOI activity and the mean cold rod VOI activity, divided by the mean midpoint VOI activity.
Background (SUV accuracy and noise). A 3D VOI was generated encompassing the entire background region of the phantom while avoiding edge effects. This VOI included all voxels in the upper portion of the phantom, except those within 12 mm of the outer wall, lid, vials, or cold rod insert. The SUVmean and SD were computed for voxels within this VOI.
Processing time per PET phantom dataset was approximately 1 min, using a Dell T5400 workstation with dual Intel Xeon E5405 2.0-GHz quad-core processors.
The software was run retrospectively on PET phantom images from a total of 17 prior annual physics surveys of 3 PET/CT scanners with the same detector design (Siemens Biograph mCT, with time-of-flight capability). Images had been acquired at 2 bed positions for 3 min per bed position, starting 60 min after assaying the syringes prepared with 18F solution. All images had been reconstructed with the same parameters: iterative time-of-flight algorithm with resolution modeling (Ultra-HDPET), 2 iterations, 21 subsets, and 4-mm postprocessing filter.
In each case, the phantom had been prepared according to ACR instructions, using a reference patient dose of 370 MBq (10 mCi) (2). All relevant details of phantom preparation had been recorded, including the assayed activities of the syringes added to the dilution vessel used for the vials (dose A) and to the background chamber (dose B), along with their residual activities and assay times. Syringe minus residual activities (mean ± SD) for doses A and B were 12.9 ± 0.3 MBq (350 ± 7 μCi) and 30.7 ± 0.2 MBq (829 ± 5 μCi), respectively. The dilution vessel was either a 1-L saline bag or a plastic bottle filled with 1 L of water measured with a volumetric flask.
Calculation of SUVs was based on a patient weight of 70 kg, an injected activity of 370 MBq, the syringe assay times, and the actual scan start time. In addition, normalized SUVs were calculated to account for the measured syringe activities (and residual activities) and the volume of the dilution vessel used in phantom preparation. The actual volumes of the 1-L saline bags were not measured, though it has been reported that a sample of 1-L saline bags had an average volume of 1,051 mL (range 1,033–1,069 mL) (13). Thus, the software assumed a dilution volume of 1.05 L when calculating the hot vial normalized SUVs for phantoms prepared using 1-L saline bags.
RESULTS
Hot Vial SUV Measurements
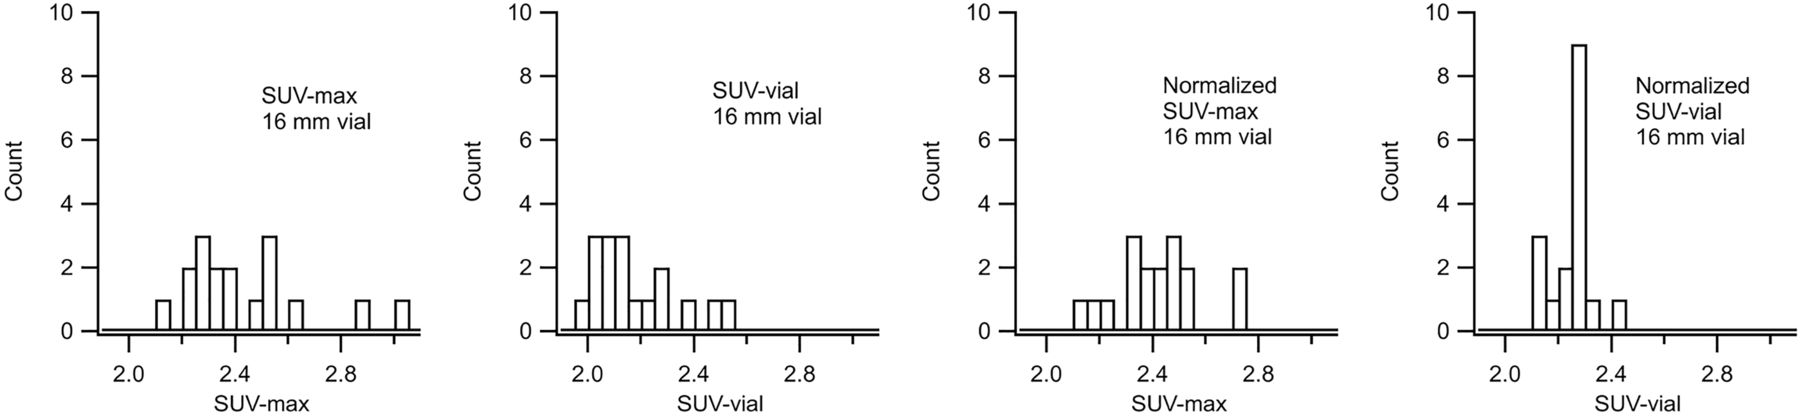
Measurements of hot vial SUVs and normalized SUVs calculated according to the ACR guidelines (SUVmax) and using the cylindric VOIs (SUVvial) are listed in Table 1. For all vial diameters, the SUVvial measurements based on the cylindric 3D VOIs were more consistent across the 17 phantom datasets than were the standard SUVmax measurements. Consistency in SUVmax and SUVvial measurements was improved further through normalization with respect to assayed syringe activities and dilution vessel volume. Starting with the established ACR procedure, the SD for SUVmax averaged 8.0% for the vials. By accounting for activities and volumes, the average SD improved to 5.5% for normalized SUVmax, and using cylindric VOIs, improvement extended to 3.2% for normalized SUVvial.
Hot Vial SUVmax and SUVvial Measured With and Without Normalization Using ACR ROIs and Cylindric VOIs
Histograms of measurements for the 16-mm vial are presented in Figure 2. Compared with ACR SUVmax measurements, the SUVvial measurements were more consistent and had fewer outliers. Normalization noticeably improved consistency in both cases, and the best results were obtained with the normalized SUVvial measurements.

Histograms of SUV and normalized SUV measurements of 16-mm hot vial for 17 phantom studies. From left to right: SUVmax using ACR ROI, SUVvial using cylindric VOI, normalized SUVmax using ACR ROI, and normalized SUVvial using cylindric VOI. Most consistent results are obtained with normalized SUVvial measurements.
Hot Vial SUV Ratios
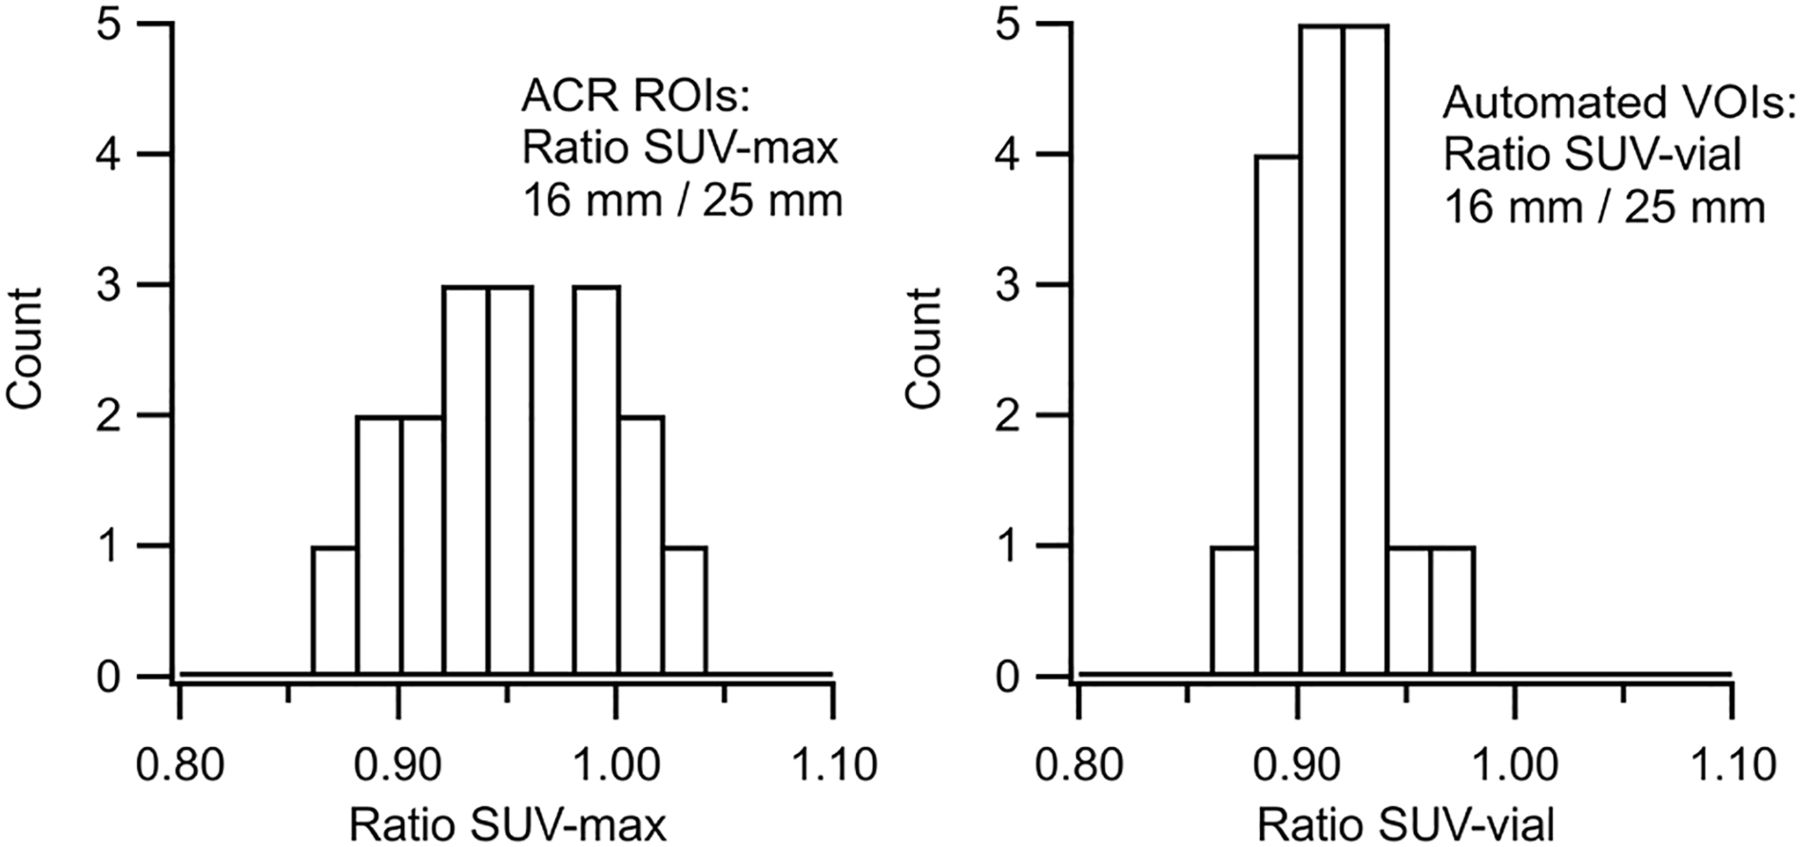
Measurements of the SUVmax ratio and the SUVvial ratio for the hot vials are listed in Table 2. (The effects of normalization cancel in the ratio calculation; thus, the ratios of normalized SUV are redundant.) In all cases, the SUVvial ratios based on cylindric VOIs were more consistent than the SUVmax ratios from single-slice ROIs. The SUV ratio of 16- to 25-mm vials is of particular interest because the ACR sets quantitative acceptance limits for this ratio to evaluate contrast recovery performance (2). Histograms of the SUVmax ratio and the SUVvial ratio for the 16- to 25-mm hot vials are shown in Figure 3. The SD for the 16- to 25-mm hot vial ratio improved from 5.0% for SUVmax ratio to 2.7% for SUVvial ratio. In addition, the SUVmax ratio had outliers exceeding 1.0, which is inconsistent with the partial-volume effect.
Hot Vial SUV Ratios Measured Using ACR ROIs and Cylindric VOIs

Histograms of SUVmax ratio (left) and SUVvial ratio (right) for 16- to 25-mm hot vials. SUVvial ratios were more consistent and, unlike SUVmax ratios, did not have outliers greater than 1.0.
Background (SUV Accuracy and Noise)
Background SUVmean was 1.008% ± 5.2% (mean ± SD) as measured by the ACR circular ROI and was 1.012% ± 5.6% as measured by the automated 3D VOI. Both the means and the SDs agreed between the 2 methods. Noise in the background region, measured as the SD of voxel SUVs in the 3D VOI divided by the mean, averaged 6.8%.
Cold Rod Contrast
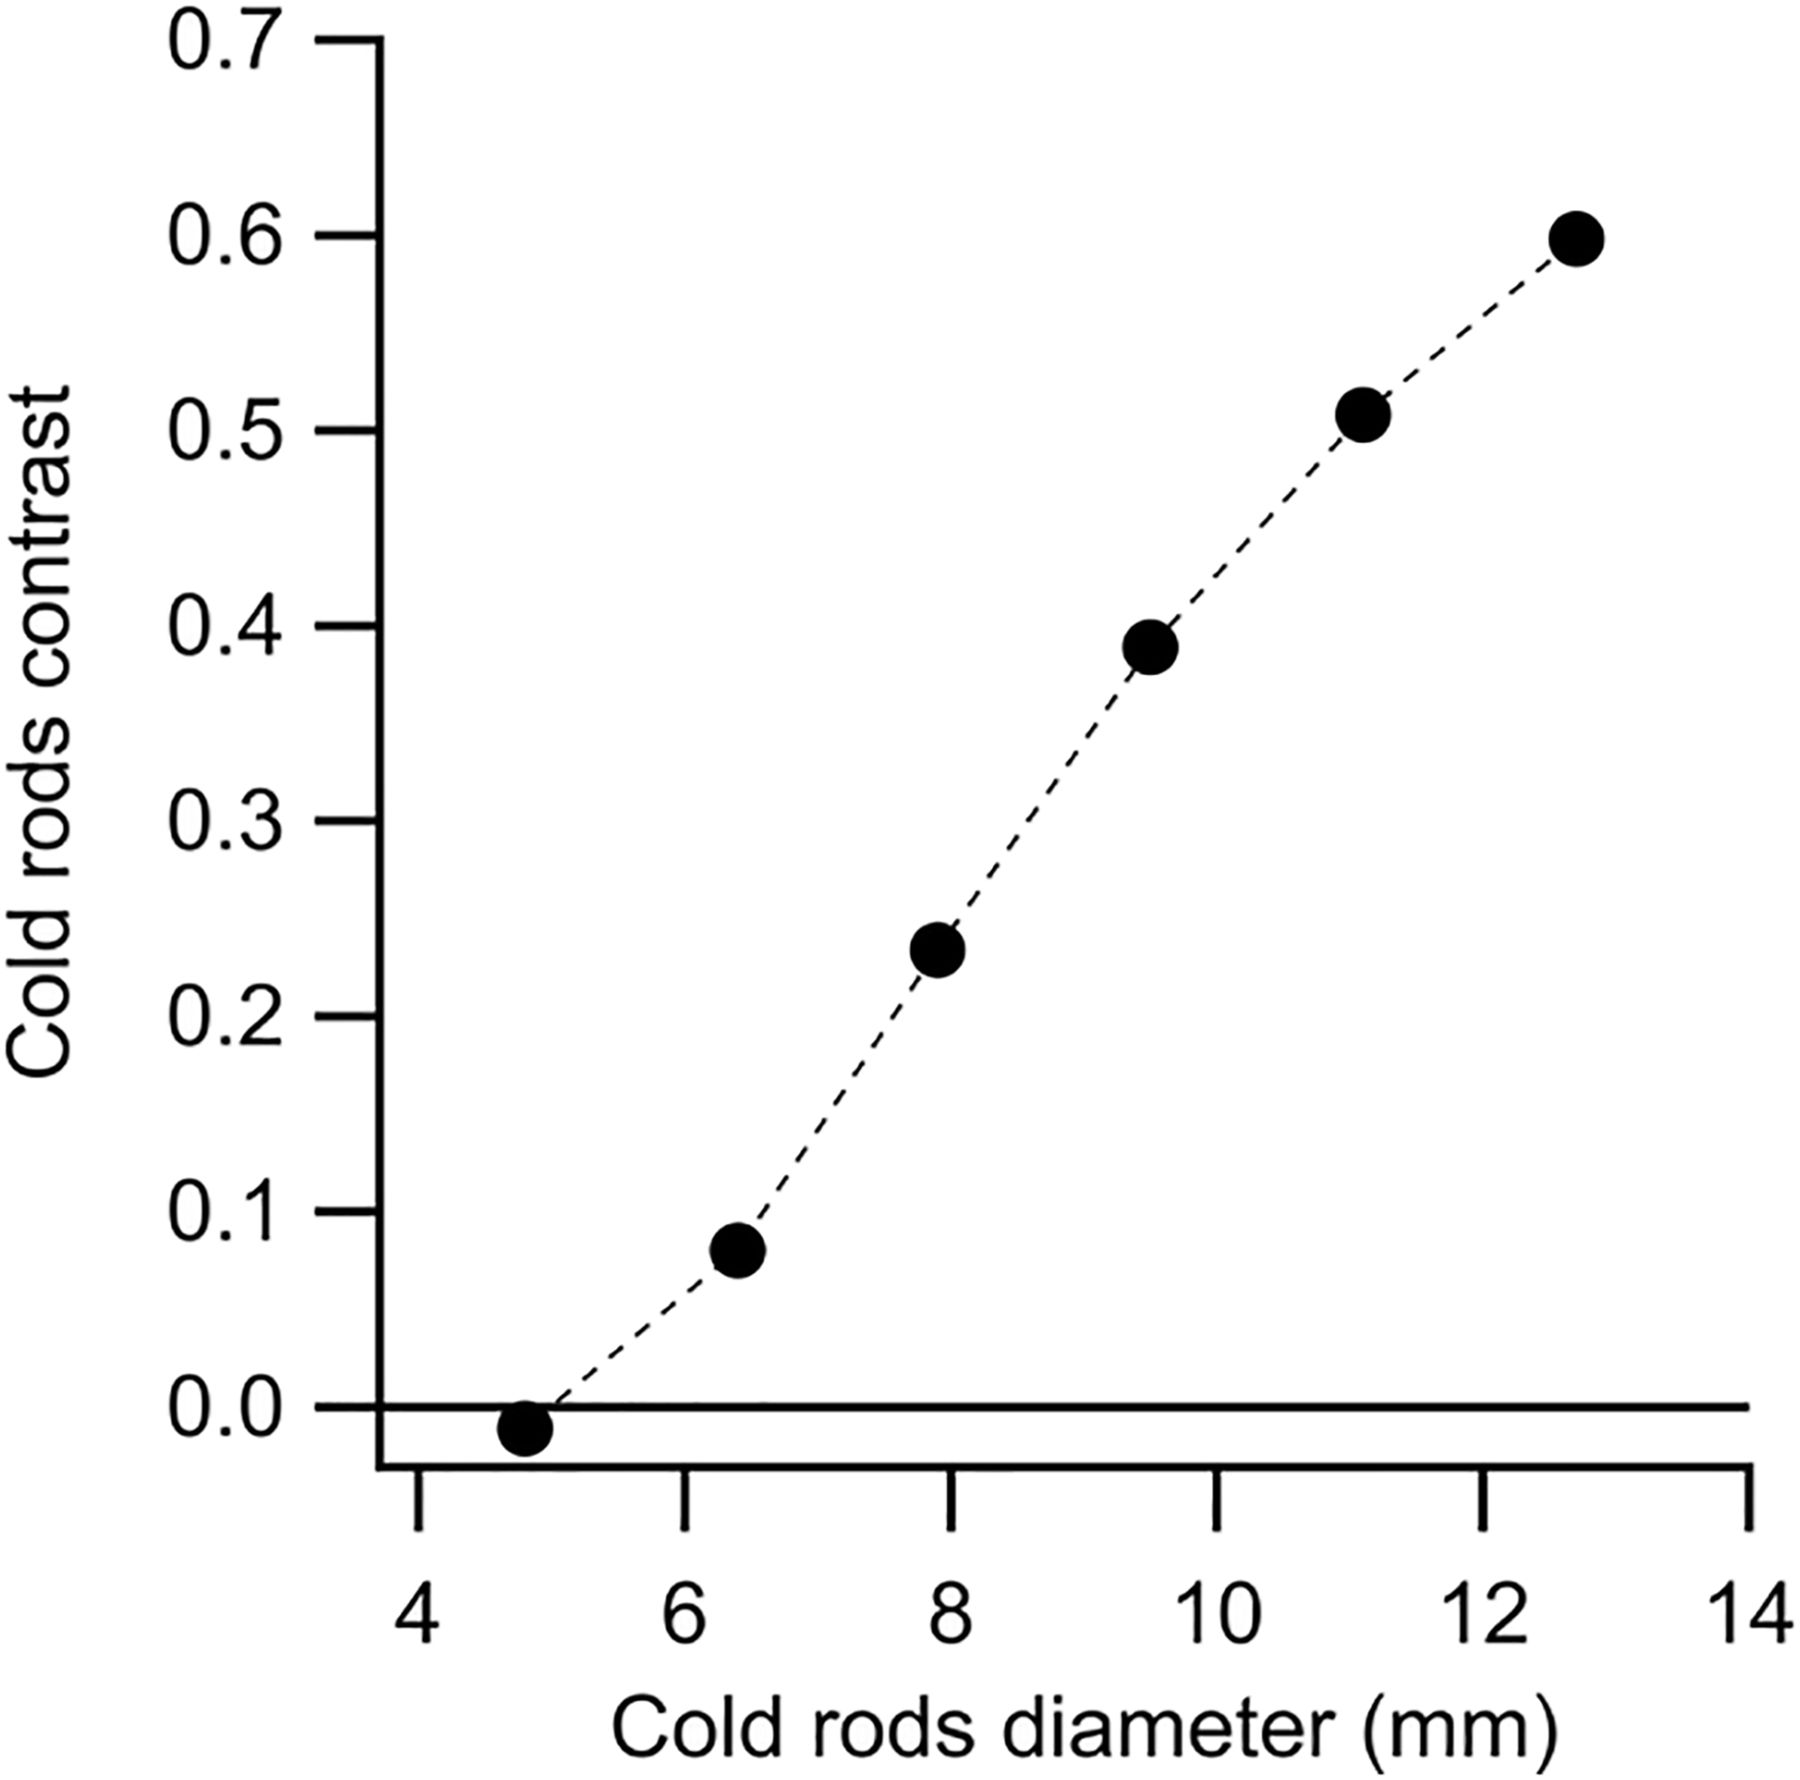
Cold rod contrast measurements (mean and SD for the 17 phantom studies) are listed in Table 3 and graphed in Figure 4. Contrast was greater than 0.2 for the largest 4 sectors of cold rods, which were visually resolved in the 10-mm image slices. (For reference, the ACR acceptance criterion for cold rod visibility is that the third-largest sector be resolved with low contrast and that larger rods be resolved with high contrast (2).)
Cold Rod Contrast for 6 Sectors of ACR PET Phantom

Cold rod contrast versus rod diameter (mean values for 17 phantom studies analyzed). SD for each point is approximately 0.01; error bars are smaller than size of markers.
DISCUSSION
The automated software ran successfully in all cases and was more efficient than manual processing using an image workstation. The software succeeded in determining the actual phantom configuration from the PET images and in coregistering the images to the correct digital phantom template. Although CT images could have been used instead of a digital template, image analysis would have been subject to errors associated with noise and possible artifacts. A goal of the automated software was to enable new measurements based on 3D VOIs for more meaningful quantitative evaluation of PET performance. The availability of 17 prior phantom studies acquired with scanners having the same PET detector design provided an opportunity to evaluate the consistency of the VOI-based measures versus the standard single-slice ACR measures.
Under the ACR procedure, high-contrast performance is assessed quantitatively by the SUVmax of the 25-mm hot vial, which must be in the range of 1.8–2.8. This represents a rather large acceptance range, that is, ±22% with respect to the central value, and indicates the large variability in SUVmax results obtained from typical phantom scans. As known in oncologic PET studies, SUVmax is subject to noise, especially when iterative reconstruction algorithms with a high number of iterations are used (14,15). Ringing artifacts, which can occur when including resolution modeling during image reconstruction, also can artificially increase SUVmax (16). SUVpeak, which is the maximum value of SUV averaged over a specified VOI (10-mm-diameter sphere, typically), often is used instead of SUVmax to characterize lesion uptake because of its reduced sensitivity to noise (17,18). Similarly, the SUVvial measurements using cylindric VOIs were expected to yield more consistent assessment of vial activity concentration, as was confirmed by the phantom data. The consistency of SUVvial measurements was improved further by normalizing with respect to measured activities of syringes used during phantom preparation and to dilution vessel volume. In these phantom studies, the syringe doses had been prepared carefully to closely match the specified activities (SD, 2%). Even so, this variance contributed to nonnormalized SUV variance.
Contrast recovery performance is assessed quantitatively by the SUV ratio of the 16- to 25-mm hot vials, which according to the ACR must be greater than 0.7, using SUVmax. Fortunately, actual doses and volumes associated with preparing the phantom cancel in the ratio calculation. However, error associated with SUV measurements contributes twice in the ratio calculation, which is a concern. The consistency of the SUVmax ratio was limited, as seen in Figure 3, and occasionally a ratio larger than 1.0 was obtained. The SUVvial ratio was more consistent, with measurements clustered tightly around a mean of 0.91. Although in all cases the results passed the ACR criterion, the improved accuracy with the SUVvial ratio has benefits for detecting changes in scanner performance in annual surveys.
SUV accuracy evaluated according to the SUVmean of the ACR single-slice ROI had consistency similar to the SUVmean of the background 3D VOI. This finding indicates that in these phantom studies, SUVmean measured by a 70-mm-diameter circular ROI in a single 10-mm slice was representative of the entire background volume. However, it is likely that a scanner with an outdated normalization calibration would exhibit nonuniformity across slices and would be better characterized by the 3D VOI SUVmean and statistical distribution.
Low-contrast performance is evaluated qualitatively in the ACR protocol by identifying the number of visually resolved cold rod sectors. Quantitative evaluation of cold rod contrast with the automated software offers a more meaningful assessment of low-contrast performance, provided that the measurement has high reproducibility. In these phantom studies, cold rod contrast measurements by the automated algorithm were highly consistent, varying by approximately 0.01. This result indicates that low-contrast performance can be compared precisely between time points or scanners and that variance associated with algorithm implementation and image registration was small. Since the contrast–versus–rod-diameter curve is smooth, with small errors, the curve may be interpolated to determine a minimum detectable rod diameter corresponding to a specified threshold (19).
Overall, the automated software enables reliable quantitative evaluation of PET scanner performance with the ACR phantom. In addition to the improved consistency associated with 3D VOIs (SUVvial instead of SUVmax), further improvement was achieved by normalizing measurements to assayed activities and to dilution vessel volume. The current quantitative pass/fail criteria of the ACR are rather broad (±22% for vial SUV and ±15% for background SUV), apparently to account for variance in phantom preparation and for noise associated with single-slice SUVmax measurement. By compensating for these sources of error, normalized SUVvial measurements may allow the acceptance ranges to be tightened. If tighter acceptance ranges are implemented, dose calibrator accuracy may become a factor. In recent years, the recommended dose calibrator dial settings have changed more than once, by several percentage points (20,21). SUV measurements are affected by dose calibrator settings unless cross-calibration is performed routinely.
Although the use of automated software is promising, this study had limitations that require further investigation. Data were studied from only one PET detector design and one set of reconstruction parameters. This approach allowed for evaluation of the consistency of the automated analysis over a group of similar PET studies, but it did not characterize differences in image quality between scanners and imaging protocols. A future study involving various PET scanners from different vendors would better assess the robustness of the software and the VOI measurements. Furthermore, a prospective study in which raw list-mode data were available would allow for investigation of optimal parameters in image acquisition, reconstruction, and analysis. In this study, for example, the VOI diameters for the vials and cold rods were selected to be half the actual diameters. The VOI dimensions affect noise versus accuracy, since a larger VOI means reduced noise from more statistical averaging but reduced accuracy from greater spillover at boundaries. The effect of scan time and image reconstruction parameters (voxel size, algorithm, number of iterations, postfiltering) on phantom quantitative measurements is another area for further study.
CONCLUSION
Automated software for analysis of ACR PET phantom images using 3D VOIs produces more consistent results than the current specified method, especially when normalizing for assayed syringe activities and dilution volumes used in phantom preparation. Quantitative assessment of high-contrast performance, low-contrast performance, SUV accuracy, and uniformity provides unbiased and meaningful evaluation of image quality. High accuracy of these quantitative measurements may allow for tighter acceptance ranges for PET scanner performance.
DISCLOSURE
No potential conflict of interest relevant to this article was reported.
Footnotes
Published online Apr. 24, 2019.
REFERENCES
- Received for publication October 5, 2018.
- Accepted for publication January 9, 2019.


Jump to section
Related Articles
Cited By...
- No citing articles found.