


Abstract
Kinetic analysis of PET data requires continuous measurement of radioactivity in the arterial blood throughout the acquisition time, termed the arterial input function. The arterial input function is used as an input to compartmental modeling, which can be a better predictor of disease progression than SUV measurements from static PET images. Current common methods of measuring blood concentrations include image-derived, population-based, and manual sampling. These all have challenges due to logistical and technologic issues, as well as patient burden. The aim of this study was to design, develop, and assess a device that is practical and effective for the routine measurement of β-emitting radiotracer concentration in blood without the drawbacks of current methods and for which metabolite analysis is not required. Methods: Designs that integrated a scintillating fiber and a silicon photomultiplier with a general-purpose venous access catheter for in vivo measurement were considered. Other design requirements included miniaturization, high sampling rates, and stopping power for β-particles. Preliminary prototypes were designed to test the feasibility of the concept. Phantom tests were developed to mimic human vasculature. Tests of linearity, sensitivity, signal-to-noise ratios, the impact of vein diameter, and the influence of γ-radiation were conducted. Results: Prototype sensors were constructed using 2 different diameters of polystyrene-based scintillating fibers. Fibers were custom-polished and fixed to a silicon photomultiplier. Sensor output was linear, with R2 = 0.999 over the range from 0.037 to 9.25 MBq/mL. Absolute sensitivity was approximately 450 counts per second per MBq/mL. Measured signal-to-noise ratios ranged from 1.2:1 to 3.2:1 using a blood-to-tissue concentration ratio of 1:1. Sensor output increased with vein diameter and showed no sensitivity to γ-radiation. Conclusion: In experiments with phantom models, the prototype provided accurate measurements of β-emitting radiotracer concentration. The design will be refined for in vivo testing. The ability to routinely gather blood input function data would facilitate the adoption of kinetic modeling of PET data.
The arterial input function is used as an input to kinetic analysis, which can be a better predictor of disease progression than SUV measurements from static PET images (1–4). Such analysis requires a continuous measurement of radioactivity in the arterial blood throughout the acquisition (5).
Current methods for obtaining radiotracer concentrations in blood are population-based input functions, image-derived input functions, and ex vivo measurement. Population-based input function data are pregenerated by combining measurements from arterial samples of multiple subjects in a population. Image-derived input function data are individually generated using volumetric time-slice data from dynamic PET scans in a target area (e.g., wrist artery, internal carotid artery, left ventricle, abdominal aorta). Ex vivo measurements include manual and automated sampling of arterial or arterialized venous blood. The process of arterializing venous blood involves heating of the area of interest. The resulting vasodilation causes localized venous blood to approximate arterial blood. Several authors report that this process is suitable in gathering blood input function data for certain procedures, including 18F-FDG studies, because glucose does readily shunt from arterial to venous (6–12). Some analyses use drawn blood for metabolite analysis, though in many cases, such as 18F-FDG studies, this analysis is not required (13).
Manual ex vivo measurement has several challenges. Highly trained staff are required to collect samples and perform measurements in real time during the procedure (14–16). In the process, they are at an increased risk for exposure to radiation and blood pathogens (15,16). Sample rates are limited because of the operations involved, which can lead to undersampling of the input function (14–16). Human and equipment errors can lead to measurement variability (14–16).
Automatic ex vivo measurements suffer from dispersion effects that must be corrected (14,15). They can require significant shielding (14,15) and multiple system components (16) (e.g., tubing, collection and waste containers, sources of pressure and vacuum), all of which add to complexity.
Both automated and manual blood sampling require equipment sterilization, can cause patient discomfort, can require large volumes of blood to be drawn, and, in rare cases, can lead to medical complications (15).
Population-based input functions also have several challenges. Their creation still requires arterial blood sampling, error-free injections, and populations that match the patient (e.g., diabetic, child, obese) and are radiotracer-specific. Use of population-based input function for an individual patient also requires a blood sample for scaling (17).
Similarly, image-derived input functions have drawbacks. They require a large blood pool and the area of interest to be in the same PET imaging bed (18,19). Additionally, they suffer from partial-volume effects (19) and are prone to errors due to patient movement and volume-of-interest definition variability (18).
In addition to the methods referenced above, there are published examples of using small-diameter scintillating plastic fibers to measure radiotracer concentration directly in tissue or blood vessels (20–23). These fibers do not have the stopping power to measure γ-radiation. Instead, they detect β-particles before annihilation and subsequent production of γ-rays used for imaging. The limited range of β-radiation naturally reduces the radius of detection—an advantage in that it limits the impact of background radiation from outside the vessel. Although used for preclinical research, these fiber-based devices are not known to be available for human use. In addition, they suffer from their own limitations, including requiring multiple points of vascular access and causing partial-volume effects.
The specific objectives of this study were to design, create a prototype of, and assess a device that is practical and easy to use for measuring the concentration of β-emitting radiotracer in blood. The device addresses many of the drawbacks that limit the adoption of current methods. For cases in which metabolite analysis is required, the device might also be used to draw blood samples.
MATERIALS AND METHODS
Design Concept
The proposed design consists of a polystyrene-based scintillating fiber that is readily commercially available, has low light loss, is flexible, and has adequate stopping power for β-particles. The fiber is integrated with a general-purpose venous access catheter (Fig. 1). Additionally, a miniature silicon photomultiplier (SiPM) is contained in the catheter assembly to minimize loss of scintillation light. This design allows measurement of radiotracer concentration in blood without requiring additional venous access. Additional circuitry is contained in a bedside or wearable data logger, which enables acquisition of data with a high frame-rate sensor.
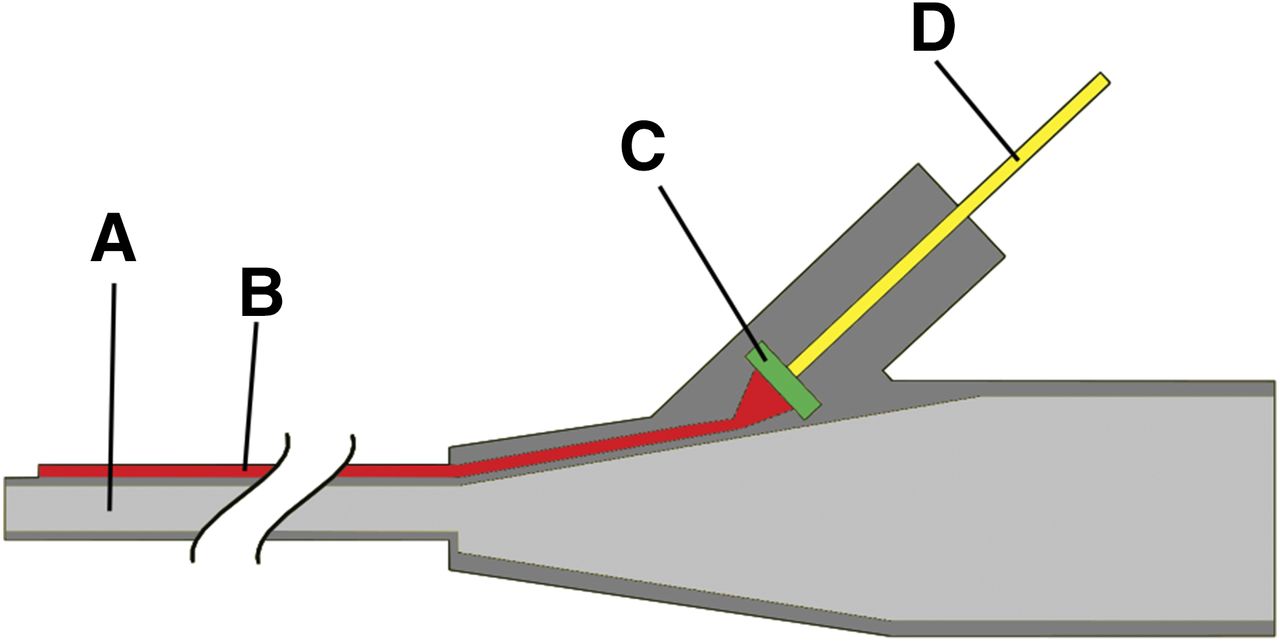
Cross-section diagram of proposed scintillation catheter consisting of intravenous catheter (A), scintillation fiber (B), SiPM (C), and electrical signal wires (D).
Prototype Device Construction
For initial evaluation of the proposed design, 2 prototypes of the scintillating fiber assembly were constructed using fibers 0.25 and 0.5 mm in diameter (Fig. 2). Both fibers were BCF-12 material (Saint-Gobain Crystals) with a peak emission wavelength of 435 nm, a 3.2-ns decay time, and approximately 8,000 photons/MeV. Each fiber was polished using a custom fixture based on commercially available fiber optic polishing systems. Each fiber was affixed with epoxy (Double/Bubble no. 04004; Royal Adhesives and Sealants, LLC) to a polished 3-mm-diameter acrylic light guide and custom mounting screw.

Cross-section diagram of prototype detector consisting of scintillation fiber (A), mounting screw (B), acrylic light guide (C), SiPM (D), and electronic circuitry (E).
The detector was designed to ensure coplanar alignment of the light guide and a 3 × 3 mm SiPM (MicroFC-30035-SMT; SensL Technologies, Ltd.). This SiPM is a good candidate for the design because of its high microcell density, low breakdown voltage, and sensitivity to wavelengths of light produced by the chosen fiber. Optical coupling gel (SS-998; Silicone Solutions) enhanced transmission between the light guide and SiPM.
Sensor electronics were based on a transimpedance amplifier front end for readout of the SiPM. Amplified signals were then screened using a lower-level discriminator threshold circuit. Full energy windowing was not used for thresholding to simplify the design. Additionally, using a simple asynchronous pulse-counting scheme, sensors obtained a high rate of data acquisition. Sensor hardware counts pulse 99.95% of the time. The remaining time is spent storing and transmitting counts to a connected personal computer. The sensor is susceptible to pulse pile-up dead time, but this phenomenon is lessened by the fast decay time of the plastic scintillation fiber (3.2 ns), high-speed electronics (236-MHz amplifier), and relatively low count rates expected. Linearity and sensitivity were measured over the range of activities expected, but not to the point where pileup is evident. Before testing, the lower-level discriminator was set just above the level of background electrical noise.
Phantom Testing
All testing was performed within a light-proof box to block ambient light. The experimental setup was positioned behind lead bricks to minimize radiation exposure to personnel.
To simulate human vasculature, artificial veins were made of plastic tubing (0.25- to 0.35-mm wall thickness) with internal diameters of 2.3, 4.75, and 6.3 mm. These diameters represented arm veins commonly used for radiotracer injections in PET procedures (24). One end of each vein was sealed with epoxy. Additionally, a plastic cylinder of 27-mm internal diameter simulated tissue surrounding the artificial veins.
The impact of vein diameter on sensor output was assessed by immersing each fiber in the 2.3- and 6.3-mm artificial veins, as well as in the 27-mm cylinder. Each was filled with a 0.37 MBq/mL concentration of 18F-FDG.
During a typical injection, the radiotracer concentration in blood is expected to vary greatly. Assuming an injected dose of 370 MBq of 18F-FDG in a patient weighing 68 kg, blood concentration within the first 90 s is estimated to be 100 kBq/mL. By the 2-min mark, the concentration would drop to approximately 40 kBq/mL, and thereafter it would slowly drop to approximately 5.5 kBq/mL over the course of an hour (18). Over the same time, the concentration in tissue surrounding the vein would rise to the same approximately 5.5 kBq/mL. Depending on the range of the β-particles, the fiber may detect activity from outside the vein. This study defined the signal-to-noise ratio as the ratio of measured activity inside the vein (signal) to that outside the vein (noise). As the blood-to-tissue concentration ratio approaches 1:1, activity from outside the vein contributes a larger fraction of the particles that are detected. To measure activity from outside the vein, each fiber was inserted into each artificial vein filled with plain water. Measurements were then taken with the water-filled veins inserted into the 27-mm-diameter cylinder filled with a 0.37 MBq/mL 18F-FDG solution. Data from the vein-diameter impact test were used for the signal portion of the signal-to-noise ratio calculation.
Performance Testing
Detector linearity and absolute sensitivity were assessed by taking measurements with the 0.5-mm-diameter fiber in a solution of 18F-FDG as it decayed from 9.25 to 0.037 MBq/mL. Temperature compensation of sensor data was performed post hoc using a linear correction.
Measurement of γ- Versus β-Emissions
Although the travel distance of β-radiation is low, γ-radiation travels much farther and may influence measurements. To measure the detector’s sensitivity to γ-radiation, a solution of 99mTc was prepared with an activity of 19 MBq and placed in a test tube. 99mTc was chosen for this test for 2 reasons. First, its 140-keV photons would be more easily stopped by the scintillating fiber than the 511-keV photons of 18F, resulting in higher sensitivity. Second, 99mTc, being a pure γ-emitter, removes the possible influence of β-particles on the measurement. The 0.5-mm-diameter fiber was first placed 50 mm away from the test tube radially, then 2 mm axially above the test tube, and finally submerged approximately 25 mm into the solution. Measurements were taken at each location.
RESULTS
Linearity
Linearity was calculated by comparing the measured signal with the theoretic level as the isotope decayed over the concentration range of 9.25–0.037 MBq/mL. Over this range of concentrations, the system has bandwidth sufficient to prevent pulse pileup from being a factor in linearity (Fig. 3). Sensor output is linear, with R2 = 0.999.
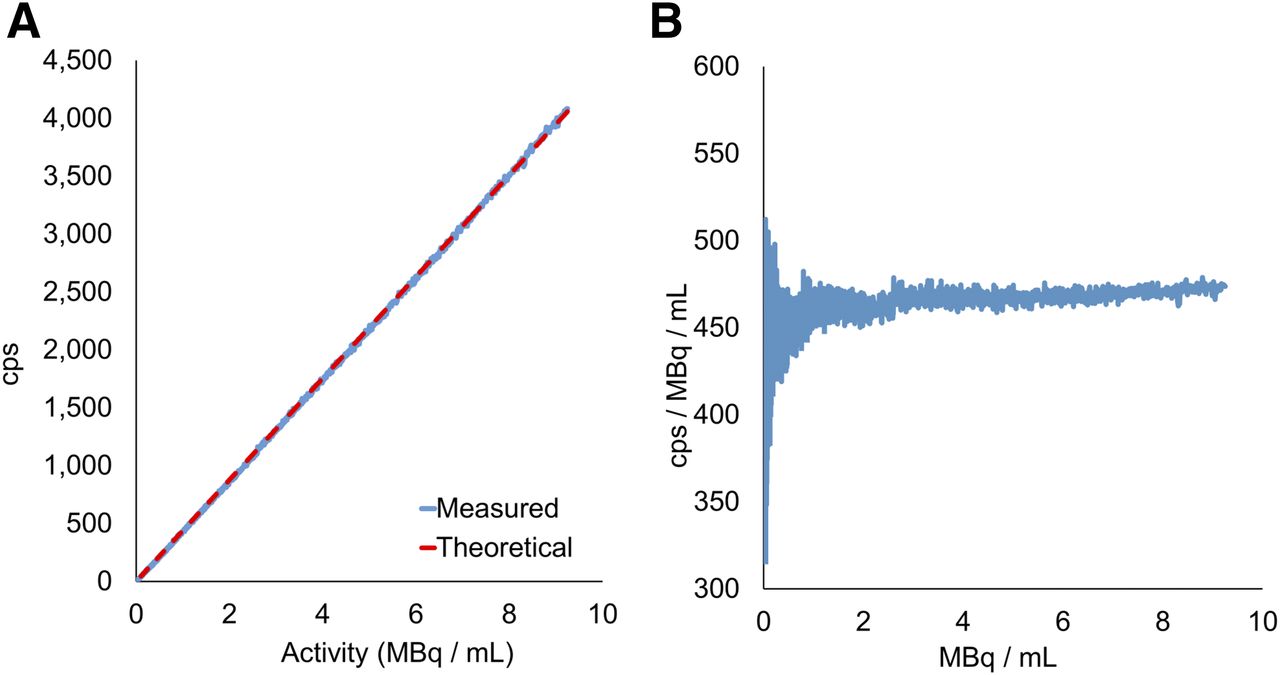
Detector linearity (A) and absolute sensitivity (B). cps = counts per second.
Absolute Sensitivity
Using data measured while the isotope decayed from a concentration of 9.25 to 0.037 MBq/mL, we calculated absolute sensitivity to be approximately 450 counts per second per MBq/mL (Fig. 3). This study did not investigate the relationship between fiber diameter and sensitivity, but smaller-diameter fibers would be expected to be less sensitive.
Signal-to-Noise Ratio
Figure 4 shows measurement of noise originating from activity outside the vein. This measurement may have been affected by a lack of centeredness of the fiber within the artificial vein. Results of the signal-to-noise ratio experiment ranged from 1.2:1 to 3.2:1. The scenario tested in this study was a worst case in that the blood-to-tissue concentration was 1:1, which may occur at the end of uptake. During most of the uptake period, the blood-to-tissue concentration ratio is much higher than 1:1, for instance 25:1, and the signal-to-noise ratio improves accordingly.
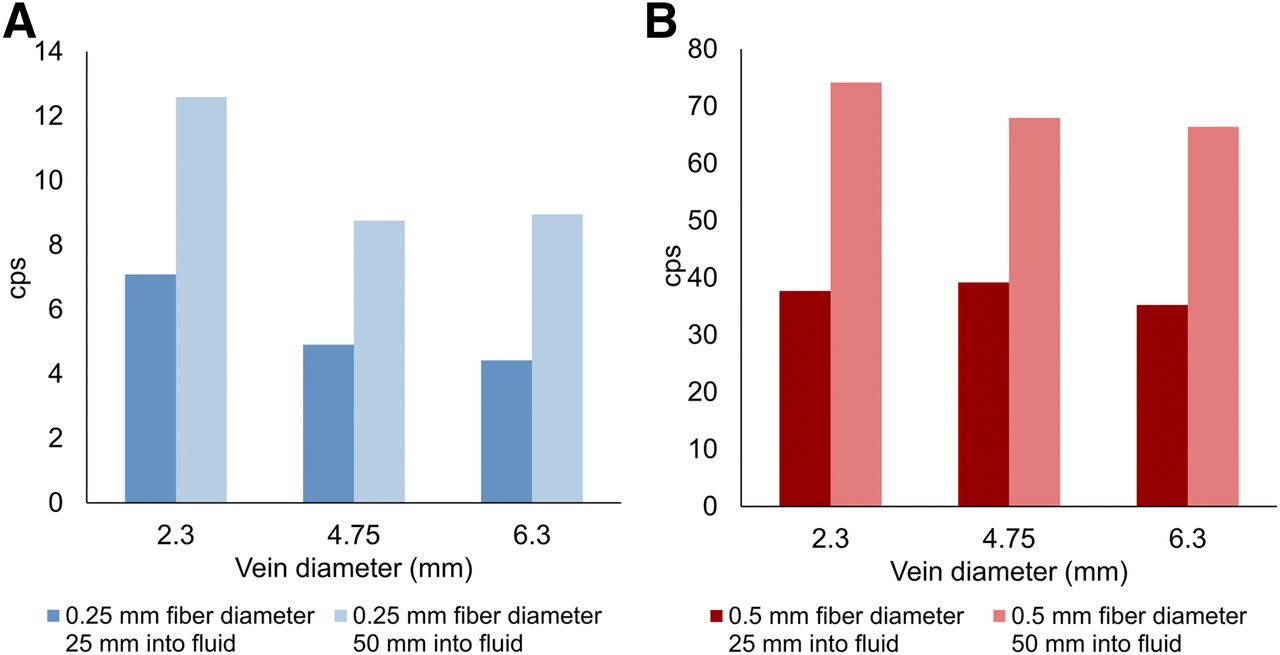
Background counts as function of vein diameter at 2 different depths of insertion. cps = counts per second.
Impact of Vein Diameter
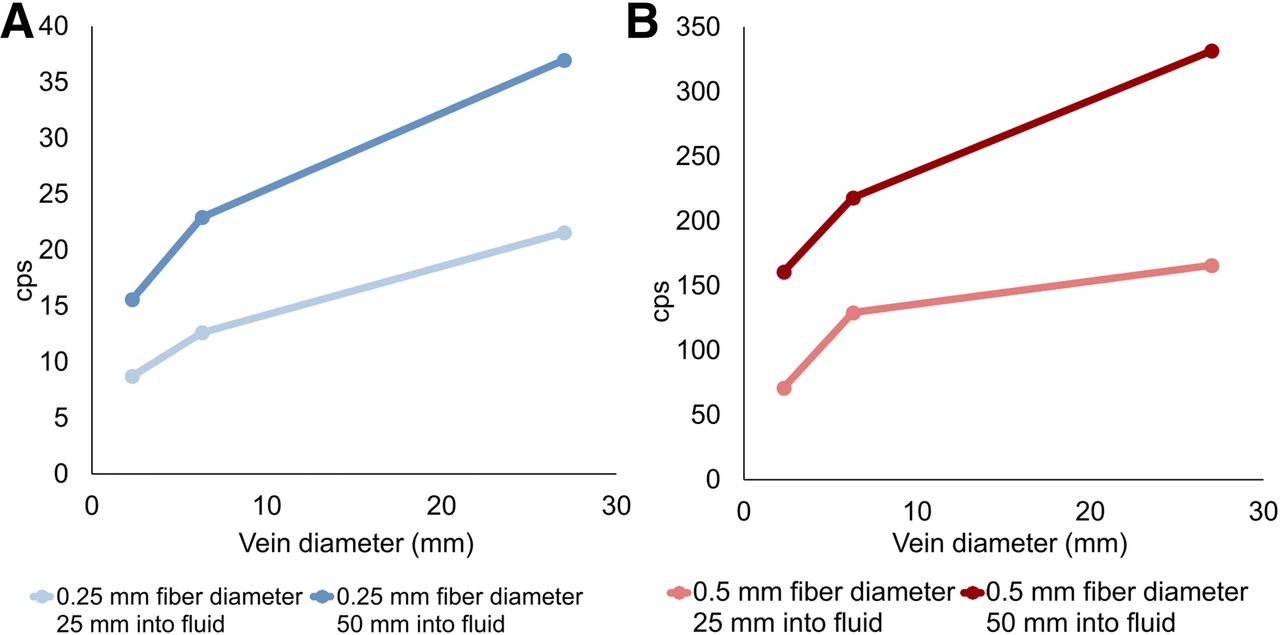
As vein diameter increases, sensor output should also increase until the radius equals the positron’s maximum range (2.16 mm for 18F in water (25)). Experimentally, sensor output did increase with vein diameter, but the number of vein diameters tested was insufficient to fully characterize the relationship (Fig. 5).

Impact of vein diameter. cps = counts per second.
γ- Versus β-Emissions
The experiments of γ- versus β-emission showed no response to 99mTc. All 3 experimental locations registered zero counts per second.
DISCUSSION
Kinetic modeling has been shown to be a better predictor of disease progression than static measures in some cases (1–4). Kotasidis et al. and Takesh summarized the use of kinetic modeling with various tracers and various pathologic conditions with promising results. However, kinetic modeling is difficult to implement in routine clinical practice (4,13,26). Dunnwald et al. suggested that the results of their study of kinetic modeling versus static measures in neoadjuvant breast cancer patients should provide an impetus for development of clinically practical approaches for obtaining 18F-FDG kinetic measures for tumor response evaluation (2). To move kinetic modeling from the realm of drug development and clinical research into everyday clinical use for the benefit of all patients, new ideas must be considered.
An in situ detector design could be a clinically practical approach for measurement of the blood input function without the limitations of current methods. The proposed design may not require arterial blood sampling, complex equipment or shielding, or additional time or exposure risk for staff. Additionally, it would provide a high rate of sensor data acquisition to accurately measure the dynamic concentration fluctuations encountered during and after injection.
However, the full benefits of the proposed design depend on the applicability of venous blood as a surrogate for arterial blood in creation of the input function. Venous or arterialized venous blood would be advantageous for use with the proposed design because patient discomfort would be limited to one venous access. However, arterialization of arm or hand blood is not without drawbacks. It typically involves the use of a heating pad or box for several minutes. Additionally, whereas several authors report that arterialized blood is applicable for glucose measurements (6–12), it is not appropriate for all analyses (27). However, even if this dependency does not apply, the proposed design could still be useful. The design, whether used as an arterial or a venous catheter, could both measure input function data and allow blood sampling for metabolite analysis.
There were limitations to this study. The fiber was not well centered within the artificial veins, introducing effects by which activity outside the vein was measured unintentionally. The difficulty in centering the fibers during experimental testing was unanticipated but could be corrected in future designs. Additionally, the limited number of tested artificial veins limited our ability to measure the true fiber detection radius. The inflection point indicating the maximum radius of detection was not evident because of the limited number of diameters tested. Although not an issue during this study or with 18F-FDG in the clinic, a limitation of the overall concept is that an in situ device without blood sampling could not discriminate between administered radiopharmaceutical and its metabolites (16,28). This study did not test experimentally the lowest activity anticipated after an hour of uptake time of approximately 5.5 kBq/mL. Given the detector’s sensitivity of 450 counts per second per MBq/mL, only 2 counts per second would be expected at this activity level. To adequately measure blood activity for an entire uptake period, detector sensitivity must be improved. However, for 18F-FDG, low levels of blood activity are anticipated during only the later part of the uptake period. Blood concentration curves are typically steady during this time and could be extrapolated from the earlier portion of the uptake time.
Further research is required to integrate the fiber with a catheter, develop a mechanism to center the fiber within the vein, investigate methods to control the fiber detection radius, and determine optimal fiber length. Methods for catheter integration and centering of the fiber can be informed by existing cardiovascular intravenous catheter technology. In addition, it may be advantageous to include a layer of β-particle shielding between the fiber and the catheter lumen. This could reduce the impact of any radiotracer that remains in the lumen after injection and flushing (29). Two possible methods to control the fiber detection radius include adjustment of the lower-level discriminator to discard lower-energy particles and application of a thin shielding material over the fiber. These methods would discard or block lower-energy particles, which tend to have originated farther away. The shielding layer would also provide the benefit of blocking ambient light. Sensitivity of the device is expected to increase with fiber length. However, any scintillating fiber outside the vein would contribute background noise. A scintillating tip connected to a nonscintillating optical fiber for transmission is one option to alleviate this noise (20,30). However, the 2-material approach could cause loss of scintillation light at the junction while also increasing complexity and cost. Studies would be required to determine the optimal fiber configuration.
Although additional work is needed, this study demonstrated the feasibility of a detector based on an SiPM and plastic scintillation fiber. As development progresses, validation (e.g., additional bench testing, animal studies, human clinical studies) must be performed against the current methods of arterial input function measurement.
CONCLUSION
This study performed initial feasibility testing of a low-cost, disposable, scintillating venous access catheter design that has the potential to provide radiotracer blood concentration data for kinetic modeling. The ability to routinely gather blood input function data would facilitate the adoption of kinetic analysis in the clinic.
DISCLOSURE
No potential conflict of interest relevant to this article was reported.
Footnotes
Published online Aug. 23, 2018.
REFERENCES
- Received for publication April 2, 2018.
- Accepted for publication July 4, 2018.


Jump to section
Related Articles
Cited By...
- No citing articles found.