


Abstract
Algorithms are able to compute myocardial blood flow (MBF) from dynamic PET data for each of the 17 left ventricular segments, with global MBF obtained by averaging segmental values. This study was undertaken to compare MBFs with and without the basal–septal segments. Methods: Data were examined retrospectively for 196 patients who underwent rest and regadenoson-stress 82Rb PET/CT scanning for evaluation of known or suspected coronary artery disease. MBF data were acquired in gated list mode and rebinned to isolate the first-pass dynamic portion. Coronary vascular resistance (CVR) was computed as mean arterial pressure divided by MBF. MBF inhomogeneity was computed as the ratio of SD to mean MBF. Relative perfusion scores were obtained using 82Rb-specific normal limits applied to polar maps of myocardial perfusion generated from myocardial equilibrium portions of PET data. MBF and CVRs from 17 and 14 segments were compared. Results: Mean MBFs were lower for 17- than 14-segment means for rest (0.78 ± 0.50 vs. 0.85 ± 0.54 mL/g/min, paired t test P < 0.0001) and stress (1.50 ± 0.88 vs. 1.67 ± 0.96 mL/g/min, P < 0.0001). Bland–Altman plots of MBF differences versus means exhibited nonzero intercept (−0.04 ± 0.01, P = 0.0004) and significant correlation (r = −0.64, P < 0.0001), with slopes significantly different from 0.0 (−7.2% ± 0.6% and −8.3% ± 0.7% for rest and stress MBF; P < 0.0001). Seventeen-segment CVRs were higher than 14-segment CVRs for rest (159 ± 86 vs. 147 ± 81 mm Hg/mL/g/min, paired t test P < 0.0001) and stress CVR (85 ± 52 vs. 76 ± 48 mm Hg/mL/g/min, P < 0.0001). MBF inhomogeneity correlated significantly (P < 0.0001) with summed perfusion scores, but values correlated significantly more strongly for 14- than 17-segment values for rest (r = 0.67 vs. r = 0.52, P = 0.02) and stress (r = 0.69 vs. r = 0.47, P = 0.001). When basal segments were included in MBF determinations, perfusion inhomogeneity was greater both for rest (39% ± 10% vs. 31% ± 10%, P < 0.0001) and for stress (42% ± 12% vs. 32% ± 11%, P < 0.0001). Conclusion: Averaging 17 versus 14 segments leads to systematically 7%–8% lower MBF calculations, higher CVRs, and greater computed inhomogeneity. Consideration should be given to excluding basal–septal segments from standard global MBF determination.
Quantitation of myocardial blood flow (MBF) and myocardial flow reserve (MFR) provides clinically useful information (1–5). Although the recognized reference standard for absolute quantification of MBF is 15O PET, 82Rb PET is more widely available, and 82Rb PET MBFs have been found to correlate strongly with those obtained by 15O PET (6). It is now common to see MBF reported separately for each of the 17 standard American Heart Association/American College of Cardiology left ventricular (LV) segments (Fig. 1), with global values obtained by averaging over segments.

American Heart Association/American College of Cardiology 17-segment map.
Reproducibility of MBF measurements has been studied for several different algorithms (7), and sources of variability have been explored, including unexpected decreases in MBF, MFR, and measurement reproducibility for supposedly healthy subjects (8,9). Questions have arisen as to whether the apparently wide variability in PET measurements for healthy subjects is due to variations associated with age and sex or to technical factors that augment imprecision (10,11). Optimal means for defining the input function for quantifying MBF in analyzing first-pass dynamic curves have been considered (12–14), because adequate bolus delivery can be technically challenging in some cases.
The choice of regions sampled to produce global values is among the issues that could affect MBF and MFR measurements. We noticed that in some patients basal segmental MBFs appeared to be low, despite all other perfusion and functional measures being normal. This raised concern that MBFs from the basal–septal regions might be artifactually reduced because of sampling of myocardial activity near the count-poor membranous septum and contiguous LV outflow tract, potentially compromising calculation of global MBF. We are not the first to be concerned about the impact of including basal segments (8,15), but the magnitude of potential quantitation errors has not been explored.
Consequently, the objectives of our investigation were to document the degree to which MBF and MFR numeric variations are greater in basal segments than in the rest of the myocardium and to test the hypothesis that including basal–septal segments in global MBF calculations systematically decreases measured global MBF.
MATERIALS AND METHODS
Patients
Data were evaluated retrospectively for 196 patients (mean age ± SD, 69 ± 13; 113 men) who were referred for MBF determination as part of their assessment for potential cardiac disease. All patients underwent rest and regadenoson-stress 82Rb PET/CT studies between January 1, 2010, and June 30, 2011. The St. Francis Hospital Institutional Review Board approved this retrospective study, and the requirement to obtain informed consent was waived. All data were handled in compliance with the Health Insurance Portability and Accountability Act of 1996.
Image Acquisition
All data were acquired in 2-dimensional mode on a PET/CT unit consisting of a 64-slice CT component and a 24-slice PET component (Discovery VCT; GE Healthcare). The manufacturer’s recommended reconstruction algorithms were used (ordered-subset estimation maximization with 20 subsets for 2 iterations, a standard z-axis filter, and a postprocessing filter of 2.57 mm in full width at half maximum), which corrected for scatter and random events and used the CT scan to correct for attenuation.
Stress was induced pharmacologically using regadenoson, following standardized protocols that included patient preparation, a period of fasting, abstention from caffeine, and withholding of cardiac medications (16,17). Throughout imaging, physiologic parameters were monitored and recorded, including blood pressure, heart rate, and cardiac rhythm. Rest images were acquired in gated list mode over 7 min, with data acquisition beginning just before the start of a 30-s continuous infusion of 0.94–1.22 GBq (35–45 mCi) of 82Rb eluted from a strontium–rubidium generator (Bracco Diagnostics Inc.). A supervising cardiologist used a β-probe to monitor activity delivered to the patient during 82Rb infusion (17), to ensure that delivery of the bolus was sufficiently rapid to provide valid first-pass information. Data were discarded and not subsequently analyzed for any cases in which bolus delivery was inadequate. Five to 10 min after completion of the resting study, regadenoson was administered and stress 82Rb PET/CT was performed using the same protocol as for the resting study.
Data Processing
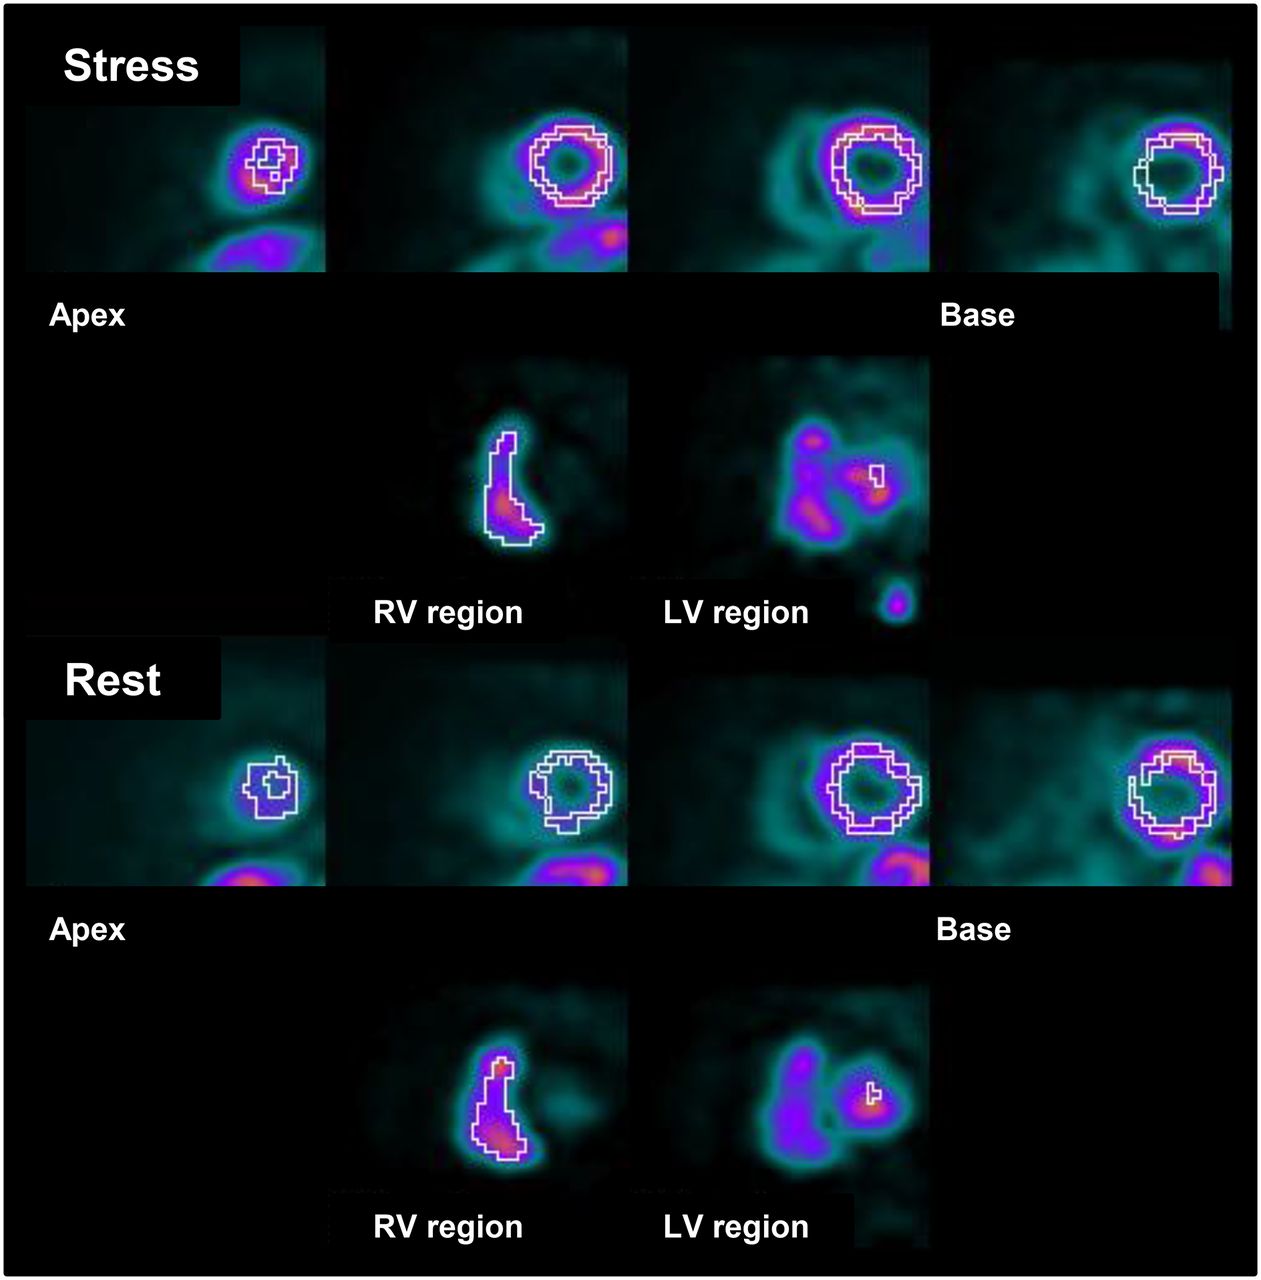
All computations were generated using algorithms developed at Emory University. For analysis of MBF, MFR, and coronary vascular resistance (CVR), the rest and stress first-pass portions of the PET perfusion data were rebinned into 20 frames of 3 s each, 5 frames of 12 s, and 7 frames of 30 s. The algorithms isolated and displayed the rest and stress vertical long-axis and transaxial slices, on which the user marked the approximate LV symmetry axes and selected the slices displaying the largest LV cavity. The initial valve plane was estimated from the basal limits of those approximate symmetry axes. The reoriented mid-LV vertical long-axis images then were displayed with an automatically generated basal valve plane and apical maximum plane, and the mid-LV short-axis sections were displayed with automatically generated epicardial and endocardial borders. For each patient, suggested limits were carefully scrutinized and adjusted by a medical nuclear physicist to conform to the visual impression of the true limits. Using these limits, the algorithms isolated the right ventricular and LV blood pools of the dynamic first-pass data and displayed the pixels used for the formation of the dynamic count data (Fig. 2). For each of the dynamic curves generated separately for each of the 17 segments, factor analysis was used to correct for spillover (18). Using a 2-compartment model for 82Rb kinetics (19), a partial-volume correction, and the Yoshida extraction fraction correction specific to 82Rb (20), rest and stress MBFs for each of the 17 myocardial segments were calculated and displayed (Fig. 3).

Segmentation and chamber identification. LV myocardial segments are identified (top row), as well as right ventricular (RV) and LV blood pools (bottom row).

Polar map display of MFRs. Values of segments 2 and 3 are markedly reduced compared with values of all other segments.
Following accepted conventions, rest MBFs were corrected for each patient’s rate–pressure product but stress MBFs were not (21). Segmental MFR was computed as the ratio of stress-MBF to rest-MBF for each of the 17 myocardial segments. Resting MBF corrected for rate–pressure product was computed (21,22) as follows: Eq. 1
Eq. 1
Global rest MBF, stress MBF, and MFR were computed as the means of the 17 regional values and as the means of segments 4–17; MBF also was computed only for basal segments 1–3 (Fig. 1). MFR was computed (22) as follows: Eq. 2
Eq. 2
CVRs at rest and during stress were computed by dividing the mean arterial pressure by mean MBFs as follows (23): Eq. 3
Eq. 3
Inhomogeneity of perfusion, associated with MBF imbalance due to coronary artery disease, was quantified as the percentage ratio of SD (%SD) to mean values for MBF and MFR, both for all 17 segments and for only segments 4–17 (Fig. 4).
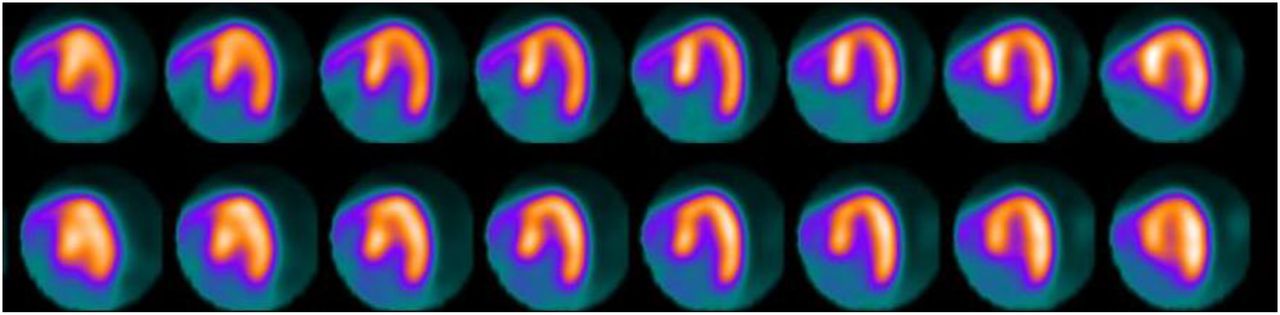
Stress (top) and rest (bottom) horizontal long-axis sections from septum (left) to lateral wall (right) for patient with essentially normal perfusion, all summed perfusion scores equal to 0, and normal function (ejection fraction, 70%). Respective flow inhomogeneities (ratio of SD to mean) were 15%, 23%, and 15% for rest MBF, stress MBF, and MFR when only segments 4–17 were included but increased to 31%, 34%, and 22% when all 17 segments were included.
The equilibrium perfusion myocardial portions of the data were rebinned as gated tomograms at 8 frames per R-R interval, from which rest and stress LV ejection fractions and volumes were calculated (24). The same LV valve plane, epicardial limits, and endocardial limits as determined during MBF analysis were also applied to the equilibrium myocardial perfusion short-axis, vertical long-axis, and horizontal long-axis images for computing LV volumes and ejection fractions and for the formation of the perfusion polar maps (Fig. 5). Sex-specific 82Rb reference limits for relative perfusion were applied to compute summed stress score and summed rest score (25).
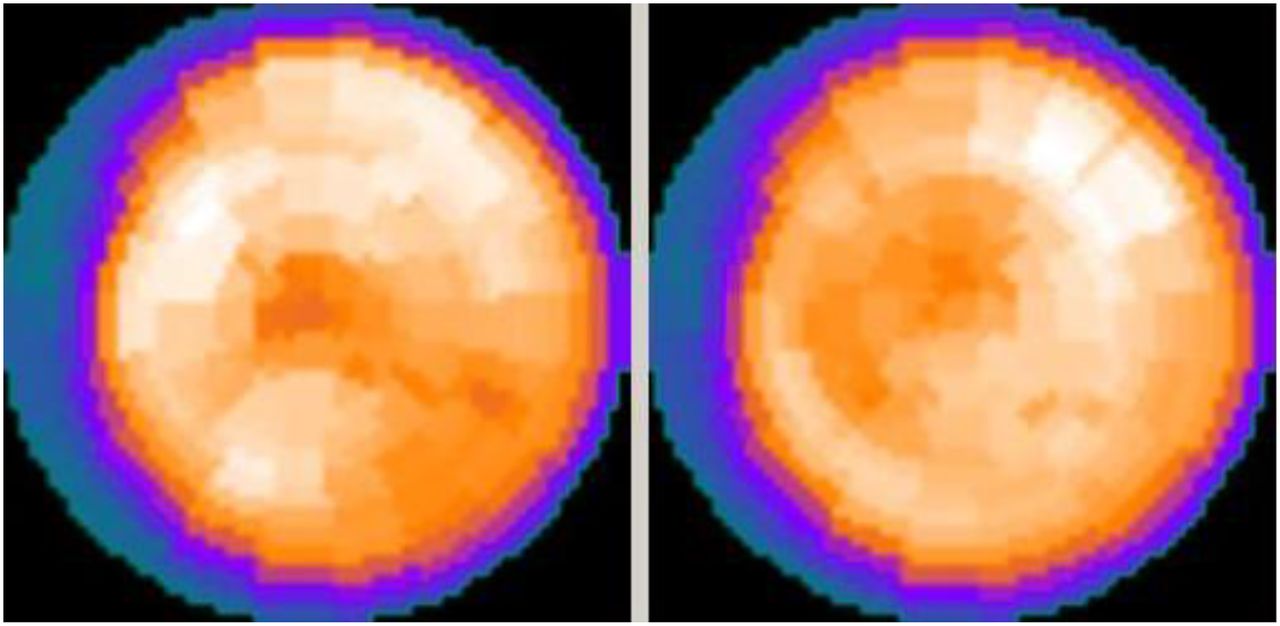
82Rb polar perfusion maps for stress (left) and rest (right) for the patient of Figure 4 display markedly reduced perfusion in basal–septal territories.
Statistical Analysis
Statistical analyses were performed using commercially available software (MedCalc, version 7.5.0.0.; MedCalc Software, Inc.). Values are reported as mean ± SD. Continuous variables were tested by the Kolmogorov–Smirnov test to determine whether they were normally distributed. The paired or unpaired t test, as appropriate, was used to compare values between groups for continuous variables that were normally distributed; otherwise, the Wilcoxon test was used. Frequencies and percentages were used to characterize categoric variables. χ2 analysis of proportions was used to compare ratios between subgroups. Linear regression was used to test for correlations between continuous variables, and Bland–Altman analysis was used to quantify trends and bias between continuous variables.
For all tests, a p value of less than 0.05 was defined as statistically significant.
RESULTS
Patient Characteristics
There were 196 patients for whom data were evaluated (69 ± 13 y, 81 female and 115 male patients). Fifty-three percent of the patients had known coronary artery disease, 37% had angina, 28% had a history of myocardial infarction, and 18% had congestive heart failure. Mean LV ejection fraction was 56% ± 16% at rest and 59% ± 17% during stress. Relative myocardial perfusion scores were 5 ± 7 at rest and 10 ± 10 at stress, with a mean summed reversibility score of 5 ± 7.
MBF and CVR
Rest MBF was significantly lower for segments 1–3 than for segments 4–17 (0.49 ± 0421 vs. 0.85 ± 0.54 mL/g/min, P < 0.0001), as was stress MBF (0.86 ± 0.76 vs. 1.67 ± 0.96 mL/g/min, P < 0.0001). Consequently, rest and stress global MBFs were significantly lowered by including basal–septal segments 1–3 (Table 1).
Comparison of MBF Parameters Obtained by Including All 17 LV Segments vs. Only Segments 4–17
Seventeen-segment values correlated strongly with 14-segment values for both rest and stress MBF (r = 0.99, P < 0.0001). However, linear regression slopes of 0.93 ± 0.01 for both rest and stress MBF were significantly different from 1.0 (P < 0.0001). Bland–Altman plots of differences versus means exhibited a nonzero intercept of −0.04 ± 0.01 (P = 0.0004) and significant correlation (r = −0.64, P < 0.0001), with slopes significantly different from 0.0 (−7.2% ± 0.6% and −8.3% ± 0.7% for rest and stress MBF; P < 0.0001) (Fig. 6). Thus, 17-segment MBFs were consistently 7%–8% lower than 14-segment MBFs throughout the entire range of MBFs. The mean difference between 14- and 17-segment stress MBFs was 0.14 ± 0.10 mL/g/min, with a maximum percentage difference of 16.3% (Table 2).
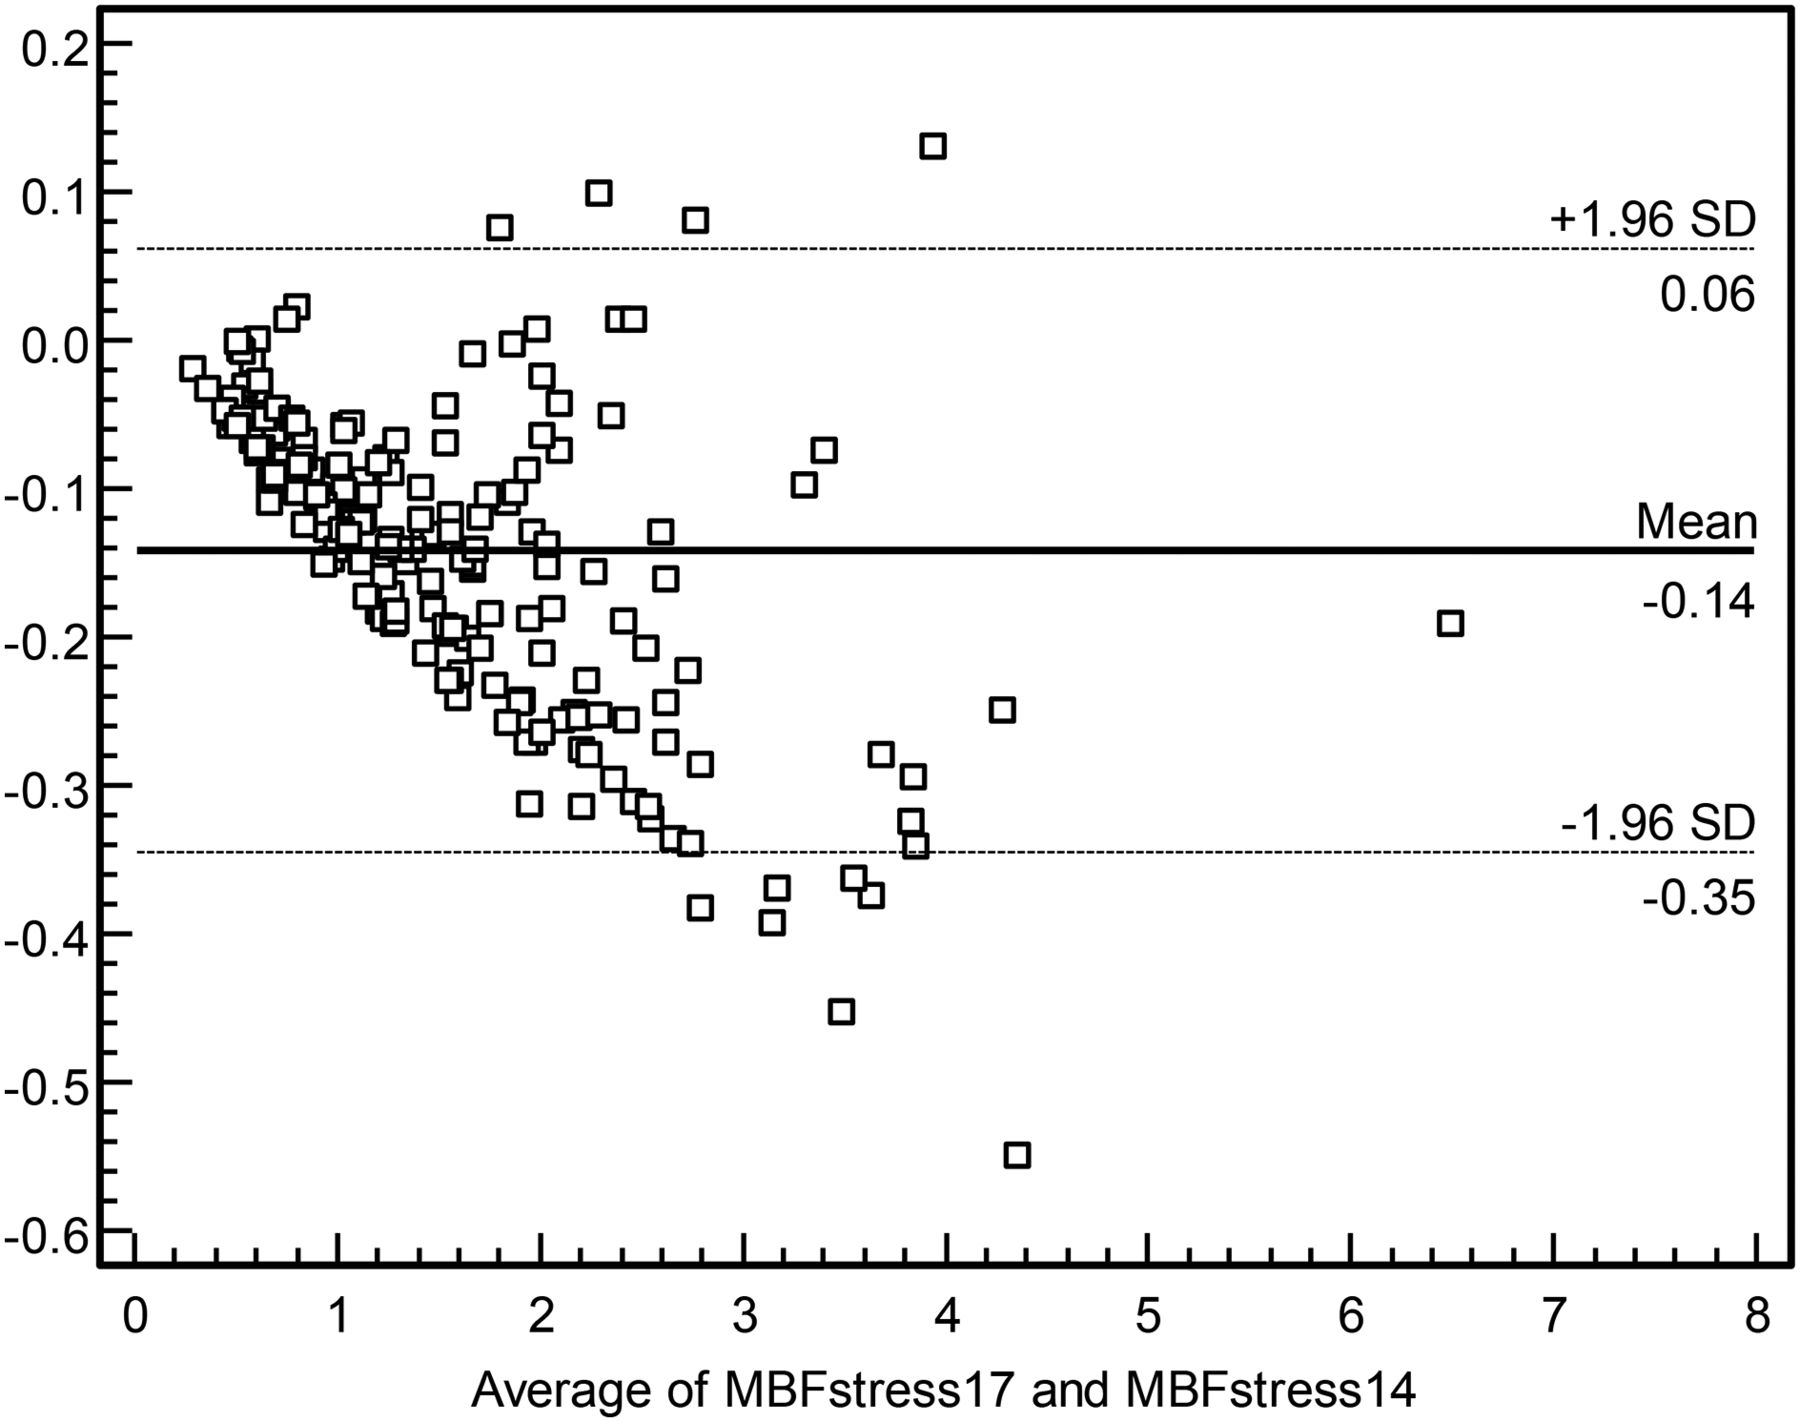
Bland–Altman plot of differences vs. mean values for 17-segment stress MBF (MBFstress17) and 14-segment stress MBF (MBFstress14), in units of mL/g/min.
Differences and Percentage Differences Between 14- and 17-Segment Mean Values
Seventeen-segment CVRs were higher (P < 0.0001) than 14-segment CVRs for rest and stress (Table 1), with a maximum percentage difference of 18.8% for stress CVR (Table 2).
Myocardial Perfusion Inhomogeneity
Perfusion inhomogeneity was greater for both rest (39% ± 10% vs. 31% ± 10%, P < 0.0001) and stress (42% ± 12% vs. 32% ± 11%, P < 0.0001) when basal–septal segments were included. Perfusion inhomogeneity correlated significantly (P < 0.0001) with summed stress score and summed rest score, but these correlations were significantly stronger for 14- than 17-segment values for rest MBF (r = 0.67 vs. r = 0.52, P = 0.02) and for stress MBF (r = 0.69 vs. r = 0.47, P = 0.001).
To be certain that the sources of perfusion inhomogeneity were the basal–septal segments rather than other basal segments, we also analyzed inhomogeneity in basal–lateral regions. For patients without relative myocardial perfusion defects (summed stress score and summed rest score < 4, n = 77), computed MBF inhomogeneity was the same for basal–lateral LV segments (4–6 of Fig. 1) and nonbasal segments (7–17 of Fig. 1) at rest (20% ± 14% vs. 22% ± 7%, paired t test P = 0.28) and at stress (23% ± 16% vs. 24% ± 7%, paired t test P = 0.76).
MFR
Although mean MFR appeared similar for 17- and 14-segment calculations, with a mean percentage difference of only 1.1% ± 3.1%, maximum percentage difference was 15.0% (Table 2), and the paired t test indicated that differences were statistically significant (2.11 ± 1.00 vs. 2.16 ± 1.00, P = 0.0002) (Table 1). Seventeen-segment MFR correlated strongly with 14-segment MFR (r = 0.99), but Bland–Altman plots of differences versus means indicated a significant correlation (r = 0.15, P = 0.03), with a statistically significant intercept (−0.04 ± 0.01, P = 0.0004) and a significant slope (0.011 ± 0.005, P = 0.03).
The median value of 14-segment MFR was 1.95. Several publications have found that 82Rb PET MFR corrected for rate–pressure product is close to 2.00 in healthy control subjects (26,27). Examination of patients below and above the median MFR of 1.95 indicated essentially the same results regarding differences in myocardial perfusion measurements (Table 3), so that the trends we observed were similar both for patients likely to have significant cardiac disease and for those likely to be relatively free of cardiac disease.
Comparison of MBF Parameters for Patients Divided into Groups for Whom 14-Segment MFR Was Below or Above Median
DISCUSSION
For over 2 decades, absolute MBF and MFR have been important parameters derived by applying algorithms to dynamic PET data (1–5). MBF and MFR derived from PET correlate well with values obtained from radiolabeled microspheres (28). Flow values estimated from radionuclides, such as 13NH3, the uptake of which plateaus at a higher absolute MBF, can be corrected using modeled extraction fractions to correlate with 15O-H2O, the uptake of which is nearly linear with flow (6). The computation of MBF and MFR, which was once the domain of research laboratories, is now readily available through the use of generator-produced 82Rb, which does not require an on-site cyclotron, and commercially available MBF algorithms from numerous vendors. MBF determinations obtained using these methodologies have been clinically successful in defining cardiac prognosis in large populations (4), distinguishing single-vessel from multivessel coronary artery disease (29), diagnosing patients with qualitatively normal scans who have balanced 3-vessel disease (30), and identifying patients with angina and normal coronaries who have impaired MFR, or syndrome X (31). 82Rb PET has also been used to quantify LV asynchrony (32) and to explore relationships between LV asynchrony and abnormally reduced MBF (33).
As experience has grown using these flow algorithms, it has been recognized that each one differs in important respects, including acquisition parameters, use of factor analysis, rather than manually drawn regions of interest in the left atrial blood pool to compute impulse function, mathematic models for extraction fraction, and the modeling of tracer kinetics (1 vs. 2 compartments) (14). These variations can lead to significant differences in rest and stress flow, even in healthy subjects; moreover, MBF is also dependent on age and sex and on the myocardial region being analyzed (10), as well as on the stress agent used (34). This has led to the opinion that a reference range for MBF and MFR cannot be established for the cardiology population as a whole. Reporting of MBF and MFR results should be framed in the context of the algorithms and protocols being used (11).
In our study, we quantified another factor that may cause the values obtained for global MBF and MFR to vary: the inclusion of MBFs from the basal–septal segments in computing global flow. In an early study, Gould et al. had excluded basal–septal segments in MBF determinations because of concerns about potential inaccuracy (15). In more recent investigations, basal segments were excluded because of low counts (8). However, the magnitudes of these errors and variations have not previously been evaluated. We studied a heterogeneous group of patients referred for evaluation of known or suspected coronary disease rather than a healthy population. This choice would tend to maximize perfusion inhomogeneity, as well as the difference between flow in the basal–septal segments and the remainder of the myocardium. The salient findings from our investigation indicate that rest and stress MBF in American Heart Association/American College of Cardiology standard segments 1–3 are significantly lower than for the other 14 segments, such that their inclusion lowers MBF determinations by an average of 7%–8%. This holds true both for patients with normal MFR (>2.0) and for patients with abnormal MFR (<2.0). Inhomogeneity of segmental MBF is reduced significantly by excluding basal–septal segments from global flow determinations. The mechanism for this effect is unknown but possibly relates to the count-poor LV outflow tract overlying those segments or to inadvertent sampling of the membranous interventricular septum when those segments are included. Because MFR is an expression of the ratio of stress flow to rest flow, diminution in flow is partially cancelled out, so that MFR with and without inclusion of the basal–septal segments differs to a lesser extent than MBF. Thus, MFR may be a more reasonable parameter to use than absolute stress MBF when detecting the presence of coronary stenoses or determining the response to vasodilators.
The primary objective in acquiring 82Rb PET data is to analyze the pattern of myocardial perfusion for defects indicative of coronary stenoses. Myocardial scintigrams are presented for visual evaluation, polar maps of relative perfusion are generated, and reference limits are applied for computation of summed rest score and summed stress score (25). This process requires discriminating between valid and spurious count data. For most current polar map algorithms, the LV limits in the short-axis plane are defined symmetrically with circular regions of interest. To fully encompass the lateral wall segments, a portion of the basal–septal region, even if count-poor, may be included. In addition, positioning the LV limit too far beyond the LV base can produce artifactual myocardial defects (35). Misplacement of base or apex locations also affects computed LV volumes and ejection fractions, whereas consistency in the placement of LV basal limits on rest-versus-stress 82Rb PET studies can be validated by confirming that computed LV mass is constant in both physiologic states and thus can serve as a reasonable quality assurance check (36). Commercial algorithms now routinely exclude basal territories in forming summed stress score and summed rest score relative myocardial perfusion indices, but this process has not necessarily been routinely adopted in ascertaining global values of MBF from dynamic PET data.
CONCLUSION
Basal–septal segments may have decreased values and increased variability for MBF, compared with other myocardial regions. Algorithms for MBF should be developed that allow exclusion of the basal–septal segments when count data appear inadequate or compromised. This would promote more accurate and consistent determinations of MBF and coronary flow reserve.
DISCLOSURE
Andrew Van Tosh serves as a consultant to Astellas Pharmaceuticals, Inc. Kenneth Nichols receives royalties from Syntermed, Inc., in relation to cardiac software used in this investigation. No other potential conflict of interest relevant to this article was reported.
Footnotes
Published online Mar. 10, 2016.
REFERENCES
- Received for publication January 22, 2016.
- Accepted for publication February 8, 2016.


Jump to section
Related Articles
Cited By...
- No citing articles found.