


Abstract
A fully automated objective striatal analysis (OSA) program that quantitates dopamine transporter uptake in subjects with suspected Parkinson’s disease was applied to images from clinical 123I-ioflupane studies. The striatal binding ratios or alternatively the specific binding ratio (SBR) of the lowest putamen uptake was computed, and receiver-operating-characteristic (ROC) analysis was applied to 94 subjects to determine the best discriminator using this quantitative method. Methods: Ninety-four 123I-ioflupane SPECT scans were analyzed from patients referred to our clinical imaging department and were reconstructed using the manufacturer-supplied reconstruction and filtering parameters for the radiotracer. Three trained readers conducted independent visual interpretations and reported each case as either normal or showing dopaminergic deficit (abnormal). The same images were analyzed using the OSA software, which locates the striatal and occipital structures and places regions of interest on the caudate and putamen. Additionally, the OSA places a region of interest on the occipital region that is used to calculate the background-subtracted SBR. The lower SBR of the 2 putamen regions was taken as the quantitative report. The 33 normal (bilateral comma-shaped striata) and 61 abnormal (unilateral or bilateral dopaminergic deficit) studies were analyzed to generate ROC curves. Results: Twenty-nine of the scans were interpreted as normal and 59 as abnormal by all 3 readers. For 12 scans, the 3 readers did not unanimously agree in their interpretations (discordant). The ROC analysis, which used the visual-majority-consensus interpretation from the readers as the gold standard, yielded an area under the curve of 0.958 when using 1.08 as the threshold SBR for the lowest putamen. The sensitivity and specificity of the automated quantitative analysis were 95% and 89%, respectively. Conclusion: The OSA program delivers SBR quantitative values that have a high sensitivity and specificity, compared with visual interpretations by trained nuclear medicine readers. Such a program could be a helpful aid for readers not yet experienced with 123I-ioflupane SPECT images and if further adapted and validated may be useful to assess disease progression during pharmaceutical testing of therapies.
Parkinson’s disease (PD) is the prototypical neurodegenerative disease involving degeneration of nigrostriatal dopaminergic neurons, and its study has led to specific therapeutic interventions using dopamine-replacement therapies. Radiotracer SPECT imaging has played an important role in understanding the underlying mechanism of PD and potential therapy efficacies (1–8). Neuronal cell death in PD is an active, ongoing process. More objective assessment of disease progression in individuals with PD is becoming increasingly important as neuroprotective and neurorestorative strategies for PD are developed and tested.
Difficulties in clinically evaluating disease progression in PD patients are multifactorial. The progression of PD is slow and highly variable between patients, requiring clinical trials designed to last 2–3 y to effectively power the study for showing the effect of treatments designed to slow the course of progression. Also, PD patients invariably require symptomatic treatment over the duration of the trial, confounding the clinical assessment of the native disease process. Finally, assessment of washout of medications from PD patients is difficult, with few data to guide investigators as to the adequate duration of washout periods for common PD symptom treatments.
Neuroimaging markers of presynaptic dopaminergic function have been reported to offer an objective biomarker of PD status. In clinical studies of patients with progressing PD, several presynaptic dopamine radioligands have demonstrated reductions in the imaging signal in the range of 4%–11% per annum in serial imaging of patients over 1–4 y (9).
After years of research studies and clinical imaging in Europe (10–16), 123I-ioflupane (123I-FP-CIT) recently received approval from the Food and Drug Administration in the United States for the assessment of presynaptic dopaminergic deficits in the brains of adult patients with suspected parkinsonian syndromes. This approval has refocused the use of 123I-ioflupane for the diagnosis of PD and as an aid to differentiate PD from other disorders such as essential tremor and psychogenic or drug-induced parkinsonism.
Although web-based training sites are available to aid centers in starting to acquire and read 123I-ioflupane SPECT scans, less experienced readers may improve their accuracy or increase their level of confidence with the aid of automated quantitative evaluation of striatal uptake. Quantitative methods for evaluating the dopaminergic deficit in SPECT scans have been developed (17–23) and offer an independent second read of the image data. Use of such software tools may also speed training by providing immediate feedback. We describe the performance of an automated quantitative analysis program whose quantitative specific binding ratios (SBRs) were used to demonstrate an area under the curve (AUC) of 0.958 when statistically analyzed versus the independent-majority visual interpretations of 3 experienced readers, to validate the software analysis tool as a potential aid to interpreting the SPECT 123I-ioflupane images of our clinically referred patients.
MATERIALS AND METHODS
Subject Population
One hundred one subjects were referred for nuclear medicine imaging at the University of Arizona Medical Center. Subjects were referred by neurologists specializing in the evaluation of movement disorders. The patients’ ages ranged from the 39 to 85 y. Thirty-six women and 65 men were imaged (ratio of men to women, 1.8:1).
Clinical Protocol
Before injection, the patients were premedicated with Lugol solution to block uptake of radioiodine by the thyroid gland. Four hours after injection of approximately 185 MBq of 123I-ioflupane, projection data were obtained in a 128 × 128 matrix on a 2-head camera (ECAM; Siemens Medical Systems) mounted with low-energy high-resolution parallel-hole collimators. Projection data were acquired over 120 angles for 30 min. The standard brain protocol was used, whereby the data were reconstructed using filtered backprojection and applying a zoom of 2. A standard Butterworth filter (order, 6; cutoff, 0.35 cycles per pixel) was used. As per the manufacturer’s guideline, no attenuation or scatter correction was applied.
Visual Reads Conducted on Clinical Scans
The images were transferred to a workstation and interpreted by 3 trained readers already experienced with 123I-ioflupane images. Scans were read as normal if the striata demonstrated the classic symmetric comma shapes. Scans were read as abnormal if there was unilateral or bilateral loss of the comma appearance or a strong asymmetry was noted between the left and right striata, particularly in the putamen. Each of the 3 readers examined each scan independently, with no consultation with the other readers. No additional clinical information was made available to the readers before they were presented with the scan images.
OSA Automated Image Processing Steps
The OSA software program was originally developed to quantitate dopaminergic deficits in humans using 123I-β-CIT, and 101 subjects were analyzed using this automated analysis in that previous validation (23). The comparison to manual analyses performed interactively by trained nuclear medicine image analysis personnel produced a scatterplot relationship between the 2 methods, with an R value of 0.966. Because the quantitative analyses of both 123I-β-CIT and 123I-ioflupane are identical in their placement of regions of interest (ROIs) and SBR calculations, the application of the already-validated OSA analysis was directly adaptable to 123I-ioflupane SPECT scans. The only change in the program’s internals was to replace the 123I-β-CIT–specific template for reorienting each subject’s scan to a standard geometry by a similar template obtained from a library of 123I-ioflupane scans. None of the ROI placement algorithms were changed in any way. The scripts were developed under MATLAB (24) version 2010a and result in a Windows-executable program (Microsoft), running under the XP operating system, that carries out the following image-processing steps.
The patient’s SPECT scan is reoriented through adoption of an average-scan template, which represents an averaged, spatially normalized brain volume for 26 selected subjects who were selected from the online shared database of the Parkinson’s Progression Marker Initiative. This average scan was reoriented along the canthomeatal line, which lies parallel to the horizontal planes within the imaging matrix. Each subject’s scan was automatically registered to this average scan using the automated image registration algorithm with a nonelastic fit (25).
The central plane through the subject’s striatum is found by locating the maximum value in the top-to-bottom profile in the summed sagittal view of the reconstructed images. The 4 slices above and below this central slice are added to obtain a summed 2-dimensional slice for subsequent analysis.
Determination of maxima in the sagittal and coronal profiles allows the intensity centroids of the left and right striata in the summed 2-dimensional slice to be located.
The head size, from striata to edge of the occipital lobes, is measured in order to scale the size of the occipital ROI and to adjust the distance from the caudate ROI to the putamen ROI.
The occipital ROI is placed at a constant distance from the posterior edge of the occipital lobes (Fig. 1). The larger caudate ROI is moved freely in the vicinity of each striatum until it yields a maximum count value; the smaller caudate ROI is placed in its center and is used for the caudate’s count density measurement (Fig. 1). Maintaining the same scaled distance to the caudate, the putamen ROI orbits posteriorly around the caudate until a maximum value is found for extracting the putamen count density.
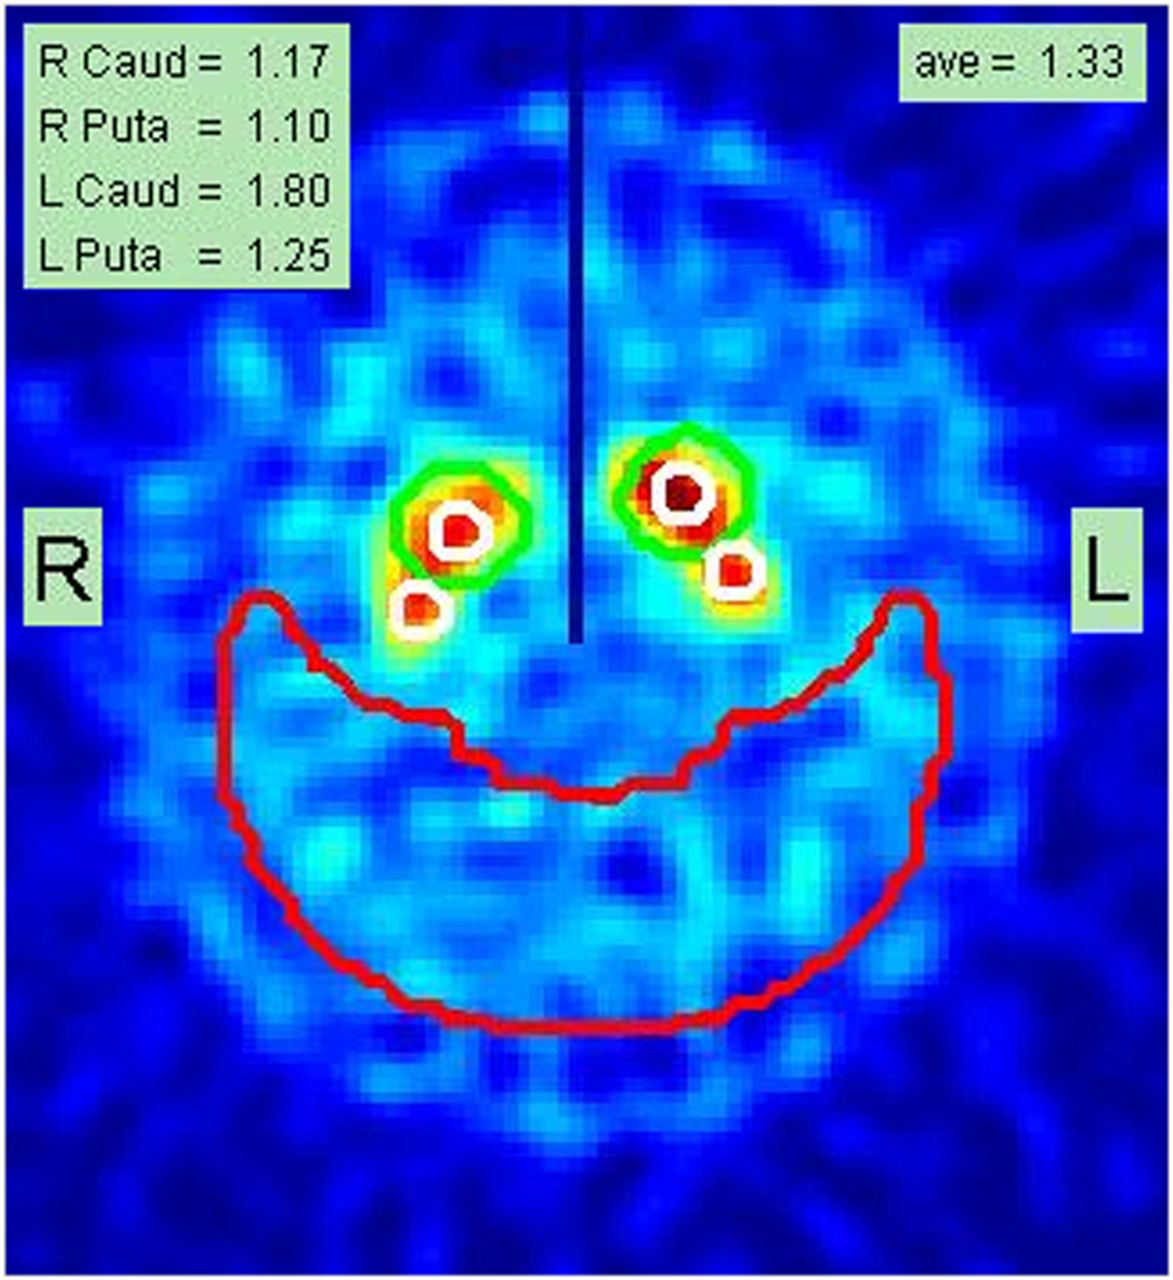
Example of final report page from analysis of subject A, documenting SBRs for right caudate (Caud) and putamen (Puta) as well as for left caudate and putamen (1.17, 1.10, 1.80, and 1.25, respectively). Average (ave) of these 4 values is shown as 1.33 in top right corner. Placement of caudate and putamen small white ROIs is shown superimposed on summed slices containing stratum. Large red crescent ROI is used to determine nonspecific background count density. Central vertical dark line drawn in upper half of image is used as check to ensure that left and right striata were correctly localized during automated processing.
Binding ratios for the individual left and right caudate nuclei and left and right putamina are calculated.
SBR in the scan is calculated as the ratio of a selected striatal structure’s background-subtracted count density to the count density in the occipital lobe:
The lowest putamen is used as the most sensitive metric for the scan. A final report is generated with all quantitative values written into the image containing the ROI placements (Fig. 1). An average striatal SBR is calculated and written into the final image report.
The OSA program runs completely automatically, with no user input other than selection of the data file to be analyzed. The reorientation of the brain volume, selection of slices containing the striata, and placement of the ROIs on the caudate and putamina as well as the background region are all accomplished by algorithms that analyze the image profiles and intensities as described in the original publication (23). Once the SPECT dataset is selected, all the processing is completed, and the final analysis report (Fig. 1) is generated within 40 s. When the same original reconstructed dataset is reanalyzed by various operators, the error in the reproducibility of the reported SBR values is zero.
ROC Analysis
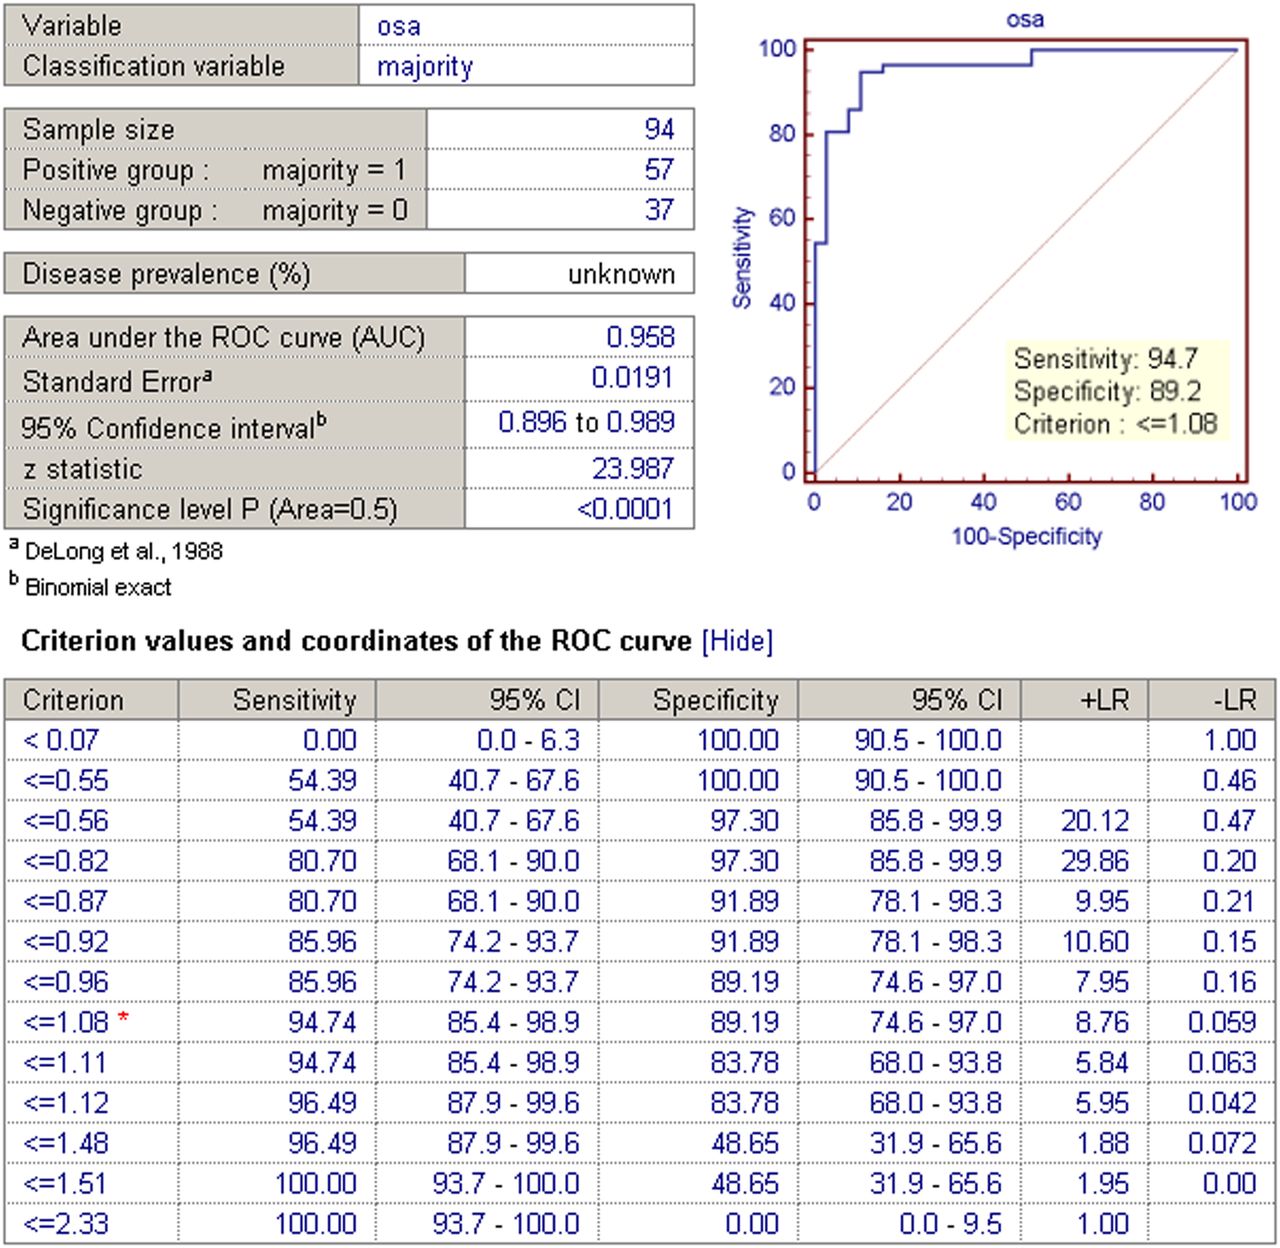
The ROCs are based on the classification obtained from the 3 readers who evaluated each brain scan as either abnormal or normal (using the methods described in the “Visual Reads Conducted on Clinical Scans” section). That is, when 2 of 3 readers called the image findings abnormal, that scan was classified as a 1; similarly, when the majority called the findings normal, that scan was classified as a 0. These clinical classifications were then compared with the lowest putamen value for each subject as calculated by OSA (taken to be the variable) to generate the AUC using the DeLong methodology implemented with the MedCal medical analysis package. The resulting AUC curve and associated ROC table is shown in Figure 2.

Summary report showing statistics from ROC analysis of 94 patients using lowest putamen SBR calculated by OSA as variable, compared with classification from majority consensus of 3 expert readers. Table at bottom shows sensitivity and specificity for each cutoff criterion with their associated 95% confidence intervals (CI) and likelihood ratios (LR).
RESULTS
Twenty-nine of the scans were interpreted as normal and 59 as abnormal by all 3 readers, demonstrating an overall agreement rate of 88%. For 12 scans (12%), the 3 readers did not unanimously agree in their interpretations (discordant). For the purpose of this analysis, we did not pursue a consensus reading; we wished to maintain 3 independent reads whereby no reader is ultimately influenced by the interpretations and values of the other readers in this study. This procedure ensures that each reader is indeed independent and carries the same weight in interpreting the scans.
Seven of the 101 scans could not be properly analyzed by OSA because of a lack of visualization of the striata or patient motion. Six of those 7 had such severe loss of uptake in the striata that OSA could not properly detect a maximum. As expected, all 3 readers unanimously agreed that these 6 cases were so markedly abnormal, with lack of visualization of the striata, that a reader would never need assistance determining the findings to be abnormal. One scan was so severely degraded by patient motion that the readers agreed it was not interpretable and should be repeated. The remaining 94 scans were analyzed with OSA.
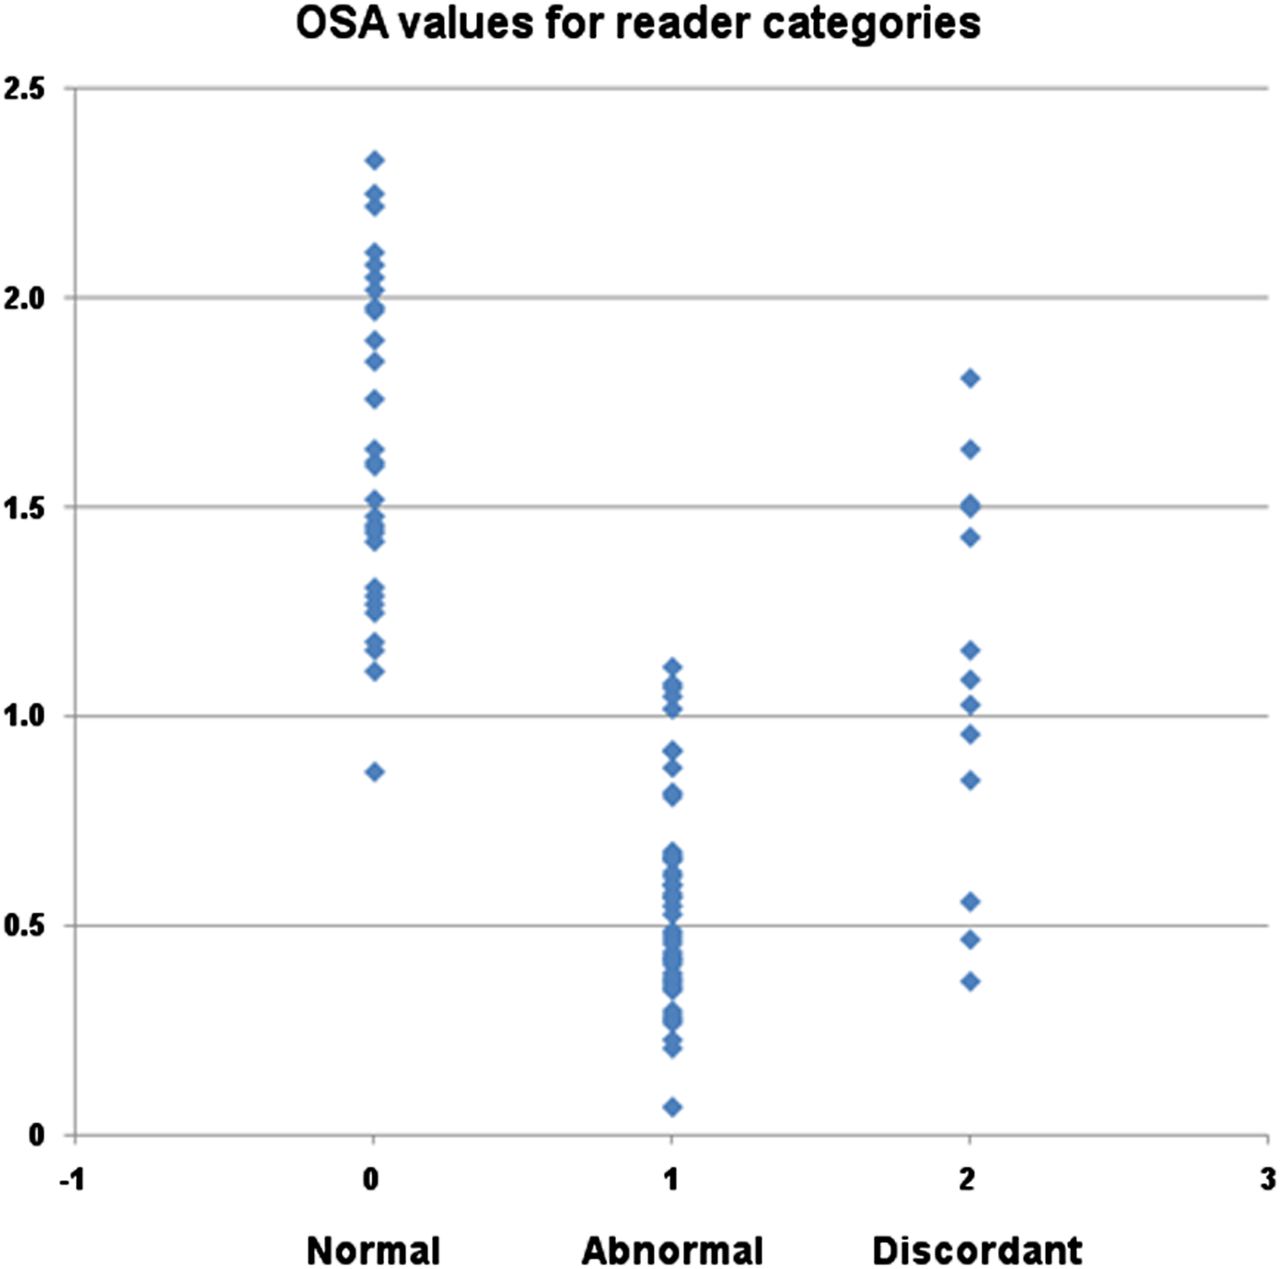
The ranges of SBRs for the unanimously normal, unanimously abnormal, and discordant categories of reader interpretation were 0.87–2.33, 0.07–1.12, and 0.37 to 1.81, respectively, with associated means ± SDs of 1.64 ± 0.39, 0.55 ± 0.25, and 1.11 ± 0.42, as shown in Figure 3.

Scatterplot showing OSA values for 3 categories of visual read interpretations: normal indicates unanimous consensus of normal scan (n = 29), abnormal indicates unanimous consensus of dopaminergic deficit (n = 59), and discordant indicates no unanimous consensus (n = 13).
A κ-analysis was performed on the interpretations of the 3 readers to assess levels of reader agreement. κ for readers 1 and 2 was 0.72 (95% confidence interval, 0.857–0.582; z = 6.55; P < 0.001); for readers 1 and 3 it was 0.85 (95% confidence interval, 0.967–0.732; z = 7.73; P < 0.001); and for readers 2 and 3 it was 0.87 (95% confidence interval, 0.968–0.576; z = 7.11; P < 0.001). Overall reader agreement was significantly higher than chance and was substantially high given the noise and resolution characteristics associated with these scans.
The ROC analysis, which used the visual-majority-consensus interpretation from the readers as the gold standard, yielded an AUC of 0.958 with the use of 1.08 as the threshold SBR for the lowest putamen (Fig. 2). The sensitivity and specificity of the automated quantitative analysis were 95% and 89%, respectively, at that threshold. The ROC analysis program selected this optimal threshold to correspond to the point on the ROC curve with the simultaneously highest sensitivity and specificity. Typically, this optimized threshold yields the best results for clinical applications as an overread analysis.
To achieve 100% sensitivity, a striatal binding ratio of less than 1.51 could be used but at the expense of lowering the specificity to 49%. To achieve 100% specificity, an SBR of less than 0.55 could be selected but at the expense of lowering the sensitivity to 54%. These cutoffs can be helpful for stratification of diagnosis probabilities.
DISCUSSION
OSA may be helpful as a second overread, especially for imaging centers initiating 123I-ioflupane imaging or not receiving a large volume of referrals. Novice and experienced readers may also increase the confidence in their interpretations by use of such a program. The role of the OSA is not to replace the visual read but rather to aid the visual read. Widely accepted comparisons in clinical practice include computer-aided detection for mammography and breast MR imaging and quantitative analysis software in nuclear cardiology.
The human-reader assessment indicated that even though we used 3 experienced readers with fairly high agreement rates (κ = 0.72–0.87), these readers still disagreed in 12% of the cases. We did not include any less experienced readers in this study, but because those with less experience typically perform at lower levels than experts, one would predict even greater variability in interpretation. The OSA was shown to have an AUC of 0.958 (when using the majority-consensus score from the 3 readers as the gold standard) and thus has significant potential to serve as an aid to 123I-ioflupane interpretation, even for expert readers who do not agree on every case (i.e., reduce variability between readers and possibly increase the consistency of a single reader across cases).
In our experience, when the result of imaging with 123I-ioflupane runs contrary to clinical expectation, a neurologist may inquire about the diagnostic certainty of an individual scan. The OSA can help to objectively stratify the degree of certainty. A familiar analogy may be drawn with ventilation–perfusion imaging to assess the probability of pulmonary embolism. For example, if a patient has an SBR of less than 0.55, correlating to a 100% specificity, the patient has a high probability of PD even if clinical suspicion is low or intermediate. Conversely, if the patient has an SBR of greater than 1.5, the patient has a low probability of PD even if clinical suspicion is intermediate or high. The OSA also provides an objective evaluation of what would be a borderline case, for example, a lowest putamen SBR of approximately 1.0. These difficult cases may therefore be more appropriately triaged for further clinical evaluation or follow-up 123I-ioflupane imaging. Helping clinicians quantify the intermediate diagnosis probabilities with 123I-ioflupane imaging may improve its utility as an aid in diagnosis rather than the binary interpretation of abnormal or normal. Follow-up imaging in 1–2 y may therefore be considered appropriate when the SBR falls into the intermediate range and the clinical probability is also intermediate.
Because 123I-ioflupane has been widely available in the United States for only 1 y at the time of this research, we could not yet evaluate the ability of OSA to evaluate changes in patients’ SBR 123I-ioflupane measurements over time. The primary objective of this study was to optimize OSA to provide a second overread similar to what a panel of experienced readers would provide. In order for OSA to be used at a variety of imaging sites with a range of camera manufacturers, this automated analysis needs to be implemented and calibrated at other brain imaging centers. As 123I-ioflupane becomes more widely used, it is our intent to perform these comparisons as more data (and additional imaging sites conducting these scans) become available. The objective was not to test the absolute accuracy of 123I-ioflupane imaging against a clinical gold standard as was done in the clinical trials to obtain regulatory approval. This important distinction must be made. If all 3 readers in this study reached the same but incorrect interpretation of a case, then OSA should likewise provide this same wrong interpretation. Clinically, OSA should be optimized to provide an expert consensus read, even if the result is incorrect compared with the gold standard for a particular case.
Historically, our testing of an automated image-processing software package follows a recent trend in nuclear medicine—that is, the trend toward quantitative, reproducible analysis of image data. Automated clinical image-processing analysis packages for cardiac function first appeared in the 1990s and later (26–29). An automated renal function analysis program has also been reported (30). More recently, automated techniques have been applied to brain images (23,31–34). These developments enhance the clinical power of imaging studies in that they reduce the variability of quantitative results obtained between image processing technologists and image analysis sites. This reduction in variability further helps to reduce the number of subjects that need to be studied for investigating new diagnostic and therapeutic agents and delivers more consistent and reproducible clinical evaluations.
CONCLUSION
A fully automated striatal SBR OSA program has been successfully tested and optimized on 123I-ioflupane SPECT images to aid in the diagnosis of PD or parkinsonian syndromes. Because no operator intervention is required, the reproducibility of reanalyzed data exhibits no operator variability when OSA is used. Applying the OSA analysis to a group of 94 patients imaged with 123I-ioflupane demonstrates that the SBR correlates strongly with visual interpretations by trained readers (AUC = 0.958).
DISCLOSURE
This work was conducted with support from NIH-2R44NS055475 and DOE FG02-08ER85170. Phillip Kuo develops online educational courses for MDTraining@Home. In addition, Phillip Kuo is a consultant for GE Healthcare and has received grant funding from GE Healthcare. Scott Sherman and Hong Lei are participating in research funded by GE Healthcare. George Zubal and John Seibyl are members of Molecular NeuroImaging (MNI) and receive funding from GE Healthcare. No other potential conflict of interest relevant to this article was reported.
Acknowledgments
We thank all the certified nuclear medicine technologists at the University of Arizona.
Footnotes
Published online Feb. 11, 2013.
REFERENCES
- Received for publication October 3, 2012.
- Accepted for publication December 17, 2012.


