


Abstract
Small-animal PET refers to imaging of animals such as rats and mice using dedicated PET scanners. Small-animal PET has been used extensively in modern biomedical research. It provides a quantitative measure of the 3-dimensional distribution of a radiopharmaceutical administered to a live subject noninvasively. In this article, we will discuss the operational and technical aspects of small-animal PET; make some comparisons between small-animal PET and human PET systems; identify the challenges of, opportunities for, and ultimate limitations in applying small-animal PET; and discuss some representative small-animal PET applications. Education objectives: After reading this article, the technologist will be able to explain the requirements and benefits of small-animal PET in biomedical research, describe the design and general characteristics of a small-animal PET system, list and describe some of the challenges of imaging small animals, and discuss several small-animal PET applications.
Small-animal PET refers to imaging of animals such as rats and mice using a small, high-resolution PET scanner designed specifically for this purpose. Compared with a human PET scanner, a small-animal PET scanner is used for subjects that typically are 2 to 3 orders less in weight and volume than a human. The small structures of small animals require a scanner with high spatial resolution, ideally at submillimeter level, to identify the critical organs or target areas. As a reference, the spatial resolution of a state-of-the-art human PET system is in the range of 4–6 mm. The volume resolution of small-animal PET is usually at the microliter level. This is one of several reasons that micro is used as part of the name of one commercial small-animal PET scanner (microPET; Siemens Preclinical Solutions). Because of the small size of the imaging subjects, a small-animal PET system has a detector gantry that is only a fraction the size of one in a human PET scanner. For example, typical small-animal PET systems have a detector ring diameter of approximately 150 mm (6 in), as compared with approximately 800 mm (31 in) for human PET systems. The smaller detector ring is advantageous in that it saves detector cost and also improves the geometric detection efficiency of the system. This is another reason that micro is part of the name of the Siemens system. In fact, it has become a convention that when micro is used as a prefix to an imaging modality, such as micro-CT and micro-MRI, it indicates small-animal imaging.
GENERAL ROLE OF SMALL-ANIMAL PET
The demand for small-animal PET is driven by the importance of animal model–based research. The mouse and the rat host a large number of human diseases. Collection of scientific data from these animal studies is important to medical research. For example, before a new drug is tried on patients, there must be extensive data from animal studies on such things as dose, biodistribution of the drug, route of administration and excretion, effectiveness for a clinical indication, and toxicity. Animal studies such as these provide preclinical data that must be submitted to the Food and Drug Administration as part of an Investigational New Drug Application, the regulatory step needed to move on to human clinical studies. Before the development of small-animal PET, such preclinical data could be obtained only through sacrificing and dissecting the tissues of a large number of animals.
Since its emergence in the mid 1990s, small-animal PET has been used extensively in modern biomedical research (1). It can provide a quantitative measure of the 3-dimensional distribution of the radiopharmaceutical as a function of time in a live subject noninvasively (2–4). Compared with conventional invasive animal study techniques, such as tissue dissection, small-animal PET allows the entire dynamic biodistribution of a labeled compound to be measured in the same subject in a single scan and, additionally, enables a single animal to be studied multiple times over the course of the evaluation. Not only is there an effective reduction in the number and cost of laboratory animals used in experiments, but most importantly, there is the potential to reduce drug development costs by readily providing pharmacokinetic data. The primary advantage of small-animal PET, compared with small-animal CT and MRI, is that it allows us to study physiologic processes and molecular abnormalities that are the basis of disease rather than just image the end effects of cellular and molecular alterations. Imaging of specific molecular targets with small-animal PET enables earlier detection and characterization of disease, earlier and direct molecular assessment of treatment effects, and a more fundamental understanding of disease processes. As such, small-animal PET is, together with clinical PET, a key instrument in the development and implementation of personalized medicine.
The primary use of animal PET is concentrated in academic or government research laboratories (70%–80%), with the remainder being in pharmaceutical and biopharmaceutical companies. On the research laboratory side, the demand for small-animal PET has been driven by the strategic plans of government agencies such as the National Institutes of Health and the Food and Drug Administration, the largest U.S. financier of basic research and the governing U.S. body of all clinical drugs, respectively. For the pharmaceutical industry, a significant benefit of small-animal PET is that it can bridge the gap between preclinical “pharmaceutical” studies in animals and phase I trials in humans. By allowing in vivo pharmacokinetic and pharmacodynamic studies, small-animal PET permits studies of administration, distribution, metabolism, and excretion to be performed much more easily and quickly. Small-animal PET allows faster screening of investigational compounds and earlier decisions about a compound’s suitability, thus potentially accelerating the new drug development cycle at reduced cost. Small-animal PET also provides the opportunity to study disease progression, therapeutic response, and secondary detrimental effects in the same subject.
GENERAL INFORMATION ABOUT SMALL-ANIMAL PET
The first small-animal PET scanners were developed about 20 y ago (5–10). Since then, both the technology and the user base of small-animal PET have experienced phenomenal growth. There are currently a few hundred small-animal PET systems already installed. As an example of user base growth, there were 20 research presentations that used small-animal PET at the Society of Nuclear Medicine annual meeting in 2000 and the number increased to 143 in 2007 (11). On the technology development side, small-animal PET has been an active research topic since its emergence (12,13). This continued endeavor has established the knowledge base for small-animal PET technology. Several small-animal PET systems developed in laboratories have advanced to become commercial products. Figure 1 shows a small-animal PET scanner.
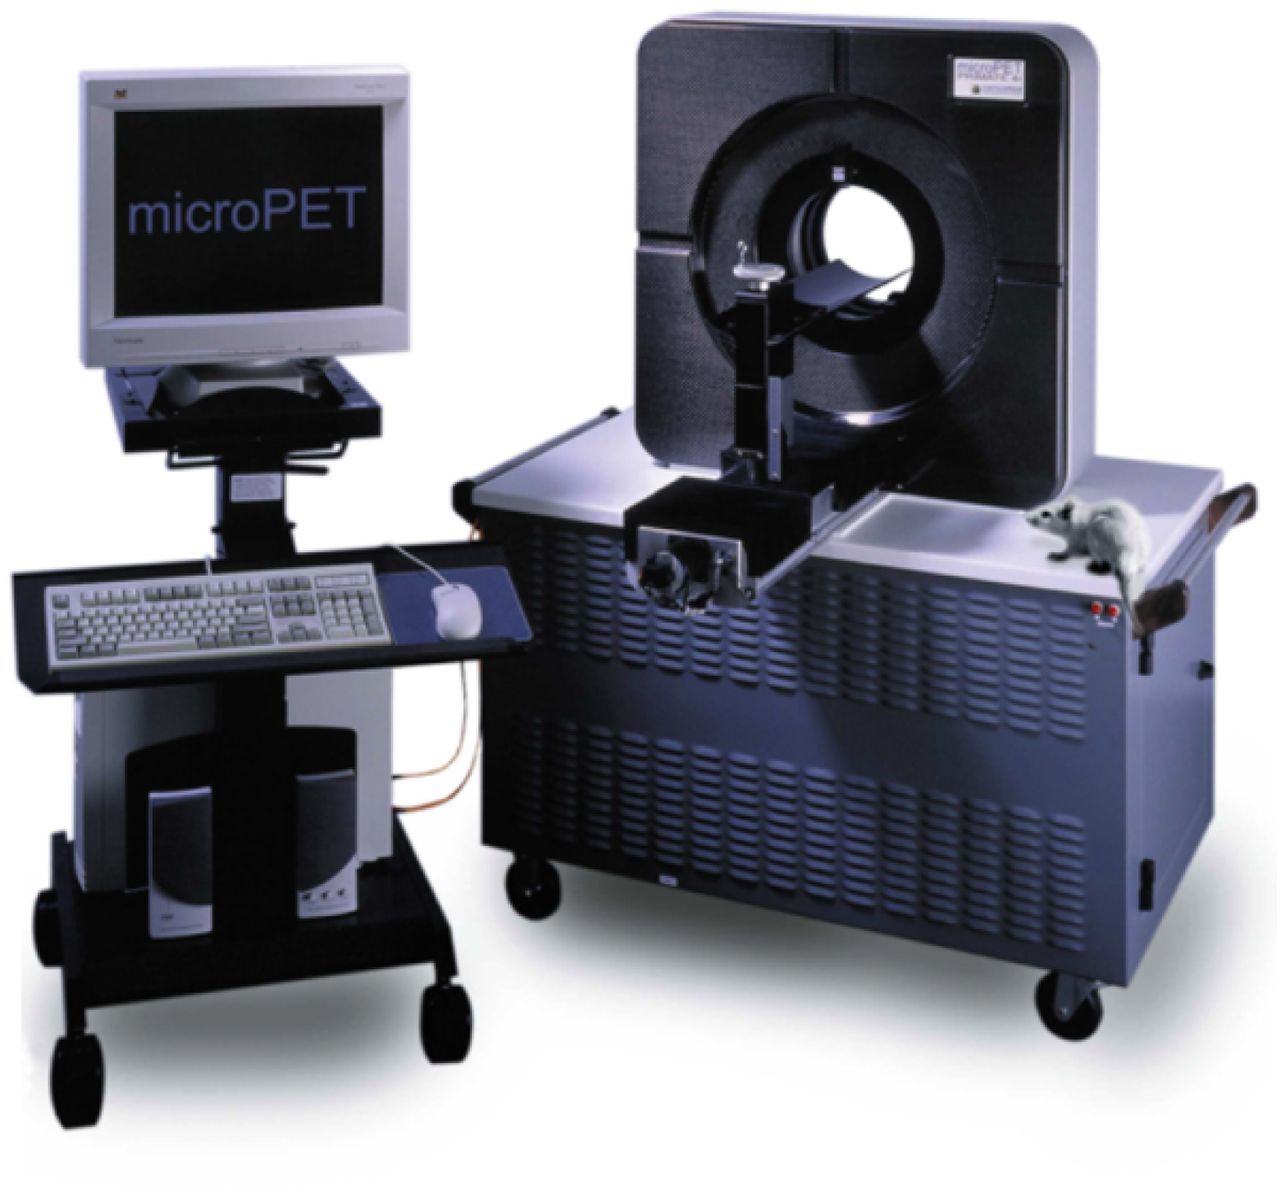
Photograph of microPET Focus 120 scanner (Siemens Preclinical Solutions). (Courtesy of Maurice M. Weaver.)
A list of commercially available small-animal PET systems can be found in Table 1. Only brief system specifications are provided in the table, but a more extensive systematic evaluation of several of these systems can be found in a recent report (14). Like clinical PET scanners, small-animal PET systems implement 3-dimensional data acquisition in list mode (i.e., events recorded individually without charting as histograms) to enable image time framing and provide physiologic gating inputs to correct for cardiac and respiratory motion. All small-animal PET systems use photomultiplier-based detector technologies, except one, the LabPET (Gamma Medica/GE Healthcare), which uses semiconductor avalanche photodiode–based detectors (15). Most systems today are offered in combination with a small-animal CT scanner for coregistration of the anatomic image with the PET data. The price for different small-animal PET systems ranges between $400,000 and $1,200,000, depending on the PET system configuration. Among the commercial small-animal PET manufacturers, Siemens Preclinical Imaging has a greater selection of system models and owns more than 50% of the world’s market share of small-animal PET scanners. The globalization of the economy and science has also triggered the fast proliferation of small-animal PET in emerging development countries and regions such as South Korea, Taiwan, and China.
Commercially Available Small-Animal PET Scanners and Their Key System Specifications
UNIQUE CHARACTERISTICS OF SMALL-ANIMAL PET
Small-animal PET and human PET both use similar image formation techniques and share some common image quality issues. But small-animal PET has some unique characteristics and faces special challenges that stem from the much smaller imaging subject used in studies. The challenges of small-animal systems are discussed below.
Small-Animal Imaging
Rats and mice are not as cooperative as humans. Rodents do not remain still through an imaging session that usually lasts tens of minutes. Anesthesia must be used for most imaging procedures. Anesthesia is preferably performed through masking the animal with a mixture of isoflurane and oxygen gases. Because of their smaller bodies, the physiologic conditions of mice and rats are more susceptible to environmental changes and hypothermia during the imaging process. To warrant the reliability and reproducibility of PET data, especially when physiologic parameters such as blood flow, substrate metabolism, or organ functions are being investigated, a heating source (light bulb, air flow, or pad) must be used to maintain the animal’s body temperature, and vital signs must be monitored to verify the animal’s homeostasis. These measures are also important to ensure that the animal remains in a fully recoverable physical state through several imaging sessions. To ensure consistency during a longitudinal study, certain devices are commonly used to hold the animals in selected positions. Figure 2 shows an imaging chamber used to help restrain the animal while providing anesthesia and oxygen gas during image acquisition.
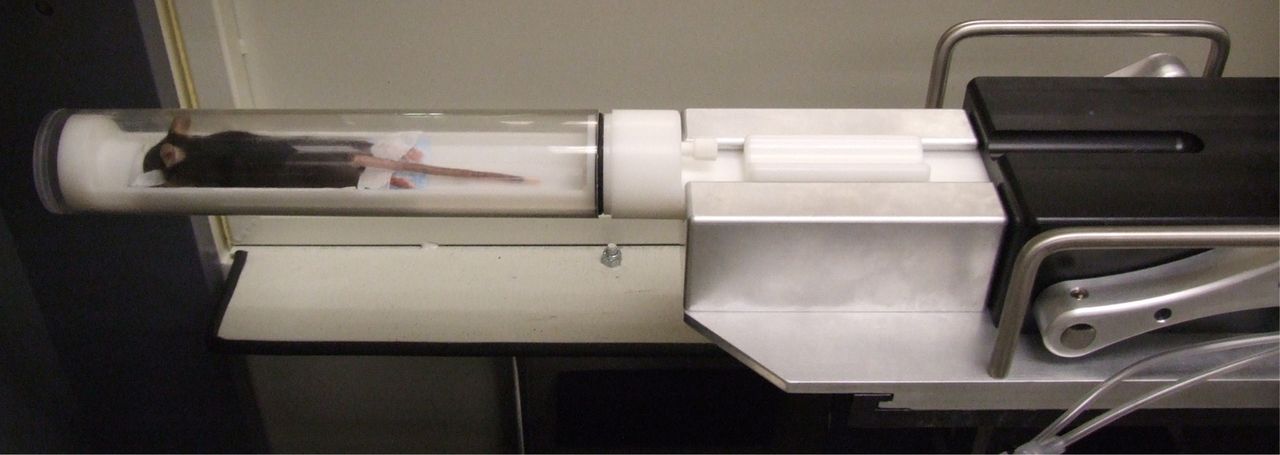
Mouse is placed in tube designed to facilitate anesthesia and positioning consistency. (Courtesy of David B. Stout.)
Constraints on Tracer Mass, Volume, and Radioactivity
The tracer mass injected into a small animal must be sufficiently low that the natural physiologic state of the animal is not affected. The rule of thumb is that the tracer mass will cause a maximal receptor occupancy of 1%. Because the tracer specific activity (Bq/g) is typically fixed, the allowed tracer activities are limited. For example, it was estimated that the maximal injected radioactivity of 11C-labeled raclopride, a PET ligand for D2-dopamine receptor, is 5.2 MBq in rats and 0.3 MBq in mice (16). Another constraint on the use of radiotracers in small animals is that the injection volume should be less than 10% of the animal’s total blood volume, which is 30 and 2.5 mL, respectively, for rats and mice. Hence, the commonly used tracer dilution for clinical applications in humans may not be appropriate and sometimes needs to be adapted for small-animal imaging.
Spatial Resolution
The spatial resolution of a small-animal PET scanner depends on 4 factors of the system design (17): the size of the detector crystal; the detectors’ decoding scheme, which determines the particular location in which photons interact with the detector; the positron’s movement range after its emission and before annihilation; and the annihilation photons’ absence of colinearity, which is intrinsic to the annihilation physics. After 20 y of intensive research and development (12), the best resolution reported for small-animal PET systems has been about 1 mm in full width at half maximum (18).
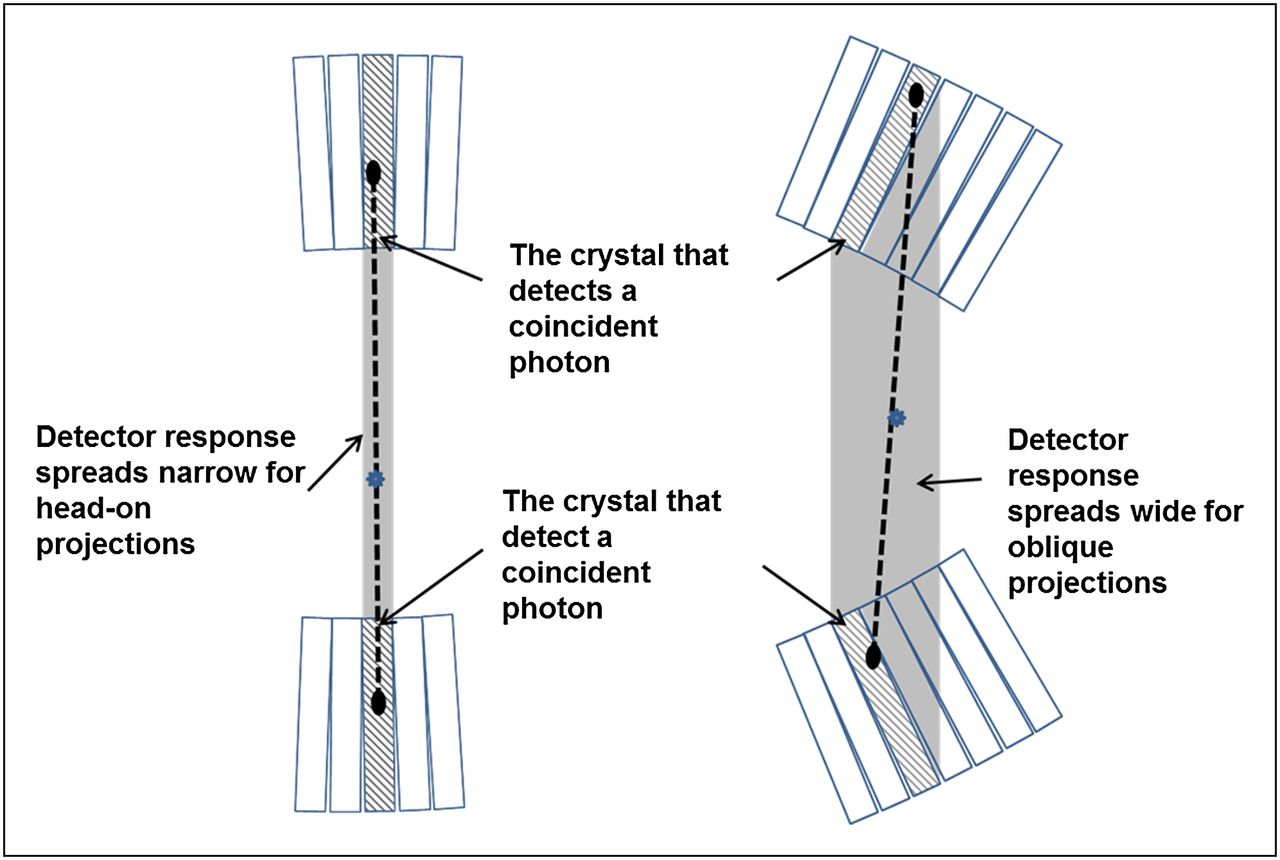
The primary advancement factor that leads to the very high resolution of recent small-animal PET scanners is the use of long and thin detector crystals, with the long side aligned with the radial direction and the narrow side facing the imaging field of view. A drawback is the higher probability that the detected photons are not from the head-on projection but from the side (oblique) projections by penetrating the neighboring crystals. As illustrated in Figure 3, the detector responses (the gray shades between the 2 crystals of the coincident event) are narrow for head-on projections and become wider for oblique projections. This effect, also known as parallax error, can be mitigated through the use of a few short crystals to replace each single long crystal (19–21) or by measurement of the depth of interaction within the crystal (22,23). Alternatively, the spatially variant detector response functions are modeled in the reconstruction algorithm (24,25) to achieve resolution recovery for the oblique projections emanating from off-center regions. The use of a statistical iterative reconstruction algorithm such as ordered-subset expectation maximization, which allows the incorporation of an accurate system response model, is a major advantage of the newer generation of small-animal PET scanners.

Diagram illustrating difference between head-on and oblique projections in terms of detector response spread (shaded area between crystals detecting coincidence event).
It is informative to have a comparison of the spatial resolutions of small-animal PET and human PET systems. The weight of a typical mouse is about 25 g. Compared with an average-sized adult, weighing 75 kg, the mouse is scaled down by a factor of 3,000 in weight and about 15 in size. For a 300-g rat, the weight and size scale-down factors are 250 and 6, respectively. To visualize the same level of structural detail in a mouse, compared with a human, the small-animal PET system needs to have a spatial resolution 15 times better than a human PET system. Given that state-of-the-art human PET systems achieve a spatial resolution of 6 mm, small-animal PET would need to have a spatial resolution of 0.4 mm for mouse imaging and 1 mm for rat imaging to distinguish the same level of structural detail in the images. As shown in Table 1, the current resolution limit of commercial small-animal PET systems is slightly more than 1 mm, whereas experimental prototypes achieve slightly less than 1 mm (23,26–30). Therefore, the resolution capability of small-animal PET is close to what is needed for rat imaging but not yet fully optimal for mouse imaging.
System Sensitivity
As is the case with other nuclear medicine imaging systems, the sensitivity of a small-animal PET system is primarily a measure of its efficiency in collecting the emission photons emanating from the animal. The system detection efficiency, commonly designated as absolute sensitivity, can be reported as counting rate per unit radioactivity in the scanner field of view (cps/Bq) or simply as percentage. Higher detection efficiency leads to a greater number of detected events, which usually will shorten image acquisition time.
Most small-animal PET systems use a cylindric geometry as used in human PET. Because of the relatively smaller diameter of the detector ring, small-animal PET developers are able to expand the detector rings in the axial direction and still have a number of detector channels similar to that used for human PET (31). For example, the Inveon (Siemens Preclinical Solutions) has 25,600 detector crystals (32) and the PET modules of the Biograph PET/CT system (Siemens) have 32,448 detector crystals (33). State-of-the-art small-animal PET systems' highest reported absolute sensitivity at the center of the field of view is approximately 10%, which is about 3 times that of a conventional human PET scanner.
Scatter and Attenuation Contributions to Image Quantification
Mice and rats are much smaller than humans. As represented by the standard phantoms used in National Electrical Manufacturers Association standards (34,35) for small-animal PET and human PET, the diameters of the polyethylene phantom cylinders for emulating mice, rats, and humans, respectively, are 25, 50, and 203 mm. For this reason, the amount of scattered events and the magnitude of attenuation are both much less in small-animal PET than in human PET. By simple calculation, the fractions of photons transmitted through the length of the cylinder diameter for the mouse, rat, and human phantoms are 79%, 62%, and 14%, respectively. The typical values of scatter fractions reported are 8% and 17% for mouse and rat phantoms, respectively (32), as compared with 33% for human PET (36). So the scatter and attenuation issues are less significant for small-animal PET than for human PET (37,38). When only qualitative or semiquantitative results are required, scatter and attenuation corrections may be skipped in small-animal PET studies.
Small-animal PET scanners are usually equipped with attenuation and scatter correction techniques that are the same as those for human PET in principle (39,40). When quantitative animal PET is required, a transmission or CT scan is included in the data acquisition protocol, and attenuation and scatter corrections are enabled in the image generation protocol.
Small-Animal PET and Multimodality Imaging
Since the late 1990s, a major research and development theme in the medical imaging community has been to explore the complementary roles of individual modalities and to promote and harness the power of combining several technologies into a single system or unit (41). Small-animal PET is an essential member of the multimodality microimaging family. Because of its high sensitivity and molecular imaging capability, it is ideally suited for combination with small-animal CT or MRI in providing complementary anatomic and functional information on the animal under investigation. When combined with optical imaging systems, which can image only targets near the body surface, small-animal PET’s capability of studying deep organs is most valuable.
Small-animal PET requires substantial supporting resources and equipment, such as cyclotron and PET radiochemistry facilities, to be fully exploited. Therefore, to achieve and make best use of the synergy of multimodality imaging, as well as to share the significant cost it incurs, core imaging facilities that host several microimaging systems are usually set up by large research institutes at a centralized location to provide services to the researchers in the vicinity (42).
EXAMPLES OF SMALL-ANIMAL PET APPLICATIONS
Applications of small-animal PET have been reported over a wide range of biologic processes (43). Here we present examples of small-animal PET applications in each of the 3 primary disease areas: oncology, cardiology, and neurology. Readers who are interested in more complete descriptions of small-animal PET applications are referred to a few excellent review articles (2–4).
Oncology
Cancer is the primary application of small-animal PET (3,44,45). Table 2 provides a few samples of common tracers and their targeted mechanisms used for oncology applications. Of these, glucose metabolism monitored with 18F-FDG is the one in greatest use clinically (46). There exist many other targeted mechanisms, such as tumor cell proliferation (47), gene expression (48,49), tumor angiogenesis (50), tumor hypoxia (51,52), and tumor apoptosis (53,54).
Sample PET Tracers Used in Oncology
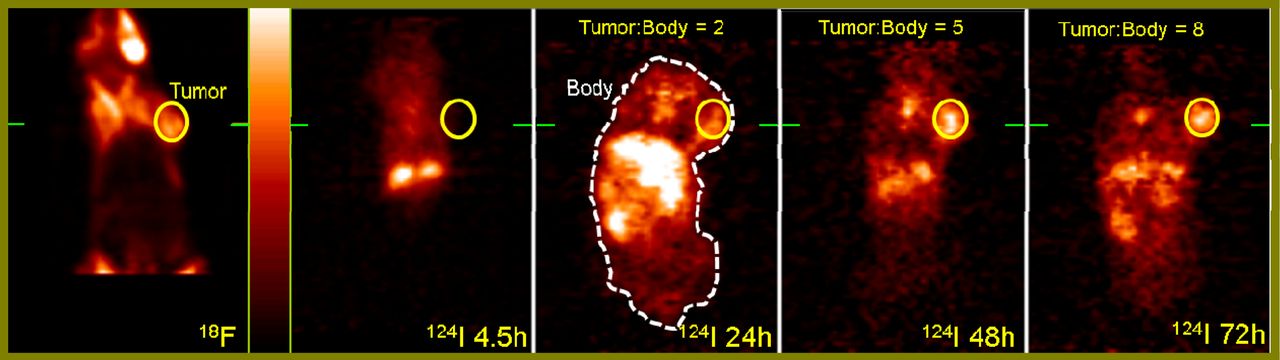
Figure 4 shows an example of a small-animal PET study for evaluating a new agent for both cancer diagnosis and treatment. The 18F-FDG image was acquired as a reference to evaluate the agent as a diagnostic and therapy follow-up tracer. The same mouse was then injected with a 124I-labeled derivative of pyropheophorbide-a, which is an imaging and photodynamic therapy bifunctional agent. Because of the long half-life of the 124I (4.2 d), a longitudinal study (multiple scans over time) was possible with the same mouse and the same agent. The mouse was imaged at 4 time points over 3 d. The tumor uptake relative to the rest of the body increased over time, indicating that the agent has promising potential as both a therapeutic and a tumor-monitoring agent.

18F-FDG image on left (coronal view) was acquired first as reference 90 min after injection of 9.4 MBq (254 μCi) of activity via tail vein of tumor-bearing C3H mouse. Mouse was then injected with 2.7 MBq (72 μCi) of 124I-labeled derivative of pyropheophorbide-a, a bifunctional diagnostic and therapeutic agent (75). Mouse was imaged for 30 min at 4.5, 24, 48, and 72 h after injection. Concentration ratios of bifunctional agent in tumor (solid-line circle in each image) to that in animal body (dashed outline in middle image) were 2, 5, and 8 at 24, 48, and 72 h after injection, respectively, indicating that agent has desired properties to be used in therapeutic and monitoring applications. Color palette (shown to right of 18F image) was scaled to minimum/maximum of transverse slice passing through center of tumor site (indicated by green bars) in each dataset. Display scheme was same for all images. 18F = 18F-FDG; 124I = 124I-pyropheophorbide derivative.
Cardiology
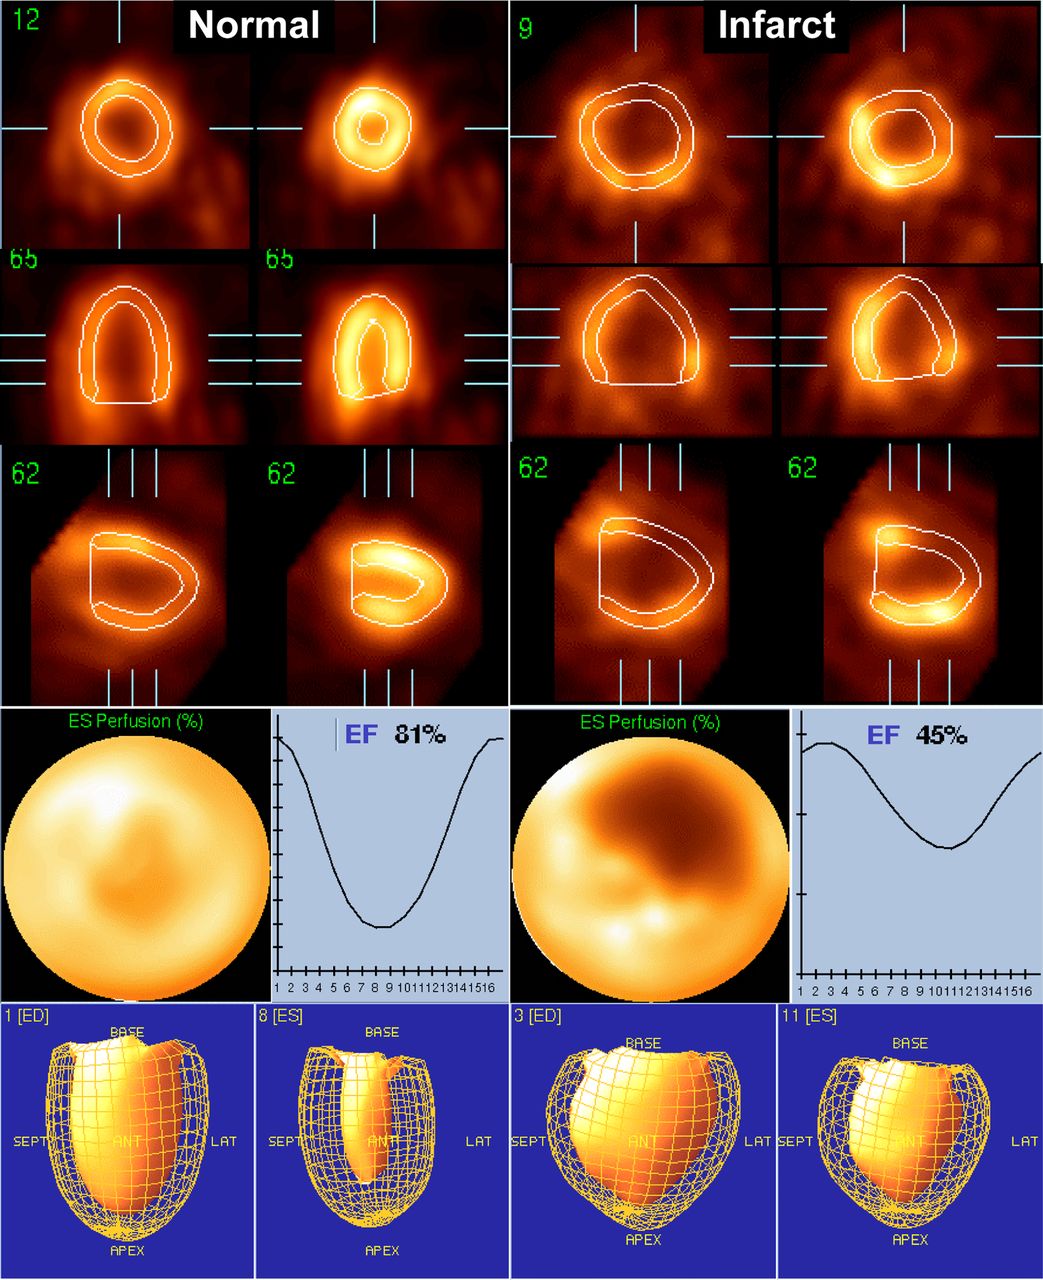
Small-animal PET has been used to study cardiac physiology, metabolism, and conditions similar to those in human and large-animal cardiac investigations. Imaging techniques to minimize wall motion effects such as electrocardiogram-gated data acquisitions and the corresponding image analysis approaches developed for human PET and SPECT cardiology can be used on rat or mouse images. Figure 5 shows an example of small-animal PET imaging of the cardiac functions of a normal rat and a rat with a region of myocardial infarction (55). Both rats were injected with 18F-FDG. The data were acquired in list mode and included both electrocardiogram gating and time markers. The normal-rat images depict homogeneous radiotracer distribution in the myocardium and a high ejection fraction. The images of the diseased rat myocardium demonstrate an uptake defect in the anterolateral segment, remodeling of the myocardium muscle, and a reduced ejection fraction. With gating, the image blurring due to cardiac motion was eliminated, and higher image contrast and definition were achieved. As a result, it was possible to better appreciate myocardial wall thickness because of minimization of wall motion and to distinguish the right ventricle, which statistically has much lower signal strength than the left ventricle (55). QGS (56), a quantitative analysis package initially developed for SPECT but validated for PET (57) cardiac imaging, was used to reorient the gated image sequences and obtain quantitative cardiac function parameters such as end-diastolic and end-systolic ventricular volumes, stroke volume, left ventricular ejection fraction, and polar maps of end-diastolic and end-systolic tracer distribution, wall thickening, and wall motion.

Electrocardiogram-gated 18F-FDG studies in normal and infarcted rats obtained using clinical cardiac analysis software QGS (56). Polar maps display end-systolic 18F-FDG uptake. Ejection fractions for normal and infarcted rats are 81% and 45%, respectively. ED = end-diastolic; EF = ejection fraction; ES = end-systolic. (Adapted with permission of (55).)
Neurology
Over the years, a wide selection of PET radiotracers has been developed for brain imaging, such as H215O for measuring cerebral blood flow, 18F-FDG for measuring glucose metabolism, 11C-raclopride for quantifying the postsynaptic D2 receptor level, 11C-Pittsburgh compound B for imaging β-amyloid deposition, and the radioligand 11C-(R)-(−)-RWAY for studying brain 5-hydroxytryptamine receptor 1A. Using these tracers, small-animal PET has many applications for studying the pathophysiology, pharmacology, and drug mechanisms of the brain (58).
Figure 6 is an example of a small-animal PET application in neuropharmacology. The study was to quantify how P-glycoprotein (an efflux pump at the blood–brain barrier) and its blockade with cyclosporin A affect rat brain uptake of 11C-(R)-(−)-RWAY (59). Figures 6A and 6B show a coronal rat brain image of 11C-(R)-(−)-RWAY uptake in which 2 regions of interest were placed on the left and right hippocampi in reference to the rat brain atlas. The region-of-interest time–activity data of the hippocampi, acquired for 100 min after injection and framed with nonuniform time intervals, were then used for kinetic modeling. Figures 6C and 6E show the total-brain images of the control and cyclosporin A–treated rats, respectively. It is clear that when the efflux of the P-gp was blocked with cyclosporin A, the rat brain uptake of 11C-(R)-(−)-RWAY increased significantly. This is also confirmed by the parametric images of binding potential shown in Figures 6D and 6F, obtained by kinetic modeling.
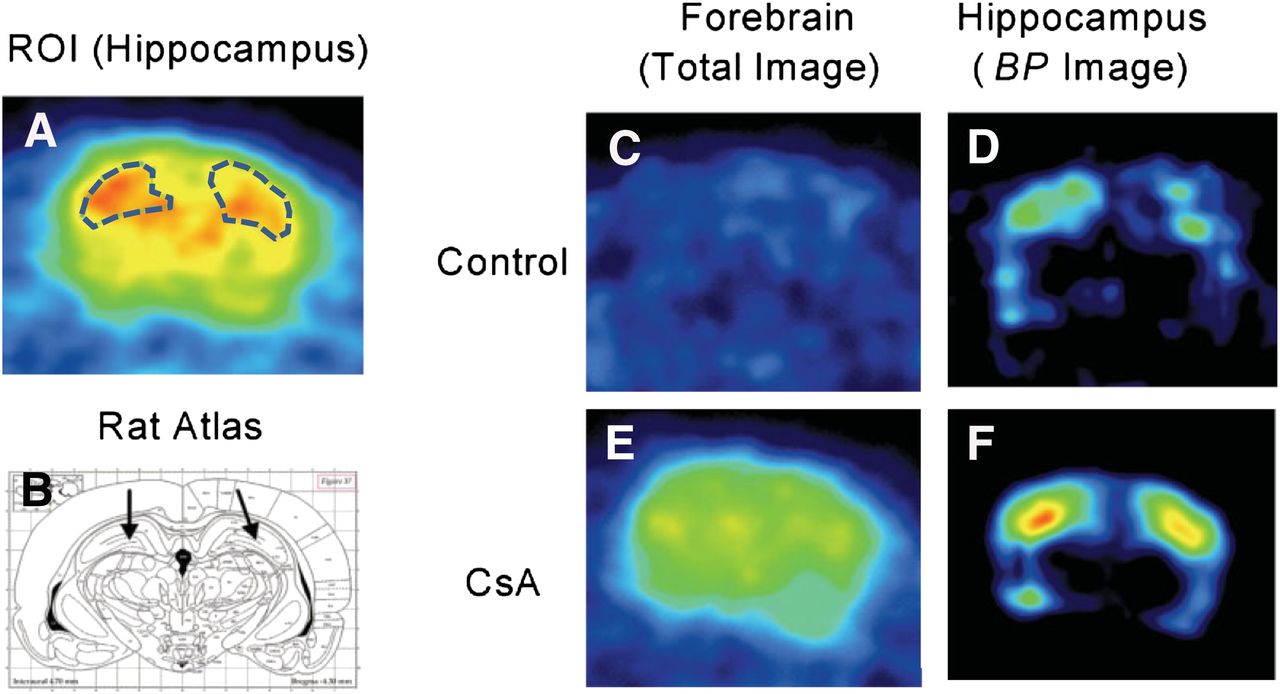
Uptake of 11C-(R)-(−)-RWAY in rat brain. Regions of interest were placed on left and right hippocampi (A), using coronal PET images with reference to rat brain atlas (B). Total uptake of radioactivity is shown in control rats (C) and cyclosporin A–treated rats (E). Similarly, binding potential images are shown in control rats (D) and cyclosporin A–treated rats (F). Cyclosporin A treatment significantly boosted uptake of 11C-(R)-(−)-RWAY, indicating blockade of efflux pump at blood–brain barrier. BP = binding potential; CsA = cyclosporin A; ROI = region of interest. (Reprinted with permission of (59).)
CUTTING-EDGE SMALL-ANIMAL PET DEVELOPMENTS
Although small-animal PET has established its position in molecular imaging, many exciting new technologic developments are bringing the methodology to the next level. A few current hot topics are described here to provide a glimpse of the near future of small-animal PET.
Imaging of Freely Moving Rodents
The standard small-animal PET setup is that the subject rodent lies on an animal bed within a fixed small-animal PET gantry. The rodent, ideally, remains still throughout the imaging procedure. Any partial or whole-body motion would cause displacement of detected events and therefore undermine image quality. Although it is well known that forced immobilization or anesthesia of the animal can lead to unusual physiologic responses that may affect the experimental results, for lack of better alternatives these 2 approaches have been the only means to minimize animal movement until recently.
Two revolutionary better alternatives have just emerged (60). The first is enabled by an exquisitely engineered small-animal PET scanner that a rat can wear (61,62). Weighing a mere 250 g, the detector ring and front-end electronics of the scanner are fitted to the head of a rat and attached to an animal mobility system that supports the weight of the scanner and allows the rat to move freely around a 40 × 40 cm behavioral chamber while PET images are acquired. The second (62) involves a small-animal PET detector system that surrounds a chamber, and a precise and continuous tracking system that allows the position of the rodent’s head within the chamber to be measured over time. The animal roams in the chamber during an imaging session. For image reconstruction, the tracking information is used to align the detected PET events to form a coherent animal body volume.
These 2 new techniques open a noninvasive window for assessing brain function and behavior in response to a wide variety of interventions in freely moving, nonanesthetized rodents.
Integration with Small-Animal MRI
The integration of PET and CT in both clinical and preclinical imaging settings has demonstrated the synergism of strengths achieved through the fusion of anatomic and functional imaging. Using the same strategy but with distinct new advantages, the integration of PET with MRI is the latest breakthrough in multimodality imaging developments (63). Compared with CT, MRI has 3 critical advantages: superior soft-tissue contrast, simultaneous imaging with small-animal PET, and freedom from ionizing radiation. These advantages make integrated PET/MRI and integrated small-animal PET/MRI an enabling technology for creating a new field in molecular and cellular imaging (64,65). Knowledge of various metabolic and functional parameters measured at the same time as anatomy may open new insights into the organization of the brain and its changes in disease (66).
For example, integrated small-animal PET/MRI may be used to assess cell replacement approaches for treatment of various neurologic disorders. First, the grafted stem cells are labeled with MRI contrast-enhancing agents (ultra-small superparamagnetic iron oxide particles and micron-sized iron oxide particles) (67). Then, over the therapy assessment period, the migration of the transplanted cells can be imaged in the morphologic context of MRI, and the viability and function of the transplanted cells can be imaged in the functional context of PET (68).
CONCLUSION
Small-animal PET has exquisite sensitivity and the ability to provide quantitative, in vivo measurements of physiology, metabolic pathways, and molecular targets deep inside tissue. Over the last 15 y, this imaging technique has become a critically important tool in animal-based biomedical research. The application of small-animal PET has been expanded into many additional clinical indications. Its importance has been further enhanced by integration with other small-animal imaging modalities such as CT and MRI. Its unique role in leading clinical PET system development will advance PET technology to exciting new discoveries.
Acknowledgments
No potential conflict of interest relevant to this article was reported.
Footnotes
Published online May 11, 2012.
↵* NOTE: FOR CE CREDIT, YOU CAN ACCESS THIS ACTIVITY THROUGH THE SNM WEB SITE (http://www.snm.org/ce_online) THROUGH SEPTEMBER 2014.
REFERENCES
- Received for publication September 26, 2011.
- Accepted for publication December 16, 2011.


Jump to section
Related Articles
Cited By...
- In Vivo Evaluation of Brain [18F]F-FDG Uptake Pattern Under Different Anaesthesia Protocols
- Was size of healthcare institution a factor affecting changes in healthcare utilisation during the COVID-19 pandemic in Korea? A retrospective study design analysing national healthcare big data
- Identification of pre-synaptic density networks using SV2A PET imaging and ICA in healthy and diseased mice
- Is There a Need for a Pediatric PET/CT Camera?
- Assessing PET Parameters in Oncologic 18F-FDG Studies