


Abstract
This work investigated whether 18F-FDG PET standardized uptake value (SUV) is stable over time in the normal human liver. Methods: The SUV-versus-time curve, SUV(t), of 18F-FDG in the normal human liver was derived from a kinetic model analysis. This derivation involved mean values of 18F-FDG liver metabolism that were obtained from a patient series (n = 11), and a noninvasive population-based input function was used in each individual. Results: Mean values (±95% reliability limits) of the 18F-FDG uptake and release rate constant and of the fraction of free tracer in blood and interstitial volume were as follows: K = 0.0119 mL·min−1·mL−1 (±0.0012), kR = 0.0065·min−1 (±0.0009), and F = 0.21 mL·mL−1 (±0.11), respectively. SUV(t) (corrected for 18F physical decay) was derived from these mean values, showing that it smoothly peaks at 75–80 min on average after injection and that it is within 5% of the peak value between 50 and 110 min after injection. Conclusion: In the normal human liver, decay-corrected SUV(t) remains nearly constant (with a reasonable ±2.5% relative measurement uncertainty) if the time delay between tracer injection and PET acquisition is in the range of 50–110 min. In current clinical practice, the findings suggest that SUV of the normal liver can be used for comparison with SUV of suspected malignant lesions, if comparison is made within this time range.
PET has become an indispensible component for cancer management, allowing assessment of the uptake of 18F-FDG in various tumors. The standardized uptake value (SUV) is currently used in clinical practice (1). However, this index is subject to some variability, which has led to proposals that 18F-FDG accumulation in a malignant lesion be compared with the background uptake in, for example, the liver parenchyma (2–4). Indeed, it has been reported that SUV in the liver is quite stable over time. However, 18F-FDG liver metabolism is known to involve both uptake and release of the tracer, because of an increased glucose-6-phosphatase activity (5), whereas 18F-FDG uptake by a malignant lesion is usually considered irreversible. Another characteristic feature of the liver is that it has a peculiar dual blood supply, with an arterial (hepatic) input and a portal vein input.
Besides the SUV index, compartmental analysis is considered a gold standard for tracer quantification (6–11) but requires invasive arterial blood sampling. To our knowledge, these methods have been used by only a few authors to investigate 18F-FDG metabolism in the normal liver of animals (12–14) and of humans (15,16). In particular, the increased glucose-6-phosphatase activity in the normal liver does not allow implementation of Patlak compartmental analysis (2–4), which assumes irreversible trapping of the tracer.
The aim of this work was to investigate whether 18F-FDG PET SUV is stable over time in the normal human liver, by deriving the SUV-versus-time curve, SUV(t), from a kinetic model analysis. For ethical reasons, in each patient of a series, it did not seem reasonable to regularly acquire data over the liver through the whole 18F-FDG tissue time–activity curve, which may extend far beyond 2 h after injection (15). Therefore, in this noninvasive study, a kinetic model analysis was applied in each patient that involved a noninvasive population-based input function (17) and data from only 2 PET scan acquisitions: a first static acquisition (covering a large part of the body, for diagnostic purposes) and a second late dynamic acquisition over the liver (>2 h after injection) (18). Then, mean values of the 18F-FDG uptake and release rate constant and of the fraction of free tracer in blood and interstitial volume were assessed from the patient series, and SUV(t) was derived from these mean values.
MATERIALS AND METHODS
Participants
The normal liver of 11 patients (4 women and 7 men; age range, 39–82 y old; mean, 60 y) was investigated in the framework of current clinical practice. This study conformed to the standards set by the Declaration of Helsinki and was approved by the ethics committee of our university hospital complex. All patients gave informed consent before undergoing imaging. Although the patients were referred for suspected malignant hepatic nodules revealed on MRI, CT, or sonography, only normal liver tissue distant from the suspected nodule and exhibiting homogeneous 18F-FDG uptake was investigated in this study. No patient had cirrhosis or any other hepatic dysfunction (normal hepatic serology). No patient was receiving chemotherapy or glucocorticoid steroid treatment. After a 6-h fast, preinjection blood glucose levels averaged 0.97 g/L, and an average 18F-FDG dose of 358 MBq (Table 1) was injected intravenously for less than 1 min, with no tissue-infiltrated dose seen during any part of the scan.
Patient Characteristics
18F-FDG Kinetic Modeling
Kinetic model analysis has been described in detail elsewhere (18) and will be described only briefly here.
A triexponential decay input function was arbitrarily used in each individual from recently published data by Vriens et al. (17). In comparison with their results, the decay constants have been modified to take into account the 18F physical decay. Then, trapped 18F-FDG activity per tissue unit volume, λCT(t) (kBq·mL−1), was expressed as (18):
Now, let us consider the SUV at time t:
Furthermore, relationships can be established between the 18F-FDG transport rate constants of this study and those of a 3-compartment model analysis (6–9):
Data Acquisition
PET acquisitions were achieved on a Discovery ST scanner (GE Healthcare) in a manner similar to that described in a published study (18). A first PET static acquisition was achieved at a mean time t1 of 72 min after tracer injection (range, 55–89 min; Table 1), involving several steps to cover a large part of the body, for diagnostic purposes. Then, a second PET dynamic acquisition (1 step and 10 frames; 3-min acquisition per frame) was achieved over the liver at a mean time t2 of 159 min after tracer injection (range, 130–194 min; Table 1), always under fasting conditions and with identical acquisition parameters. In implementing the model analysis, for the first static acquisition, we considered the time of the acquisition of the particular step involving the liver, not that of the beginning of the entire scan.
Image Processing and Quantification of K, kR, and F
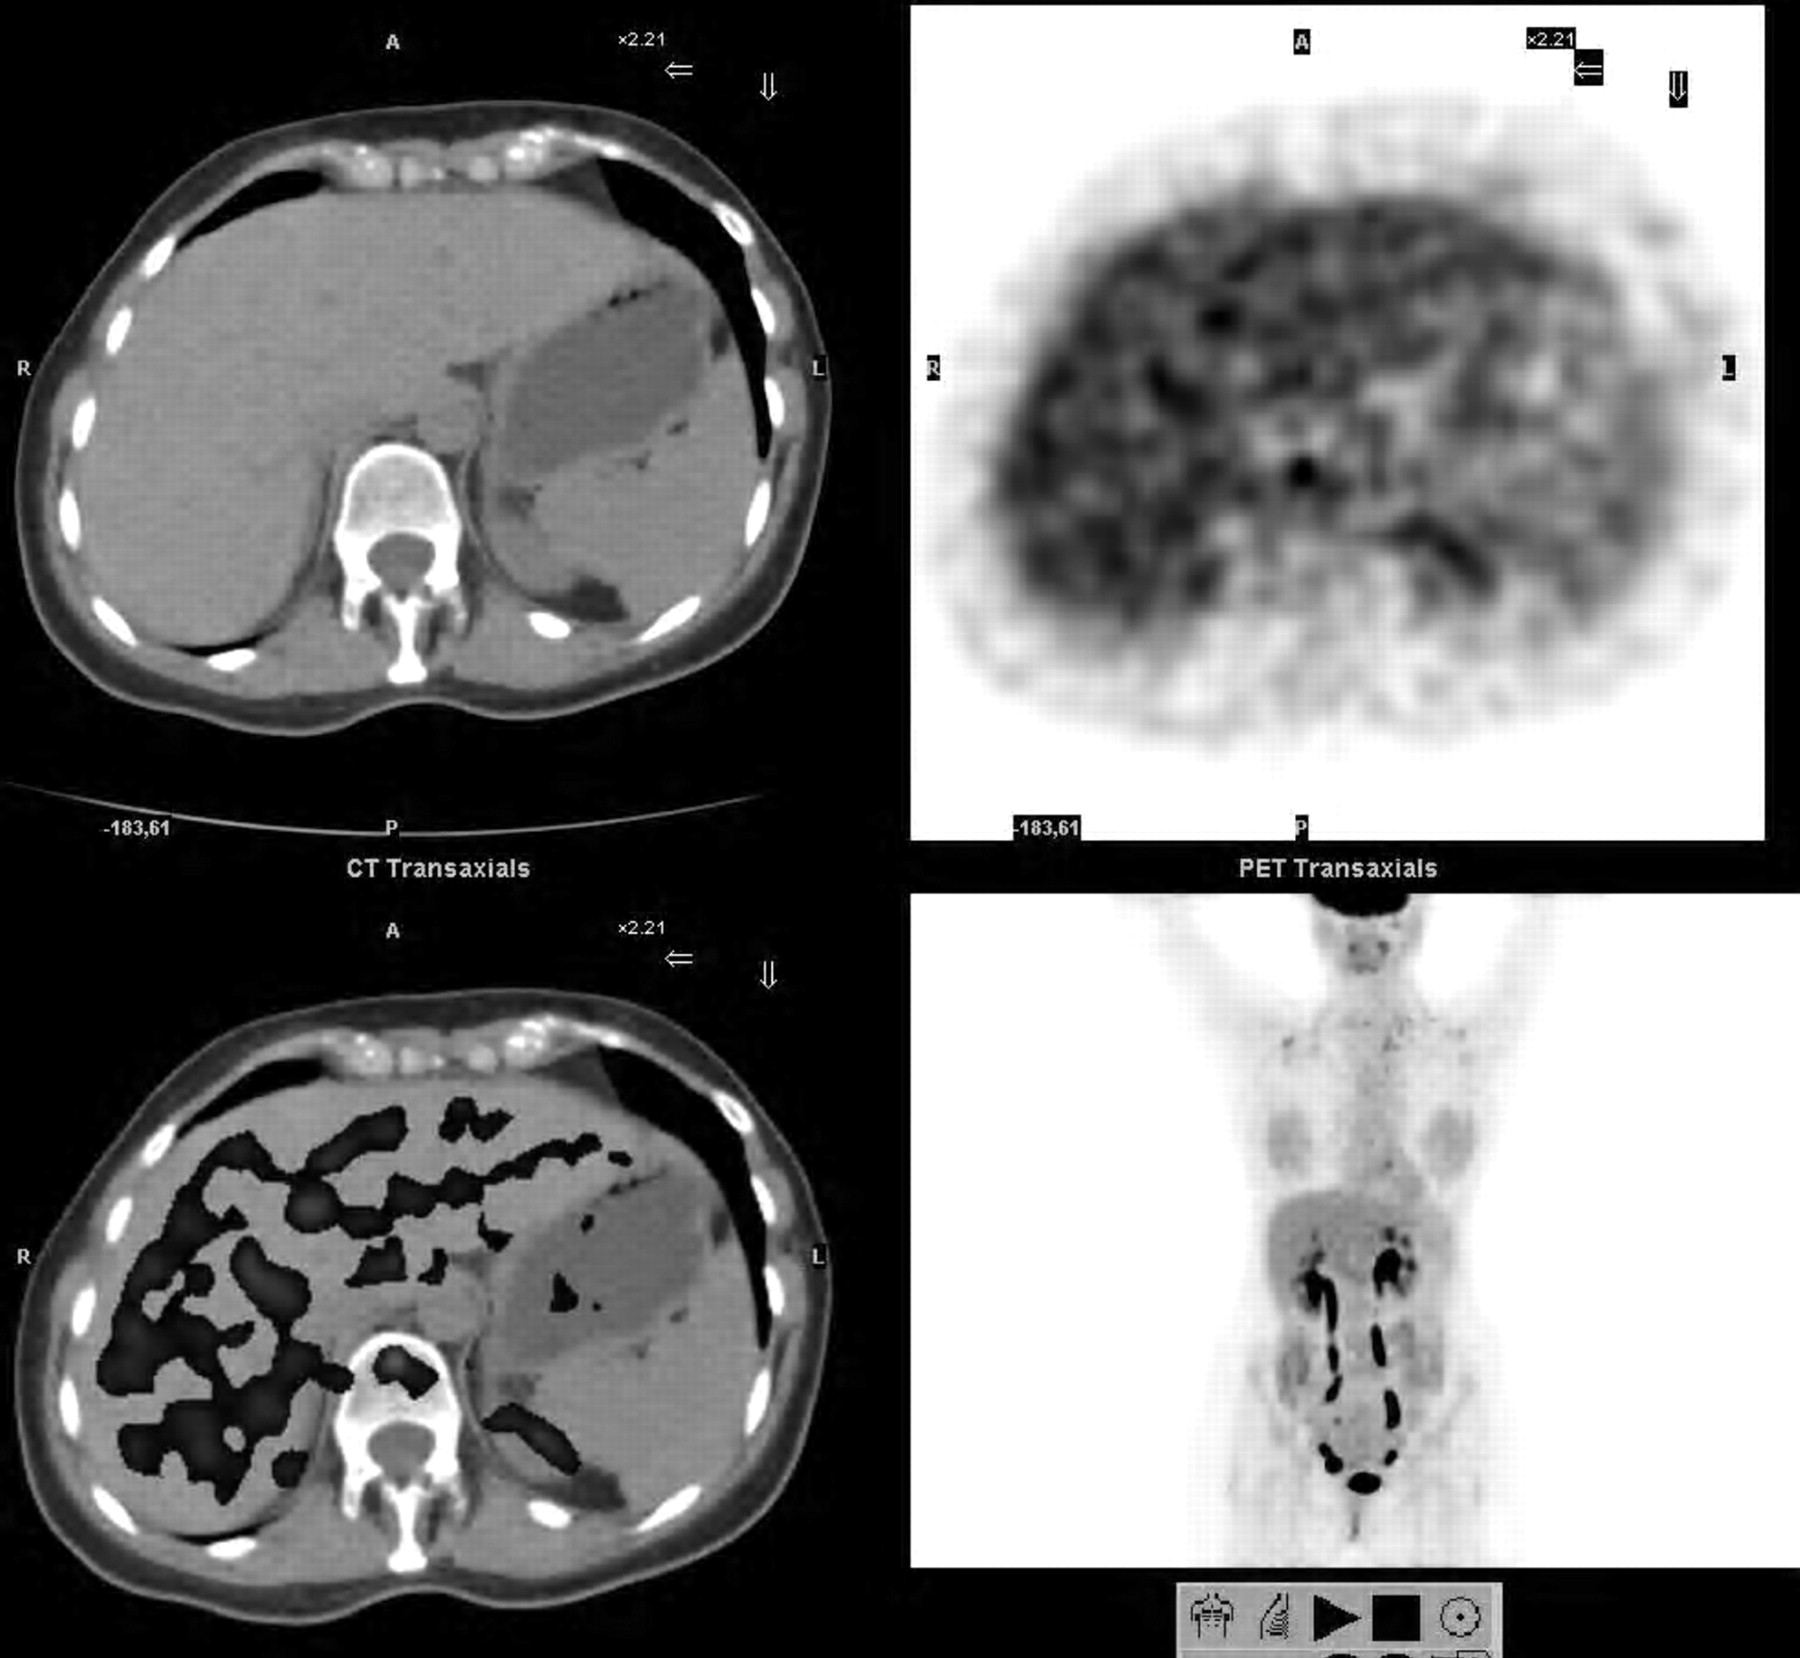
In each patient, 11 mean values of normal liver activity (in kBq/mL) to input in the model were assessed using a Xeleris workstation (GE Healthcare), from the early static acquisition (n = 1) and from the delayed dynamic acquisition (n = 10). Each mean value was computed from 3 mean values obtained with a circular region of interest (5–10 cm in diameter, depending on the patient) in 3 contiguous slices over normal liver tissue at the same position in each frame (Fig. 1; a color version of this figure is available as a supplemental file at http://tech.snmjournals.org.). These values were given by the manufacturer with a decay correction that has been considered in the computation. K, kR, and F were computed on a calculation sheet, using a solver program (Microsoft Excel). For each of the 11 experimental values of normal liver activity, the ratio of the PET value (experimental) to the theoretic one given by Equation 4 was assessed, leading to a mean ratio over the series (experimental vs. theoretic). The solver program was used to target this mean ratio to a value of 1 by optimizing K, kR, and F. This optimization required initial values of K and kR, which were set to 0.0123 mL·min−1·mL−1 and 0.0173 min−1, respectively, according to mean values of the rate constants K1, k2, k3, and k4 by Okazumi et al. in humans (Eqs. 5 and 6) (15). The parameter F (milliliter blood per milliliter liver tissue) was initially set to 0.4 mL·mL−1, according to the results of Munk et al. in pigs (13).

Axial slices over liver: CT image (top left), PET image (top right), PET/CT merged image (bottom left), and maximum-intensity projection (bottom right). Circular region of interest 5–10 cm in diameter, depending on patient, was positioned over normal liver in 3 contiguous slices that were similar in each static or dynamic frame.
Statistical Methods and Derivation of SUV(t)
Mean values and SD of K, kR, and F were assessed from the patient series, after optimization in each patient. Then, 95% reliability limits were calculated for each mean value and were compared with the results of Okazumi et al. (15) for K and kR and with those of Munk et al. (13) for F (95% reliability; Student t test). In particular, this comparison required computation of the 95% reliability limits of the macroparameters K and kR from Equations 5 and 6, respectively, involving SD of the rate constants K1, k2, k3, and k4 by Okazumi et al.
Furthermore, decay-corrected SUV(t) over the series was derived from the mean values of K, kR, and F (Eqs. 1, 3, and 4) and the population-based input function of Vriens et al.(17).
RESULTS
Patient characteristics are presented in Table 1, including mean SUV in normal liver at t1 (SUV1: early static acquisition) and t2 (SUV2: first point of the delayed dynamic acquisition). These values are given with the decay correction made by the manufacturer. Table 1 shows that SUV1 was significantly greater than SUV2 (P = 0.001: 2-tailed sign test). The mean values (with 95% reliability limits) of 18F-FDG uptake and the release rate over the series were compared with those of Okazumi et al. (15): K = 0.0119 mL·min−1·mL−1 ± 0.0012 versus K = 0.0123 ± 0.0047 mL·min−1·mL−1 and kR = 0.0065 ± 0.0009 min−1 versus kR = 0.0173 ± 0.0032 min−1, respectively. No significant difference in K was found between the results of Okazumi et al. (15) and ours, whereas there was a significant difference in kR (95% reliability; Student t test). No significant correlation was found between K or kR and SUV1 or SUV2. No significant correlation was found between K or kR and preinjection blood glucose level or any of the following parameters: age, weight, height, injected activity, time delay between injection and first static PET acquisition, time delay between injection and second dynamic PET acquisition, or time delay between the 2 acquisitions. The part of the free tracer in blood and interstitial volume over the series was assessed to be F = 0.21 mL·mL−1 ± 0.11 (95% reliability limits), which was not significantly different from the value of F = 0.40 mL·mL−1 ± 0.10 found by Munk et al. (13) (95% reliability; Student t test).
Figure 2 compares experimental and theoretic (Eq. 4) normal-liver mean activity versus time per tissue volume unit in patient 3 (Table 1; after the optimization procedure). The mean relative deviation of the experimental versus theoretic data over the series was 3.8% (minimum to maximum, 1.6%–5.7%). Figure 2 also shows the theoretic time–activity curve of trapped 18F-FDG (Eq. 1) and the product λ × F × Cp(t), that is, the theoretic 18F-FDG time–activity curve in blood and reversible compartment in normal liver tissue (Eq. 4).

Time–activity curves for patient 3 (Table 1). Data are not corrected for 18F physical decay. 1 = experimental (1 + 10 data points) and theoretic (solid line; Eq. 4) whole liver tissue activity versus time (per tissue volume unit); 2 = theoretic time–activity curve of trapped 18F-FDG (Eq. 1); 3 = theoretic 18F-FDG time–activity curve in blood and reversible compartment.
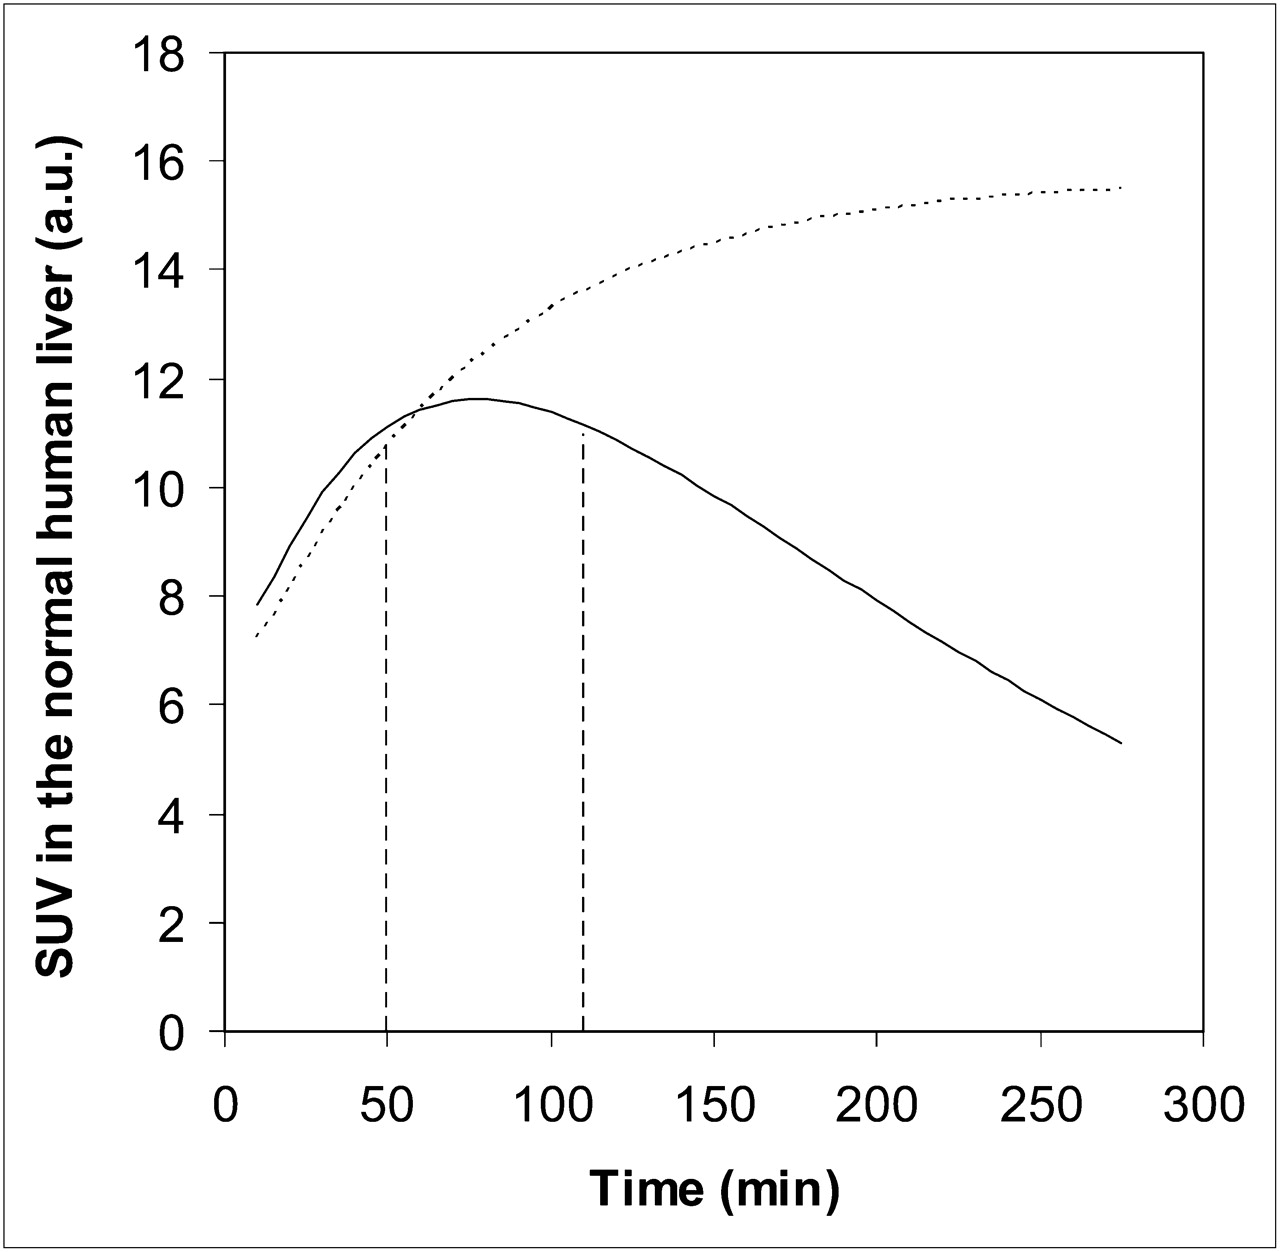
Figure 3 shows mean 18F-FDG liver activity versus time (over the series, in arbitrary units), which is proportional to SUV(t) in the normal liver (Eq. 3). Mean values of 18F-FDG metabolism (Table 1) and decay correction were used (as is usually done by the manufacturer). SUV(t) smoothly peaked at t = 75–80 min after injection, and SUV(t) assessed between 50 and 110 min after injection was within 5% of the peak value. As a consequence, decay-corrected SUV(t) can be considered nearly constant between 50 and 110 min after tracer injection, with a ±2.5% relative measurement uncertainty. Extending the range to 40–130 min after tracer injection, that is, SUV(t) within 10% of the peak value, increased the relative measurement uncertainty from ±2.5% to ±5%. For comparison, Figure 3 also simulates the 18F-FDG activity versus time for a possibly malignant lesion with irreversible tracer trapping, of which tracer metabolism has been arbitrarily set to K = 0.0095 mL·min−1·mL−1, kR = 0 min−1, and F = 0.12 mL·mL−1, to exactly match that of the normal liver tissue at 1 h after injection.

(Solid line) Simulation of decay-corrected mean 18F-FDG liver activity vs. time (arbitrary unit), which is proportional to decay-corrected SUV(t). Mean values of 18F-FDG metabolism in normal liver over series were used. Vertical lines show 50- to 110-min time range between tracer injection and acquisition, in which SUV(t) is within 5% of peak value (t = 75–80 min). (Dotted line) Simulation of decay-corrected 18F-FDG activity vs. time of possibly malignant lesion with irreversible 18F-FDG trapping exactly matching that of normal liver tissue at 1 h after injection.
DISCUSSION
The aim of this work was to investigate whether 18F-FDG PET SUV is stable over time in the normal human liver, by deriving SUV(t) from a kinetic model analysis. It has been reported that SUVs in normal tissues are usually not stable with time (4), except for the liver SUV, which is quite stable over time and therefore can be used for comparison with suspected malignant lesions (3). Figure 3 illustrates this feature, showing that decay-corrected SUV(t) is within 5% of the peak value if there is an injection-acquisition time delay in the range of 50–110 min. This result suggests that decay-corrected SUV(t) in the normal human liver can be considered nearly constant between 50 and 110 min after tracer injection, with a ±2.5% relative measurement uncertainty. Although this proposal is valid both for mean SUV (over an area or a volume) and maximal SUV, the ±2.5% relative measurement uncertainty should be added to further uncertainty related to quantitative 18F-FDG PET itself. The latter is much lower for mean SUV (e.g., from large liver volumes) than for maximal SUV (from 1 voxel), which was therefore not recommended for normalization (3,4). Furthermore, simulation of the irreversible 18F-FDG uptake in a malignant lesion in Figure 3 also illustrates the advantage of delayed PET for identifying liver metastases (19,20). Indeed, in our simulation, although the normal liver and the simulated malignant lesion have an identical decay-corrected SUV at 1 h after injection, normal-liver SUV(t) smoothly decays after the peak (t = 75–80 min after injection), whereas SUV(t) of the malignant lesion continues to grow, reaching a plateau.
SUV(t) was derived from mean values of 18F-FDG metabolism that were assessed by means of late dynamic PET. For ethical reasons, we did not acquire simple SUVs at different time points, because the whole 18F-FDG tissue time–activity curve may extend far beyond 2 h after injection (Fig. 2) (15). No significant difference in the 18F-FDG uptake rate constant was found between the results of Okazumi et al. (15) and ours, whereas there was a significant difference in the 18F-FDG release rate constant: K = 0.0123 ± 0.0047 mL·min−1·mL−1 versus K = 0.0119 ± 0.0012 mL·min−1·mL−1, and kR = 0.0173 ± 0.0032 min−1 versus kR = 0.0065 ± 0.0009 min−1, respectively (95% reliability; Student t test). The discrepancy in kR may be explained by considering that Okazumi et al. did not implement a tumor-blood volume correction (15), that is, F was set to zero, and therefore the apparent release rate constant was increased. Indeed, both free and trapped 18F-FDG in a voxel are involved in the PET measurements, and the free 18F-FDG time–activity curve decreases much earlier and more strongly than the trapped 18F-FDG time–activity curve. Furthermore, the significant value of kR we found was in agreement with Gallagher's results showing a significant tracer clearance from normal liver (5), whereas it was not in agreement with the results of Iozzo et al. (14) who found that k4, and hence kR, was small in comparison with the uptake rate constant K, under fasting conditions. The findings suggest that, when kR is negligible, Equation 2 would apply and therefore the slope of the trapped 18F-FDG activity per tissue volume unit would strictly grow, reaching a plateau. Such a feature is not in agreement with our results (Table 1), which clearly show that SUV1 at t1 (early static acquisition) was always larger than SUV2 at t2 (first point of the delayed dynamic acquisition) (P = 0.001: 2-tailed sign test) (Fig. 3). The part of the free tracer in blood and interstitial volume was assessed to be F = 0.21 ± 0.11 mL·mL−1, which was not significantly different from the F = 0.40 ± 0.10 mL·mL−1 found by Munk et al. in pigs (13) (95% reliability; Student t test). This nonzero value of F is not in agreement with that fixed to zero by Okazumi et al. (15) and Brix et al. (12), a setting discussed by Munk and Keiding (21). As a landmark, Blustajn et al. found a value of 0.26 ± 0.06 (SD) mL·mL−1 for the liver blood volume in rats using the Evan blue dilution technique, and a value of 0.28 ± 0.02 (SD) mL·mL−1 using a macromolecular MRI contrast agent at equilibrium (22).
SUV(t) was derived from a kinetic model analysis that involved a population-based, and hence noninvasive, input function in each individual (17). Although reduced relative deviations between experimental PET data and a theoretic fitting were observed in each individual (range, 1.6–5.7; mean, 3.8% over the patient series) (Fig. 2), it is suggested that this population-based input function likely yielded a large part of the measurement uncertainty of K, kR, and F (K = 0.0119 ± 0.0012 mL·min−1·mL−1; kR = 0.0065 ± 0.0009 min−1; F = 0.21 ± 0.11 mL·mL−1 [95% reliability limits]), and hence of SUV(t), because there are actual variations in the input function between individuals. Nevertheless, despite this variability, the use of a population-based input function has been sufficient for the aim of this study, that is, to noninvasively derive SUV(t) from mean values of 18F-FDG metabolism in the normal human liver. Moreover, this variability reasonably increases the relative measurement uncertainty of SUV(t) in the normal liver. Indeed, our study has shown that extending the time range for its assessment from 50–110 min to 40–130 min increases the relative measurement uncertainty from ±2.5% to ±5%. Furthermore, although individual invasive input functions could be used in further experiments, the liver has a peculiar dual blood supply, with an arterial (hepatic) input and a portal vein input, and cannulation of the portal vein in humans does not seem ethically reasonable (12–14,16). In addition, the average time for the 18F-FDG molecules to pass from the aorta to the portal vein (mean transit time) was about 25 s (in foxhounds) (12), which is much less than the 3-min time per step of the acquisition, and a single input model could be considered a good approximation for liver blood flow measurement (14).
CONCLUSION
In the normal human liver, decay-corrected SUV(t) smoothly peaked at an average of 75–80 min after 18F-FDG injection and was within 5% of the peak value between 50 and 110 min. This finding suggests that in current clinical practice, SUV of the liver can be used for comparison with SUV of suspected malignant lesions (with a reasonable ±2.5% relative measurement uncertainty), if comparison is made within this time range.
Acknowledgments
No potential conflict of interest relevant to this article was reported.
Footnotes
Published online Aug. 30, 2011.
REFERENCES
- Received for publication March 3, 2011.
- Accepted for publication May 11, 2011.


