


Abstract
Our aim was to evaluate the effect of 4-dimensional (4D) 18F-FDG PET/CT in the detection of pulmonary lesions. Methods: Fifty-seven pulmonary lesions were prospectively assessed in 37 patients (26 men and 11 women) with a mean age of 66.3 y. Twenty-nine of these patients had a history of neoplasm. All patients underwent 3-dimensional (3D) total-body PET/CT and 4D thoracic PET/CT (synchronized with respiratory movement). Maximum standardized uptake value (SUVmax) was obtained for each lesion in both studies. For the 4D studies, we selected the SUVmax in the respiratory period with the highest uptake (“best bin”) and the average value over all bins (“average gated”). SUVmax percentage difference between 3D and 4D PET/CT and the relationship of this value to the diameter and location of the lesions were calculated. Statistical parameters were calculated for 3D and 4D PET/CT. Results: Fifty-four of 57 lesions showed an increase of SUVmax in the 4D study with respect to the 3D study. The mean SUVmax was 3.1 in the 3D study. 4D PET/CT studies showed a mean SUVmax of 4.5 for the best-bin study and 3.9 for the average gated study. The percentage difference in mean SUVmax between 3D and 4D studies (best bin and averaged gated) was 72.9% and 48.8%, respectively. The smaller the lesion, the greater was the SUVmax percentage difference (P < 0.05). However, no statistical differences dependent on the location of the lesions were observed. Final diagnosis showed that 37 lesions were malignant. The sensitivity, specificity, positive predictive value, and negative predictive value were 37.8%, 95%, 93%, and 45%, respectively, for 3D studies and 70.3%, 70%, 81.2%, and 56%, respectively, for 4D best-bin studies. Conclusion: Characterization of malignant lung lesions was better with 4D PET/CT than with standard PET/CT.
The role of PET with 18F-FDG has largely been demonstrated in clinical oncology, especially lung cancer (1). In addition to qualitative analysis, semiquantitative analysis using the standardized uptake value (SUV) may be helpful in distinguishing between benign and malignant lesions. However, several factors can influence this parameter, particularly organ motion due to respiratory movement.
Although the global sensitivity and specificity of 18F-FDG PET for diagnosis of solitary pulmonary nodes are 96.8% and 77.8%, respectively, sensitivity decreases for lesions smaller than 2 cm (70%) (2–4). Furthermore, the evaluation of small lesions in the base of the lungs presents challenges due to respiratory movement, in addition to the partial-volume effect (5,6). Movement results in image blurring, leading to imprecise quantification of the size and uptake of lesions (7). These inaccuracies may produce problems in diagnosis and in lesion volume definition for planning radiotherapy, especially if respiration-gated radiotherapy is used (8,9).
In hybrid equipment, the use of CT as a transmission source offers several advantages over conventional 68Ge or 137Cs rod sources. CT data have a higher signal-to-noise ratio, and the acquisition time of a transmission scan is considerably reduced. However, the introduction of CT for attenuation correction is not free of disadvantages. During a helical CT scan of a patient with pulmonary nodules, the lesion may be captured at a phase of the respiratory cycle that is different from its respiration-averaged position in the PET emission data. This event has a significant frequency and may affect up to 85% of the cases, with mean coregistry differences of about 2–3 cm (10). Furthermore, these differences are more significant in the right hemithorax and inferobasal portions; therefore, some authors recommend that the emission study be viewed without attenuation correction (11,12).
With the development of combined PET/CT devices, respiratory motion has greater impact. A PET image alone corresponds to an average of multiple respiratory cycles and is susceptible to motion-related distortion. However, CT data, which are used for attenuation correction, produce an image from a fraction in time that is on the order of seconds (13). These spatial misalignments between CT and PET images not only compromise the interpretation of PET images but also result in mislocalization of the lesion and inaccurate quantification of SUV. In fact, attenuation correction factors are calculated on the basis of the corresponding CT transmission images (14). Thereby, the effect of respiratory movement on the quantification of 18F-FDG activity is particularly relevant for small lesions and those in the base of the lungs. Phantom studies suggest that SUV measurements are underestimated by 21%–45% because of respiratory blurring, depending on the lesion size (15).
Semiquantitative evaluation of tumor metabolism with SUV is widely used to assess pulmonary nodules and to quantify tumor response to therapy. But this semiquantitative method has limitations. Different reports show that the threshold to differentiate benign from malignant lesions varies between 2.5 and 5.0, depending on the reconstruction method, filtering parameters, and postinjection scan time (16,17). In addition, it has been shown that the SUV is overestimated in large patients if 18F-FDG uptake is normalized to the weight of the patient (18,19). SUV normalization can be done with the ideal body weight, lean body mass, or body surface area to reduce this effect (20). Other factors, such as the interval after injection, plasma glucose level, and size of the lesion, can also have significant effects on the image (21).
Lesion motion within the lung is another determinant factor. Although this movement is highly variable (5,22), it is greater in the lung bases adjacent to the diaphragm (23) and in the craniocaudal direction (24), with a statistically significant correlation between lesion mobility and lesion localization.
Therefore, respiratory movement may affect the diagnosis (11), and although an SUV of more than 2.5 has been reported to indicate a higher probability of malignancy (25), some authors believe that this cutoff should not be correlated with malignancy in lung lesions and that a new SUV cutoff must be investigated (7).
Some previous studies have shown that respiratory gating, or 4D PET, may significantly improve the accuracy of tumor volume determination and 18F-FDG quantitation in the thorax (7,26–30). However, 4D experience is still limited, and its clinical diagnostic impact has not been completely assessed (31).
Our objective was to evaluate the impact of 4D imaging in the assessment of benign or malignant pulmonary lesions without a previous diagnosis.
MATERIALS AND METHODS
Patients
To establish the added value of PET synchronized with respiratory movement, with respect to conventional PET, we studied 57 lung lesions in 37 patients (26 men and 11 women). The inclusion criteria were lesions without a definitive diagnosis and clinically suggestive of malignancy. Exclusion criteria included incapacity to perform 4D PET due to patient condition or 4D acquisitions with technical problems related to irregular breathing. The mean age of our patients was 66.3 y (range, 41–84 y). Twenty-nine of the 37 patients had a history of neoplasm, colorectal carcinoma being the most common tumor in our sample (8), followed by lung primary tumors (6). The remaining patients had no known history of malignancy.
Lesions
The lung lesions had a maximum diameter of 0.5–4.7 cm (mean ± SD, 1.53 ± 0.88 cm). The size was determined on CT scans (lung window). These lesions were mainly in the upper right lobe (29.8%), upper left lobe (22.8%), and lower right lobe (26.3%). The distribution is shown in Table 1.
Patient Data, Lesion Data, Final Diagnosis, and Imaging Results
Methodology
All patients fasted for at least 4 h before undergoing PET/CT. Glucose levels were lower than 180 mg/dL in all but 4 patients.
PET/CT was performed with a Discovery STE 16 scanner (GE Healthcare). Before PET acquisition, helical CT was performed from the head to the proximal thigh according to a standardized protocol (modulated CT: 30–120 mA, 120 kV, slice thickness of 3 mm, rotation time of 0.5 s). No oral or intravenous contrast agents were used. Emission scans from the head to the proximal thigh were acquired 60 min after the injection of a mean dose of 370 MBq of 18F-FDG. Images were acquired in 3-dimensional (3D) mode, at 3 min per table position.
After completion of the standard 3D acquisition, the study was reconstructed using 2 iterations and 8 subsets and was evaluated on a dedicated workstation (Advantage; GE Healthcare). The suggestive lesions were evaluated (size and location), and thorax-gated 4D PET/CT was performed within 60 min after the standard PET/CT, with the following parameters: 30–120 mA and 120 kV for CT; 12 min for PET.
The gating tool was the Real-Time Position Management Respiratory Gating System (Varian Medical Systems), dividing the respiratory cycle into 6 periods, or bins. In each bin, a PET image and a CT image were acquired. The total scan duration was 12 min (2 min/bin). For the reconstruction, 4D PET was corrected with the helical CT.
Analysis of Lesions
Maximum SUV (SUVmax) was determined for each lesion in both studies. For the gated studies, SUVmax was calculated for each bin. We selected the SUVmax in the bin with the highest uptake (“best bin”) for lesion classification. The average SUVmax over all bins (“average gated”) was also calculated. To compare techniques, we calculated the percentage difference between 3D and 4D studies (best bin and average gated) (% difference = SUVmax 4D – SUVmax 3D/SUVmax 3D × 100). A threshold of 2.5 was selected; therefore, any lesion with an SUVmax of 2.5 or higher was classified as malignant.
Statistical Analysis
Data are expressed as mean ± SD and proportions. Sensitivity, specificity, and positive and negative predictive values were calculated for the diagnosis of malignancy on 3D and 4D images (best bin and average gated) for all groups of lesions. These values were also calculated for lesions greater than 1 cm and then for those greater than or equal to 1.5 cm on 3D and best-bin 4D images. A P value of less than 0.05 was considered to be statistically significant.
A receiver-operating-characteristic (ROC) analysis was performed to establish the best cutoff for the diagnostic test parameters. ROC curves were generated using nonparametric ROC analysis. To compare area under the curve for the 2 tests, a critical ratio z was calculated from the difference of the area under the curve, the SE of the ROC area, and the correlation between 3D and 4D images according to the method of McNeil and Hanley (32).
Mann–Whitney and Kruskal–Wallis tests were used to compare quantitative variables. A P value of less than 0.05 was considered statistically significant. SUVmax percentage difference and lesion diameter were compared by the Spearman test. We correlated the change in SUVmax with lesion diameter and location.
RESULTS
The final diagnosis was confirmed by histologic assessment (19/57 lesions, or 33.3%) or clinical and radiologic follow-up for more than 12 mo (38/57 lesions, or 66.7%). In the final diagnosis, 37 lesions were found to be malignant and the others benign.
Attending to semiquantitative data, 3D, best-bin 4D, and average gated 4D imaging classified 15, 32, and 24 lesions, respectively, as malignant. This assessment was correct for most lesions, although 4D imaging had a greater number of false-positives with respect to 3D (6 for best-bin 4D and 5 for average gated 4D vs. 1 for 3D). Therefore, 3D imaging diagnosed 14 (37.83%) malignant lesions, whereas best-bin and average gated 4D imaging diagnosed 26 (70.3%) and 19 (51.3%), respectively. The rate of false-negatives was greater for the 3D technique (23) than for the best-bin (11) and average gated 4D techniques (18) (Table 1).
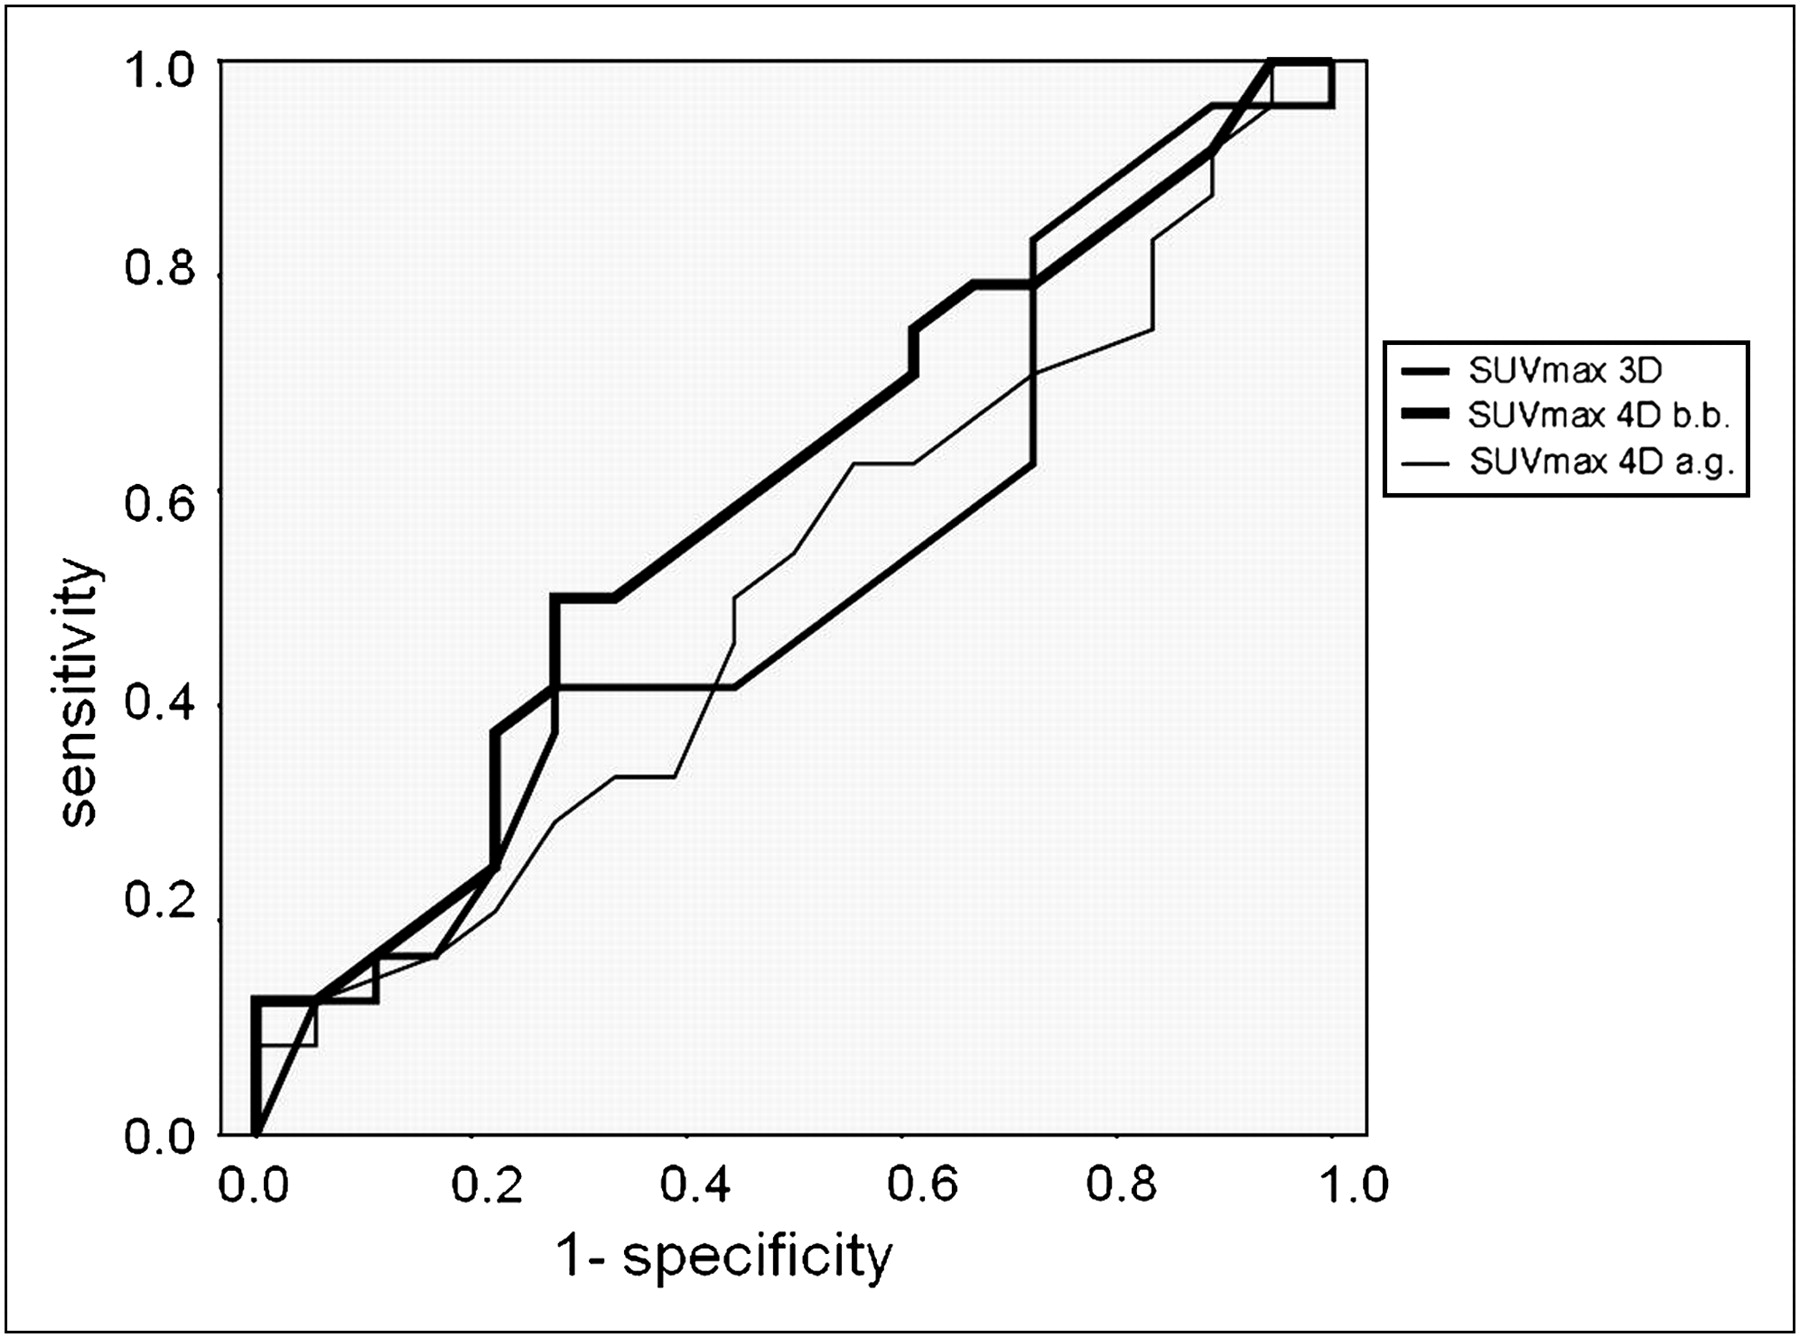
Sensitivity increased and specificity decreased significantly for 4D with respect to 3D imaging, although the diagnostic value did not show significant differences between any techniques (P = 0.7198). In the ROC analysis, the area under the curve was 0.5185 for the 3D study, 0.5938 for the best-bin 4D study, and 0.5093 for the average gated 4D study (Fig. 1). Sensitivity, specificity, positive predictive value, negative predictive value, and accuracy for 3D and best-bin 4D imaging (all lesions, lesions > 1 cm, and lesions ≥ 1.5 cm) and for average gated 4D imaging (all lesions) are shown in Table 2.
Statistical Parameters for the 3 Techniques

ROC curves of 3D and 4D (best bin and average gated) statistical parameters. Area under curve was 0.5185 for 3D, 0.5938 for 4D best bin, and 0.5093 for 4D average gated. 4D best bin showed best value, with no statistically significant differences from the other techniques. a.g. = average gated; b.b. = best bin.
In the best-bin and average gated 4D images, 54 of 57 and 46 of 57 lesions, respectively, showed an increase in SUVmax with respect to the 3D study. In 41 of the 54 lesions on best-bin 4D imaging, the greater increase in SUV was observed during the expiratory phase.
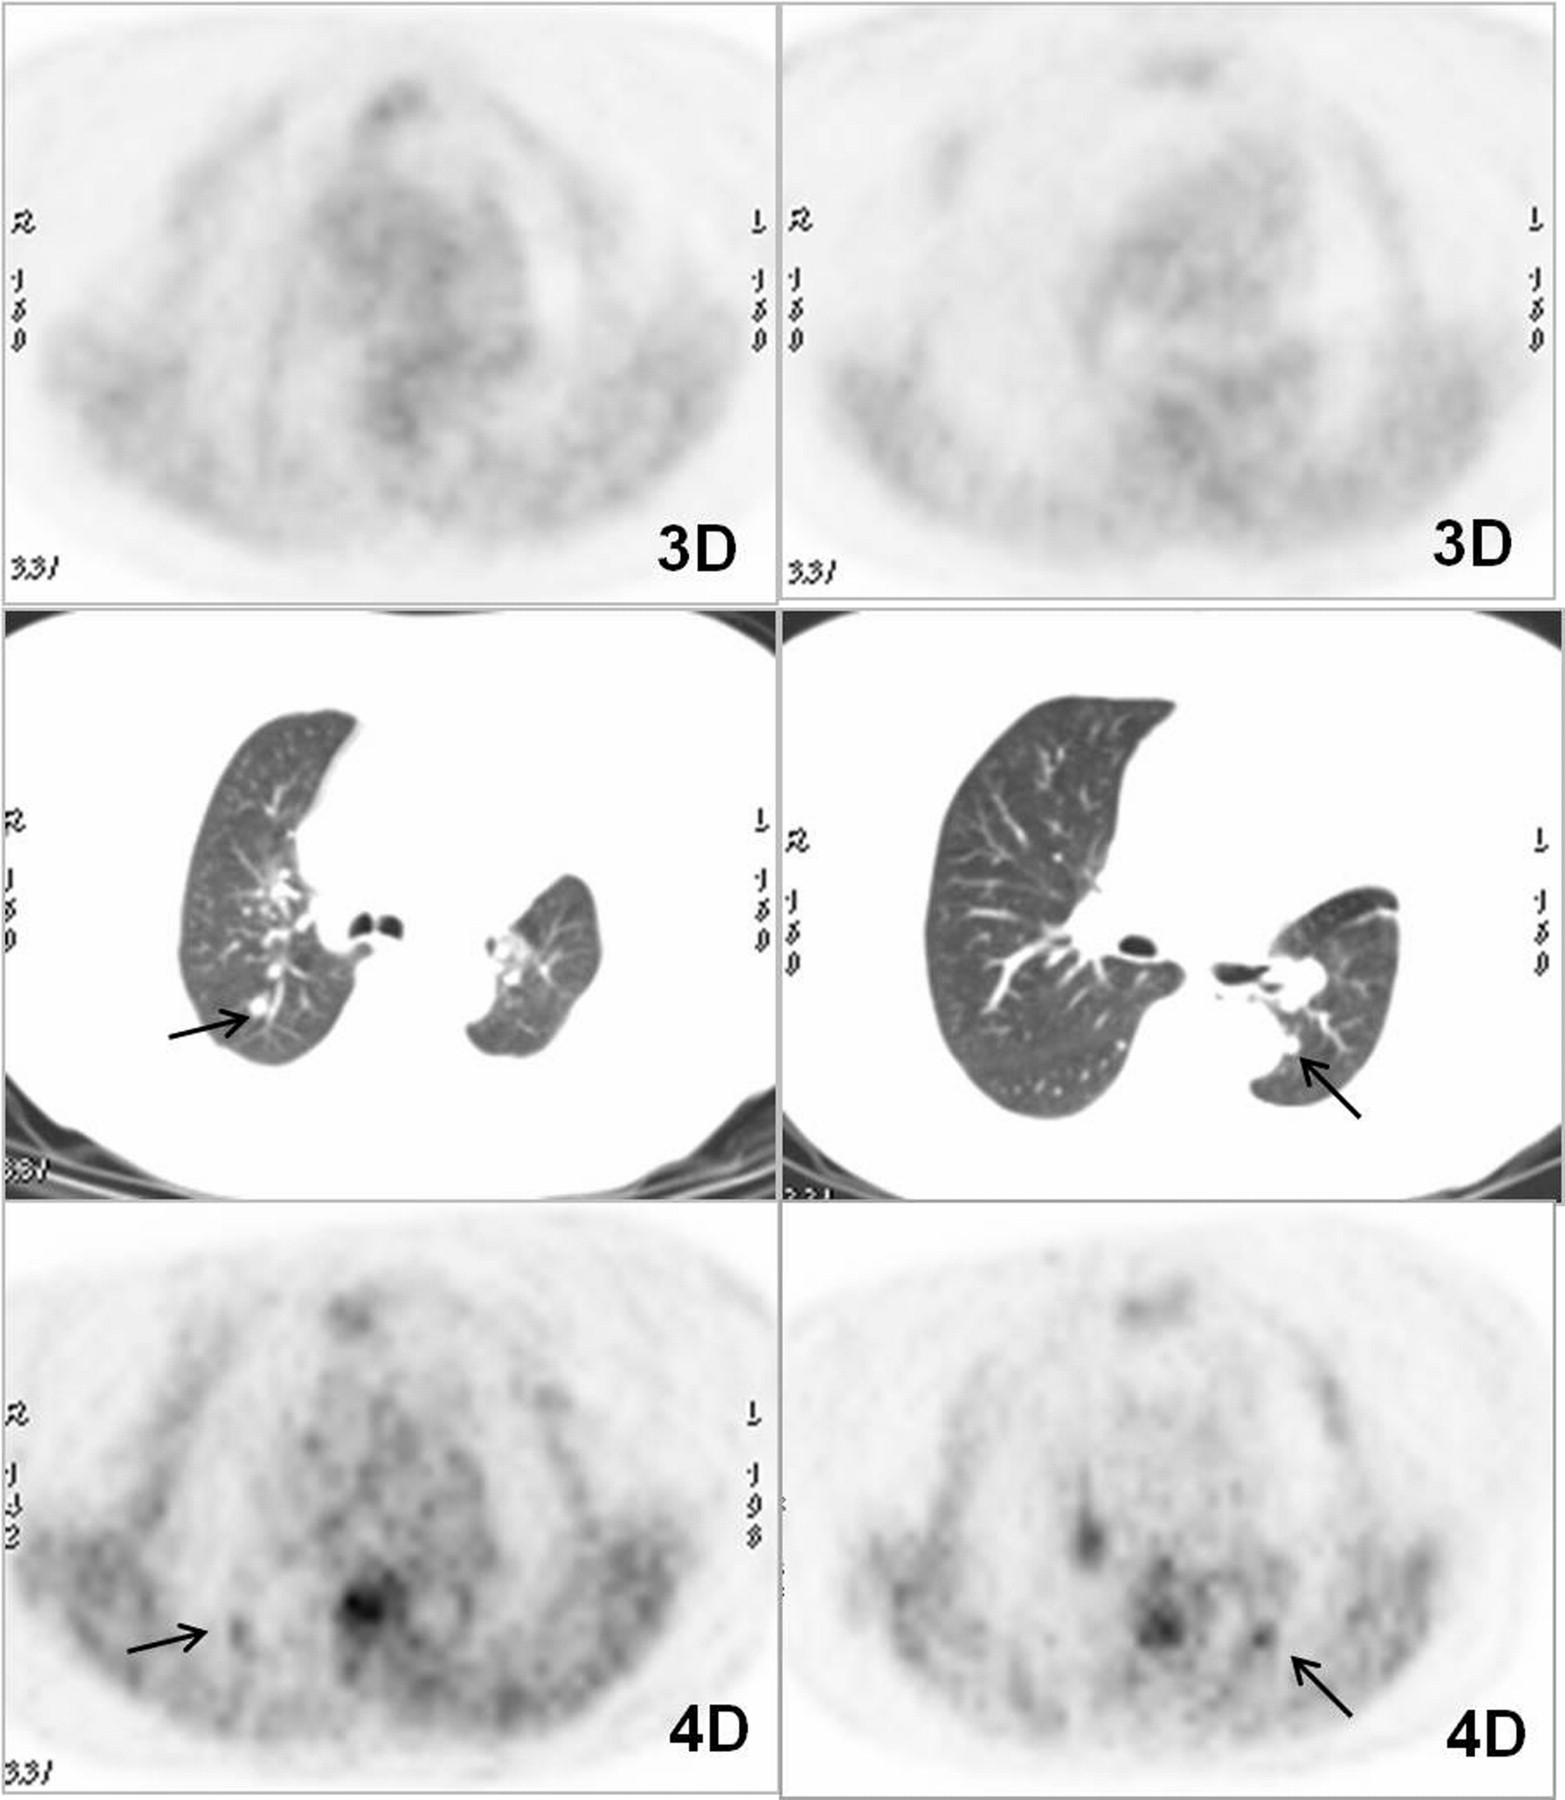
One lesion was not detected on 3D imaging and showed metabolism in the best-bin 4D study (Fig. 2). Two lesions did not show any SUV variation, and another showed a decreased 18F-FDG uptake on best-bin 4D imaging with respect to 3D imaging (−3.3%). On average gated 4D imaging, 8 lesions did not show any increase in the semiquantitative parameters compared with 3D imaging, and 3 showed a decrease. Most of the smaller lesions were better defined in the 4D studies because of higher lesion contrast with respect to background lung activity (Fig. 3).
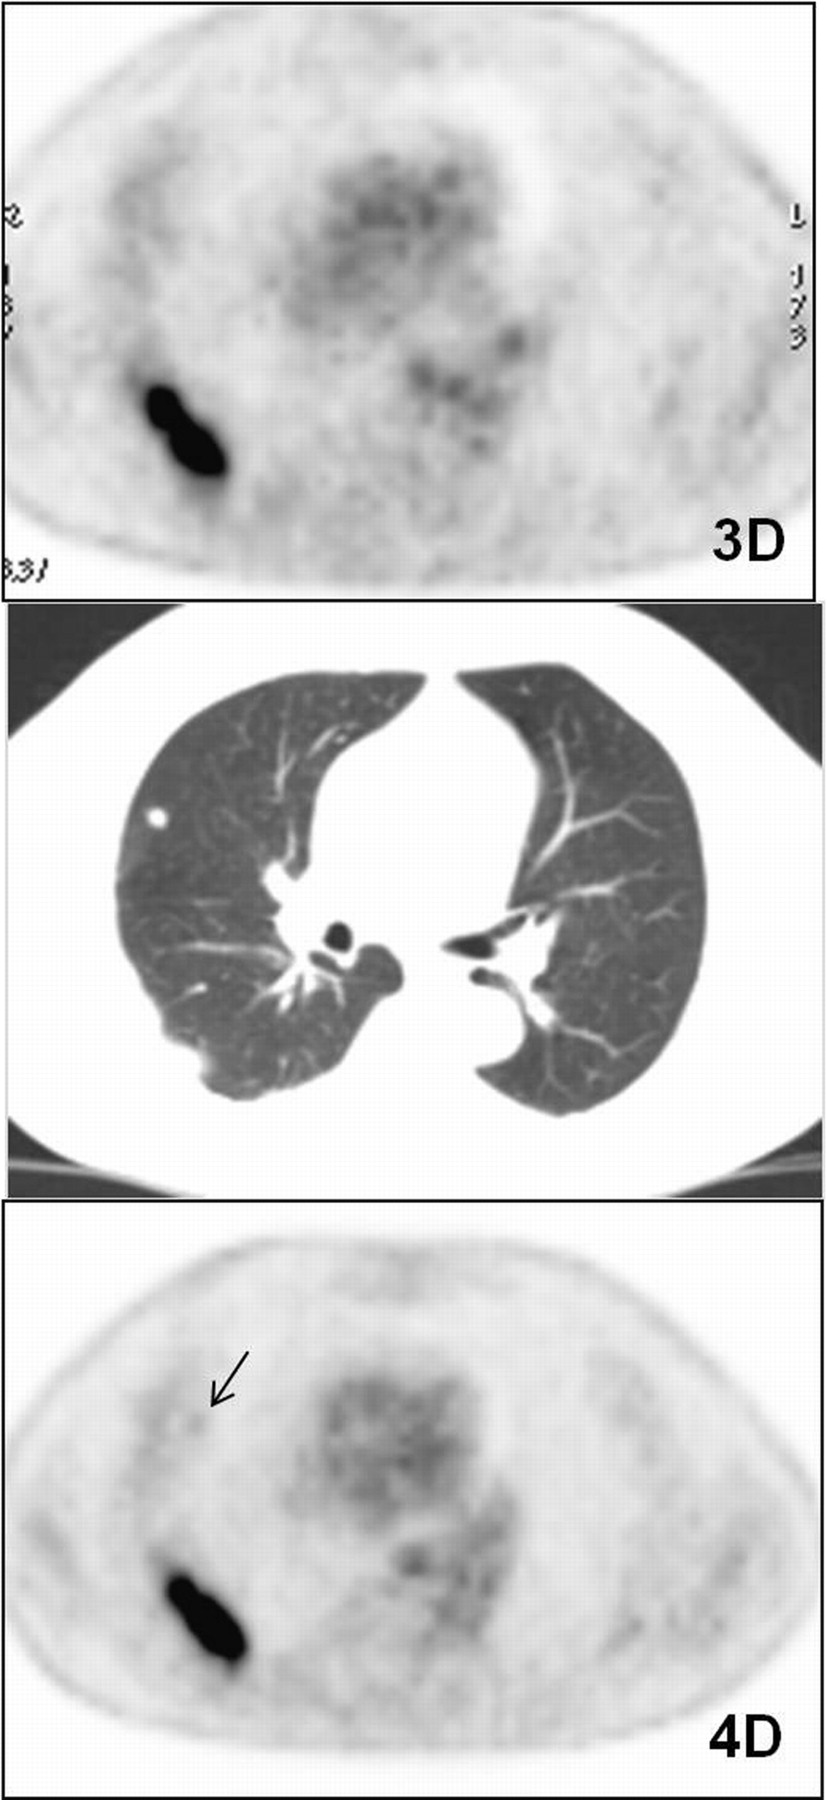
Example of lesion that cannot be visualized on 3D axial image but is detectable on 4D best-bin axial image. Study is of patient 11, who had small cell lung cancer with 2 pulmonary lesions. CT image (center) shows one lesion in right lower lobe (maximum diameter, 4 cm) and another in right upper lobe (8 mm). Larger lesion has high avidity for 18F-FDG (SUVmax in 3D and in best bin of 4D, 8.4 and 11.1, respectively), whereas smaller lesion (arrow) is detectable only in 4D study (SUVmax, 1.1).

Example of higher lesion contrast with respect to background lung activity in 4D study than in 3D study in patient with 2 pulmonary lesions smaller than 1 cm. Study is of patient 26, who had history of treated non–small cell lung cancer. CT images (center) show one lesion in right upper lobe (maximum diameter, 8 mm) and another in left lower lobe (8 mm). Both (arrows) show faint uptake on 3D axial images (SUVmax, 0.8 and 1.4, respectively) that improves in best-bin 4D images (SUVmax, 1.9 and 2.9, respectively).
The mean SUVmax in the 3D and the best-bin and average gated 4D studies was 3.1 ± 4.5, 4.5 ± 5.6, and 3.9 ± 4.8, respectively. The mean SUVmax percentage difference between 3D and best-bin 4D studies was 72.9% ± 73.2%, and the range was −3.3% to 360%. Between the 3D and average gated 4D studies, the mean SUVmax percentage difference was 48.8% ± 69.6%, and the range was −27.8% to 360%.
After ROC analysis, an SUVmax of 1.45 was shown to be the best diagnostic parameter of sensitivity and specificity for the 3D studies (63% and 69%, respectively). In the best-bin 4D studies, this value was 2.45 (68% sensitivity and 69% specificity), and in the average gated 4D studies, a cutoff of 1.45 showed a sensitivity of 71% but a low specificity (28%).
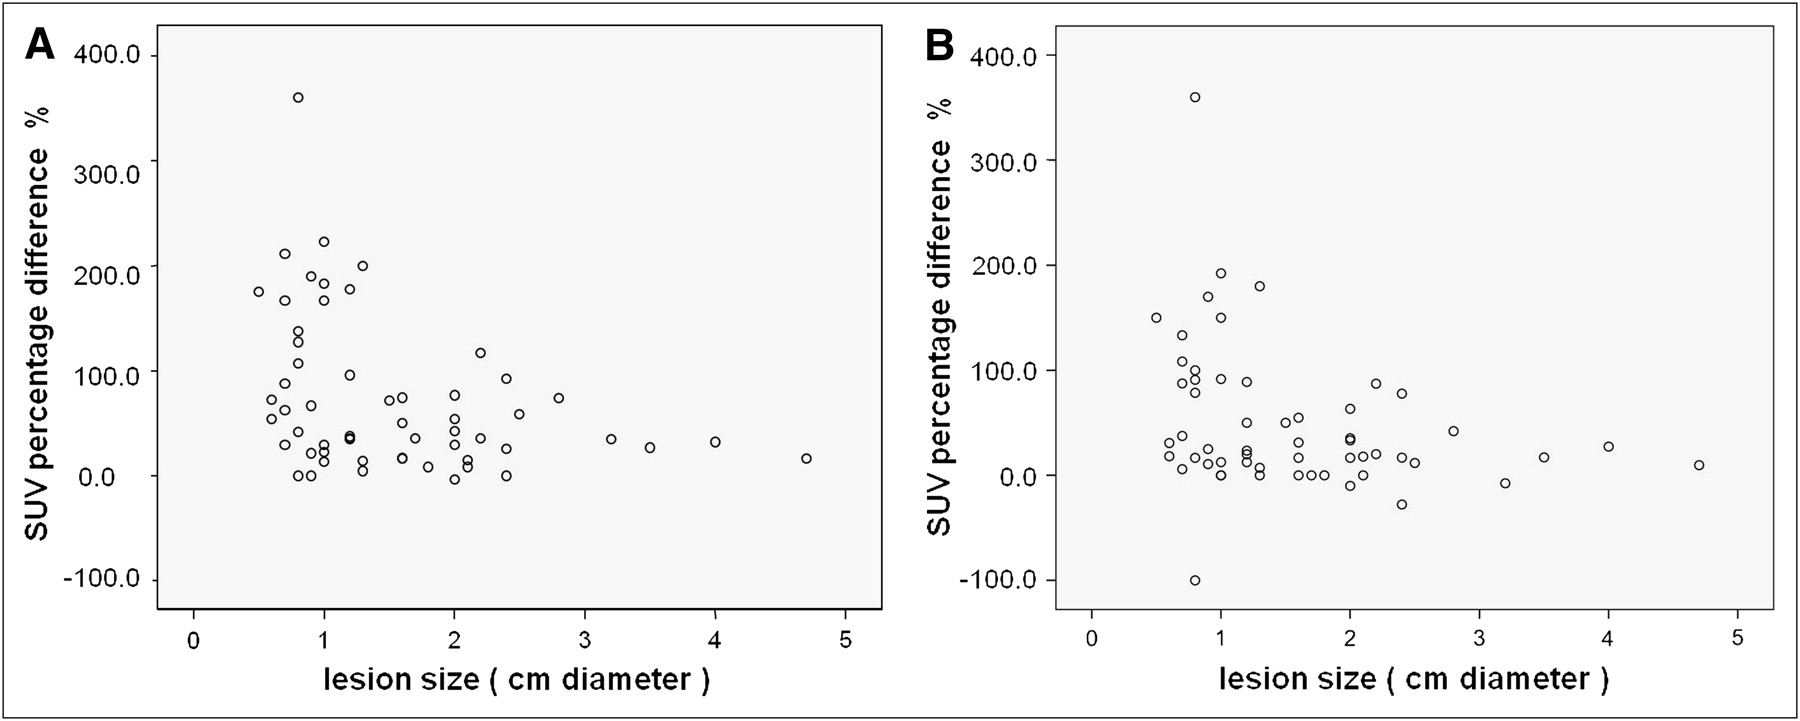
Regarding the correlation between the SUVmax percentage difference with other parameters, we observed a statistically significant (P < 0.05) higher increase in SUVmax for smaller lesions with respect to larger ones. This correlation is represented in Figure 4. No statistically significant differences dependent on lesion location were observed, but the right lung showed higher SUV increases in 4D studies (best bin and average gated) with respect to the left lung. Detailed data are shown in Table 3.

Correlation between lesion size and SUVmax percentage difference between 3D and best-bin 4D studies (A) and between 3D and average gated 4D studies (B). Both graphs show statistically significant (P < 0.05) higher increase in SUVmax in smaller lesions than in larger ones.
SUVmax Data with Reference to Lesion Location
DISCUSSION
Experience with 4D PET is still limited to few centers and small groups of patients. Nevertheless, results on the increase in SUV, the improvement in coregistration, and the reduction in lesion volume are encouraging (27). Some studies have used 4D acquisition exclusively in CT (cine CT) and have observed increases in SUV of up to 50% (26,28,29). Erdi et al. (26) examined PET/CT images of 5 patients with lung carcinoma and multiple lung lesions. CT images were acquired in cine mode and divided into 10 phases. Examination of all phases showed an SUV variation of up to 30%. Using 4D PET, the increase of SUVs is variable and ranges widely but is statistically significant. Our results show a mean increase of 73% for SUVmax between 3D and best-bin 4D studies, with a range of −3.3% to 360%, similar to the results of Lupi et al. (30).
Regarding how the respiratory phase influences quantitative parameters, we found that most lesions (76%) showed the highest SUVmax during the expiratory phase. This condition, demonstrated also in other works (10,26), is explained by the low motion of lesions during this phase.
Some authors have found that the effect of gating may depend on lesion size and intrapulmonary site, which corresponds to different motion amplitudes (7). Pevsner et al. (6) found that the range of SUV fluctuation for a given motion amplitude was inversely proportional to lesion size. We found a statistically significant correlation between SUVmax percentage difference and lesion diameter (Fig. 4). A greater increase of SUVmax was observed in smaller lesions, with respect to larger ones. These results are explained by the greater adverse effect of respiratory movement on lesions smaller than 1.5 cm than on larger ones. Therefore, although motion amplitude was not assessed in our study, this correlation indirectly reflects the greater detriment of respiratory movement in smaller lesions.
In relation to the semiquantitative assessment, other authors have remarked that a new SUV cutoff should be reconsidered for lung cancer when gating is used (7). We did not modify this threshold because we considered that the ideal cutoff of 2.5 was created under optimal conditions, without the disadvantages of partial-volume effect and respiratory movement, whereas lung lesions, especially the smaller ones, are studied under suboptimal conditions due to respiratory movement. Attending to our results, ROC analysis showed that a cutoff of 2.45 in best-bin 4D studies had the best sensitivity and specificity (68% and 69%, respectively).
One main effect of respiratory motion is the decrease in concentration per pixel within the lesion—a decrease sometimes exceeding 50% of maximum activity (12). Therefore, the problem of respiratory movement has such relevance that it may determine the therapeutic management of a patient. Any metabolic activity in a nodule of approximately 1 cm or less, even if the activity does not exceed the reference threshold, may indicate malignancy. Our ROC analysis showed that the best diagnostic SUVmax for sensitivity and specificity in the 3D study (63% and 69%, respectively) was 1.45.
According to some authors, the likelihood of malignancy in any metabolically detectable lesion is 60%, which agrees with the prevalence (66.67%) that we found (4,33). Therefore, the absence of metabolic activity in a nodule, especially if it is smaller than 1 cm, cannot rule out malignancy, and radiologic follow-up should be recommended (27).
Nehmeh et al. (27) reported in their conclusions that 4D PET/CT acquisition should improve the confidence of PET/CT diagnosis, especially in lung cancer screening of small nodules. However, the clinical diagnostic impact of 4D studies has not been determined yet, particularly because all previous studies were performed on patients with known lung malignancies. In a preliminary assessment of 18 lesions, 4D studies reduced the false-negative rate by 50% when compared with the 3D technique but at the expense of an increase in the false-positive rate to 11% (31).
Above all, this study introduced an important factor with respect to the previous studies. Although most of our patients had a history of neoplasm, the objective of 4D PET was the diagnostic assessment of suggestive lesions. Among all lesions, best-bin 4D studies increased the sensitivity significantly (from 38% to 70%) although specificity decreased (from 95% to 70%), and accuracy was higher for best-bin 4D studies with respect to 3D (70% vs. 58%). In contrast, the global parameters assessed by ROC curves did not show statistically significant differences. In our opinion, more important than the decrease in specificity is the increase in sensitivity, because it enables a recommendation that lesions suggestive on 4D PET be followed up closely or biopsied to establish an earlier diagnosis of malignancy, but these results should be verified in a larger sample of lesions.
Our study had some limitations. The delay of acquisition of the 4D study could contribute to the SUV parameters obtained. But we do not believe this delay was the main cause of the observed SUV increase, taking into account the short acquisition time in each bin (2 min) of the 4D acquisitions with respect to the 3D acquisition (3 min/bed position). On the other hand, the effect of double-phase or dual-time-point PET/CT has not been fully assessed. Therefore, determining the diagnostic impact of both techniques on the same group of patients would clear these doubts and enable comparison of the 2 available techniques to improve lesion detection.
Another controversial aspect is lesion classification using a semiquantitative approach. Despite the assumption that the best bin is defined by its lowest motion, statistical noise is also a factor, particularly when SUVmax is used. In theory, delayed gated acquisition should lead to improved contrast between lesion and background, but the delay additionally causes a reduced rate of true coincidences due to radioactive decay. Furthermore, the shorter acquisition time of 4D studies (2 min) increases the statistical noise in each bin. To reduce this effect, an average SUVmax was obtained, but the derived diagnostic parameters of this procedure did not show significant differences from standard 3D acquisition (Fig. 1).
With respect to attenuation correction, we were aware that helical CT could limit the accuracy of the corrected images and, therefore, influence the results. The combined synchronization technique offers more accurate quantification than separate synchronization because of the greater coincidence in each respiratory phase. Therefore, tumor images and intralesional SUVs are more correct, as has been demonstrated by Nehmeh et al. (27) and Hamill et al. (12). Furthermore, the number of lesions histologically studied was limited, but many lesions were smaller than 1.5 cm. The fact that some patients had multiple lesions and that most patients had a history of neoplasm makes us consider clinical follow-up to be the most ethical option and, in the opinion of oncologists, enough to assess the probable diagnosis.
The limited sensitivity of PET in small lesions has been previously documented (70% for lesions < 2 cm) (3,4) and was observed by us using a cutoff of 2.5. When lesions 1 cm or smaller were excluded (42% of our sample), sensitivity increased from 37.8% to 52.2%, and when we assessed only lesions 1.5 cm or larger (25/57 lesions), sensitivity increased even more, reaching a value (68.4%) similar to that reported in the literature. However, this sensitivity is not quite sufficient for diagnostic purposes: there is an inherent limitation in the detection of small lesions, and in our study more than half the lesions were smaller than 1.5 cm. This fact and our different criteria for selecting patients could be the reasons for the reduced sensitivity with respect to other works. A possible solution would be the normalization or correction of SUVs according to tumor size (34), although this procedure has not previously been shown to significantly improve diagnosis (6,39). Other works have calculated the recovery coefficient in phantoms with spheres of different sizes (6,36). Although the calculation depends on the resolution and reconstruction parameters, among other factors, Soret et al. (36) found that for a system with a spatial resolution of 6 mm (similar to our PET system), the recovery coefficient was 3.7 for 1-cm-diameter lesions and greater than 2.5 for 1.5-cm lesions. The application of this approach in our 11 false-negative lesions in best-bin 4D PET correctly classified all as malignant although erroneously classifying all but one benign lesion as malignant, increasing the number of false-positives from 6 to 19. Therefore, methods of correcting partial-volume effect are not a perfect solution, because other factors such as tumor density, 18F-FDG avidity, and background activity play a role in semiquantitative parameters.
Therefore, the main limitation of standard PET/CT continues to be the study of small lung nodules, with an error rate possibly exceeding 50% in the diagnosis of subcentimeter lesions, and at the expense of false-negative results (37). In the present work, 4D studies showed a lower rate of false-negatives than standard acquisition (11 vs. 23). Therefore, 4D studies offer more efficient identification, as Lupi et al. (30) concluded in their publication, and may be recommended to improve the detection of these lesions. On the other hand, 4D studies detected more false-positive lesions, a factor that must be considered although we believed the best parameter to be the increased sensitivity, which improved the correct classification of malignant lesions.
CONCLUSION
The acquisition of 18F-FDG PET/CT scans in 4 dimensions increases the sensitivity of lesion detection from a metabolic point of view. To our knowledge, this work is the first reported assessment of the diagnostic impact of this technique, showing it to have higher diagnostic accuracy than standard acquisition. If this finding is confirmed in future studies, 4D PET/CT acquisitions should be recommended for the screening of small lung lesions to improve diagnostic confidence.
REFERENCES
- Received for publication August 27, 2010.
- Accepted for publication March 8, 2011.


