


Abstract
The choice of injected dose of 18F-FDG and acquisition time is important in obtaining consistently high-quality PET images. The aim of this study was to determine the optimal acquisition protocols based on patient weight for 3-dimensional lutetium oxyorthosilicate PET/CT. Methods: This study was a retrospective analysis of 76 patients ranging from 29 to 101 kg who were injected with 228–395.2 MBq of 18F-FDG for PET imaging. The study population was divided into 4 weight-based groups: less than 45 kg (group 1), 45–59 kg (group 2), 60–74 kg (group 3), and 75 kg or more (group 4). We measured the true coincidence rate, random coincidence rate, noise-equivalent counting rate (NECR), and random fraction and evaluated image quality by the coefficient of variance (COV) in the largest liver slices. Results: The true coincidence rate, random coincidence rate, and NECR significantly increased with increasing injected dose per kilogram (r = 0.91, 0.83, and 0.90; all P < 0.01). NECR maximized at 10.11 MB/kg in underweight patients. The true coincidence rate differed significantly among the 4 groups, except for group 3 versus group 4 (P < 0.01). The ratio of the true coincidence rate for group 2 to groups 3 and 4 was 1.4 and 1.6, respectively. The average random fraction for all 4 groups was approximately 35%. The COV of the 4 groups differed for all pairs (P < 0.01). The COVs in overweight patients were larger than those in underweight patients, and image quality in overweight patients was poor. Conclusion: We modified acquisition protocols for 18F-FDG PET/CT according to the characteristics of a 3-dimensional lutetium orthosilicate PET scanner and PET image quality based on patient weight. The optimal acquisition time was approximately 1.4–1.6 times longer in overweight patients than in normal-weight patients. Estimation of optimal acquisition times using the true coincidence rate is more important than other variables in improving PET image quality.
Whole-body PET using 18F-FDG is a valuable molecular imaging modality in the clinical management of patients with cancer (1). The synthesis of 18F-FDG requires an on-site cyclotron and chemistry laboratory, but like radiopharmaceuticals labeled with 123I, 201Tl, and 67Ga, 18F-FDG is also now available from commercial suppliers in most regions of Japan. However, when 18F-FDG is purchased commercially, it is difficult to increase or decrease the injected dose according to the weight of the patients, and the radioactivity for 18F-FDG administration is a constant quantity. In underweight patients therefore, the result is an increase in the relative radiation dose, whereas in overweight patients there is an increase in statistical noise because of the low relative injected dose, and PET image quality may be poor (2–4). Therefore, associating the injected dose of 18F-FDG per kilogram of patient weight with the best acquisition time is important in obtaining high-quality PET images. The standard injected dose of 18F-FDG using a PET scanner with bismuth germinate crystals is 2.0–5.0 MBq/kg according to the guidelines of the Japanese Society of Nuclear Medicine. However, the administered activity of the radiopharmaceutical may vary for other systems and acquisition protocols (5).
In current PET/CT systems, the high light output and fast decay time of lutetium oxyorthosilicate (LSO) detectors, compared with bismuth germinate detectors, reduce system dead time and improve counting rate performance, resulting in particularly high activity levels in the field of view (6,7). These features allow whole-body scans to be acquired in 3-dimensional (3D) mode rather than 2-dimensional mode, thereby greatly enhancing the sensitivity of the PET scanner (7). However, true and random counting rates and noise-equivalent counting rate (NECR), which affect PET image quality, are not universal functions for specific scanners, injected doses of 18F-FDG, or patient weights (8). Furthermore, high photon attenuation and scatter in obese patients affect image quality. Thus, the aim of this study was to optimize 3D LSO 18F-FDG PET/CT acquisition protocols for patient weight by measuring true counting rate, random counting rate, and NECR in clinical scanning.
MATERIALS AND METHODS
Study Population
This was a retrospective analysis of 76 patients (mean age, 63.3 ± 11.6 y) who underwent clinical 18F-FDG PET/CT. The patients were evaluated for lung cancer (n = 15), malignant lymphoma (n = 14), cancer screening (n = 13), head and neck cancer (n = 10), breast cancer (n = 8), colorectal cancer (n = 7), esophageal cancer (n = 2), pancreatic cancer (n = 2), ovarian cancer (n = 2), an unknown primary tumor (n = 2), and thyroid cancer (n = 1). The patients for this study were selected from our 18F-FDG PET/CT database. Patients with liver metastases or with hyperglycemia at the time of 18F-FDG injection were excluded.
The patients had an average weight of 55.6 ± 17.5 kg (range, 29–101 kg), and their height averaged 158.4 ± 9.4 cm (range, 135.7–177.5 cm). The study population was divided into 4 groups based on weight: group 1, less than 45 kg (average, 38.6 ± 4.1 kg, n = 27); group 2, 45–59 kg (average, 52.1 ± 4.6 kg, n = 22); group 3, 60–74 kg (average, 67.5 ± 5.2 kg, n = 15); and group 4, 75 kg or more (average, 85.6 ± 7.8 kg, n = 12).
This study was performed with the approval of the institutional review board, and written informed consent was obtained from all patients before PET/CT examination.
Image Acquisition
Images ware obtained with an LSO PET/CT scanner that combines a 16-multislice CT scanner (Aquiduo PCA-7000B; Toshiba Medical Systems) with a high-resolution PET scanner (HI-REZ system; CPS Innovations) coupled to PICO-3D detector electronics (CPS Innovations) (9). The PET images were acquired in 3D mode only. All patients fasted at least 4 h before undergoing PET/CT. After their blood sugar had been checked (average, 103.4 ± 12.9 mg/dL), patients received an intravenous injection of 18F-FDG (FDGSCAN; Nihon Medi-Physics) using an automatic injector (UG-01; Universal Giken) and then rested quietly in bed for approximately 60 min. The injected activity of 18F-FDG ranged from 228 to 395.2 MBq (average, 339.0 ± 38.7 MBq). The injected doses of 18F-FDG per kilogram of patient weight were as follows: group 1, 9.0 ± 1.7 MBq/kg; group 2, 6.6 ± 1.0 MBq/kg; group 3, 4.8 ± 0.7 MBq/kg; and group 4, 4.0 ± 0.5 MBq/kg.
All patients were placed supine, with the arms down, on the imaging table. PET/CT examinations began with the acquisition of a scout scan. After the coaxial imaging range had been defined as being from the skull to the mid thigh, diagnostic-quality CT images were obtained using the following parameters: 120 kVp, automatic exposure control depending on body habitus, 0.5-s rotation, 2-mm slice thickness, and a table feed of 30 mm per rotation. CT was performed during expiratory breath-hold to minimize attenuation artifacts, and high-quality lung images were obtained. We used an automatic exposure control in CT with tube current modulation to achieve a constant level of image quality that used the SD of the CT number. After the CT scan, PET images were acquired for 120 s per bed position. Eighty-one slices with a slice thickness of 2 mm were obtained for each bed position. PET images were acquired at multiple bed positions over the same range as for the CT scan during shallow breathing. PET images were reconstructed into a 128 × 128 matrix with 1.34 zooming, using interactive algorithms (ordered-subset expectation maximization, 4 iterations, 14 subsets) and the CT-based attenuation correction, and noise was reduced by smoothing the images with a gaussian filter of 8 mm in full width at half maximum.
Data Analysis
The prompt and random coincidence rates were obtained as the sinogram data of the bed position that covered the liver in the whole-body scan. The measure used to evaluate the performance of the PET scanner was T = P – S – R, where T is the true coincidence rate, P is the prompt coincidence rate, S is the scattered coincidence rate, and R is the random coincidence rate. The optimized injected dose per kilogram was estimated as NECR by T2/(T + S + kR), where k = 2 (noise random correction factor). Because the prompt and random data were selected from sinogram data, we chose to neglect the scattered coincidence rate (8). The random fraction was calculated as R/P × 100.
Image Analysis
Quantitative analysis of image quality was performed using the coefficient of variance (COV) in the region of interest (ROI), defined as a circular region 15.2 cm2 in diameter over the largest liver section on transverse PET slices. The ROI was placed and measured by an experienced, certified nuclear medicine technologist. In general, PET image quality was evaluated for smoothness of the liver. Percentage COV was calculated as the SD of the ROI counts divided by the mean count of the ROI, multiplied by 100.
Statistical Analysis
The relationships between injected dose per kilogram, T, S, and random fraction were evaluated by linear regression analysis and Pearson product-moment correlation coefficient. Multiple comparisons of the 4 groups for T and COV were performed by the Scheffé F test. In all analyses, P < 0.01 was considered to indicate statistical significance.
RESULTS
Clinical Characteristics of PET Scanner
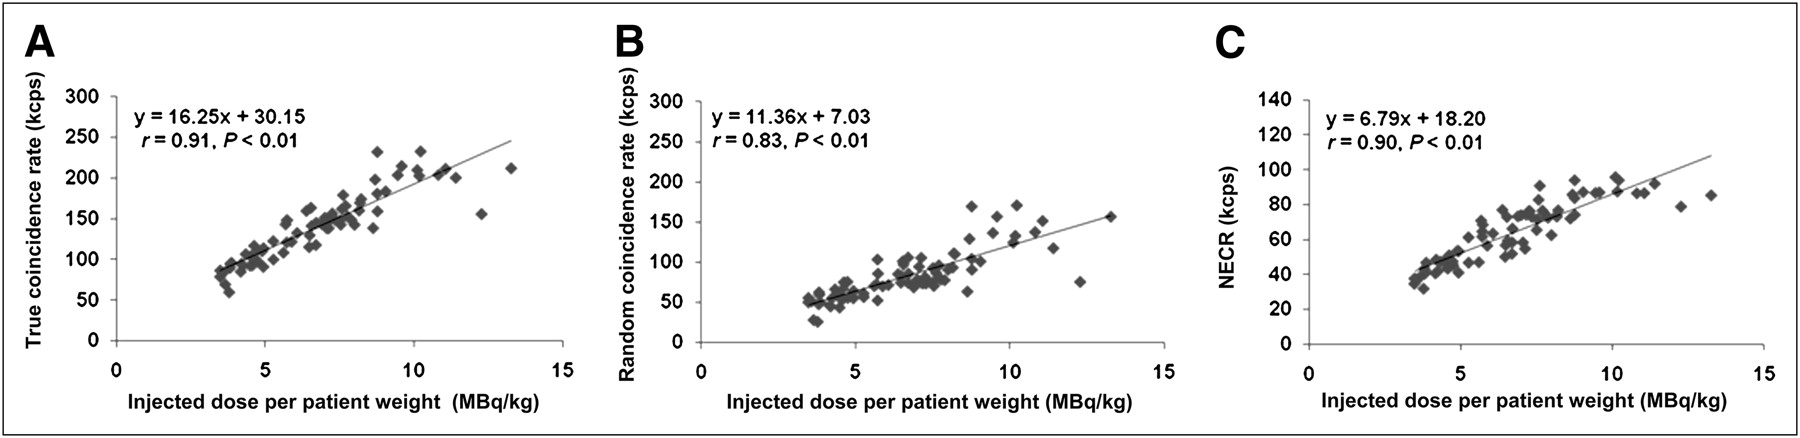
The true coincidence rate and random coincidence rate increased significantly with increasing injected dose per kilogram (r = 0.91, P < 0.01, and r = 0.83, P < 0.01, respectively; Figs. 1A and 1B). NECR increased significantly with increasing injected dose per kilogram (r = 0.90, P < 0.01), but NECR achieved its maximum of 95.69 cps at 10.11 MBq/kg, and increasing the dose did not affect NECR (Fig. 1C).

Plots of true coincidence rate (A), random coincidence rate (B), and NECR (C) vs. injected dose per patient weight for 76 patient scans. True coincidence rate, random coincidence rate, and NECR significantly increased with increasing injected dose. NECR maximized at 10.11 MB/kg.
Relationship Between True Coincidence Rate and Image Quality
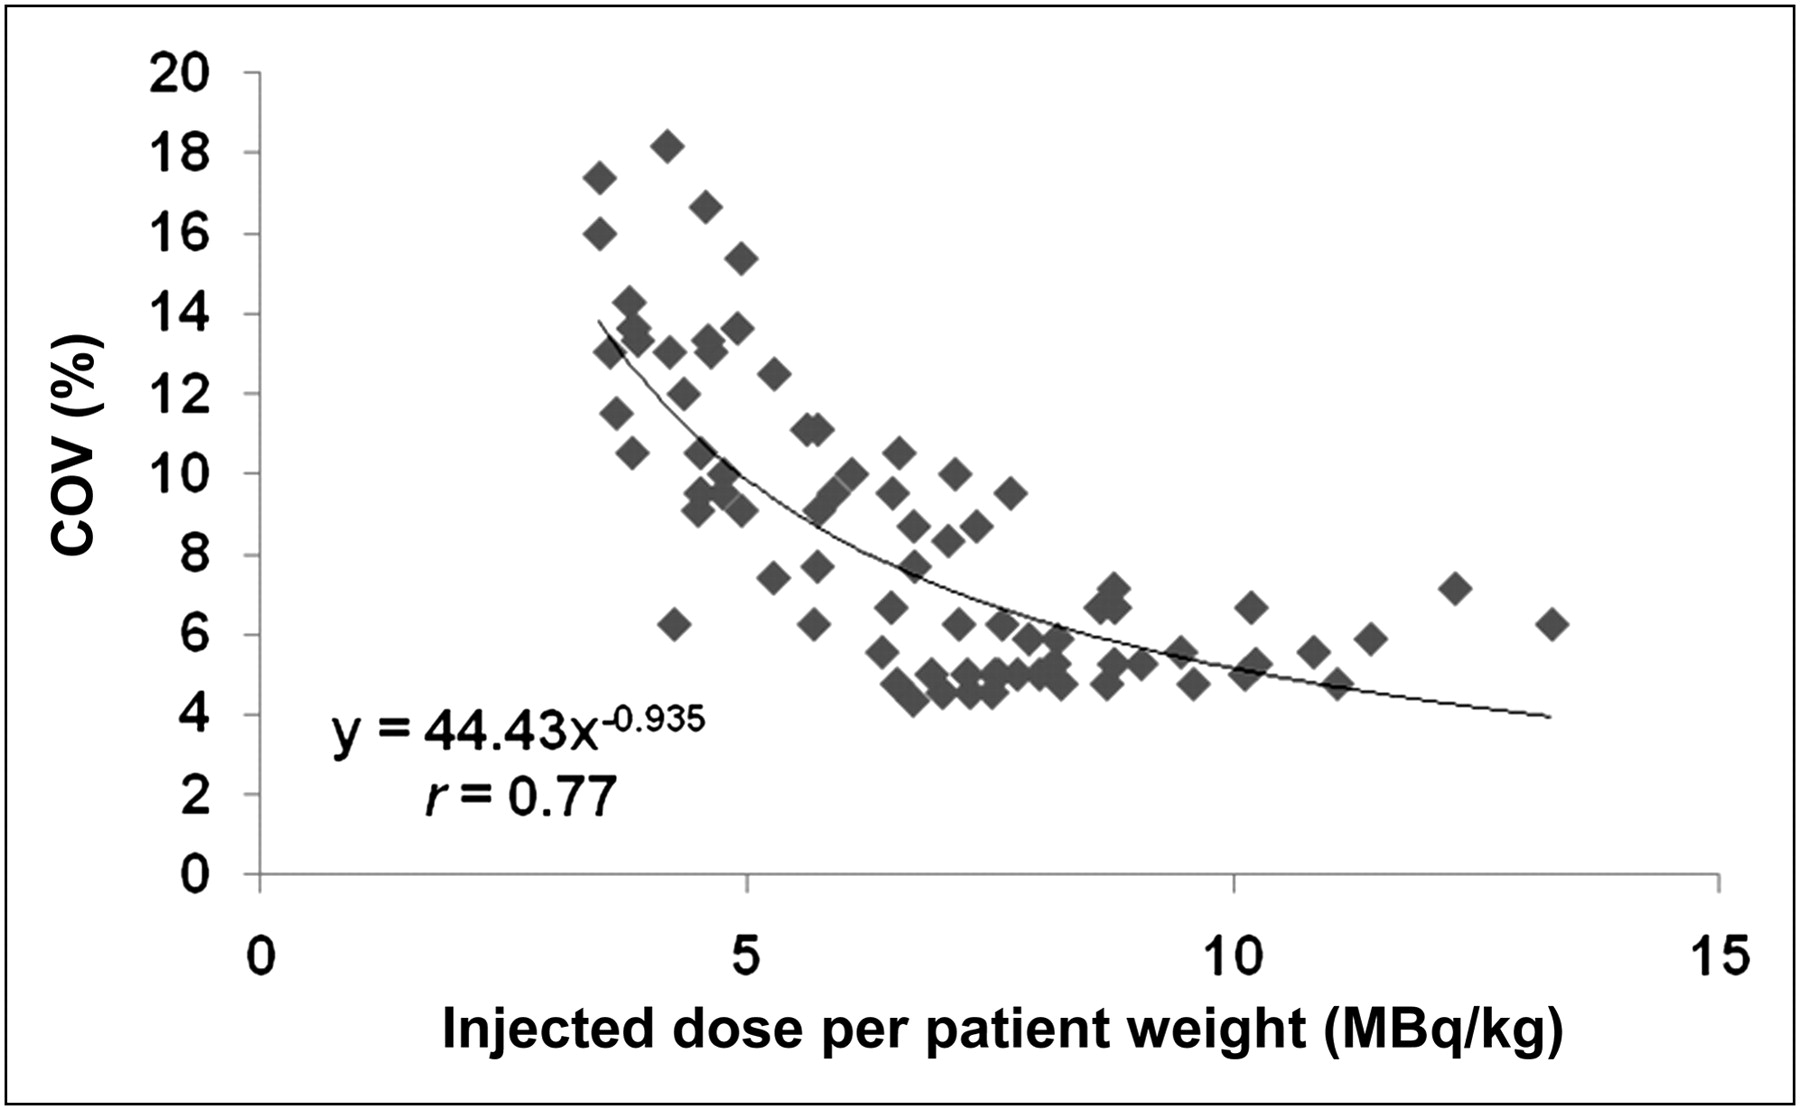
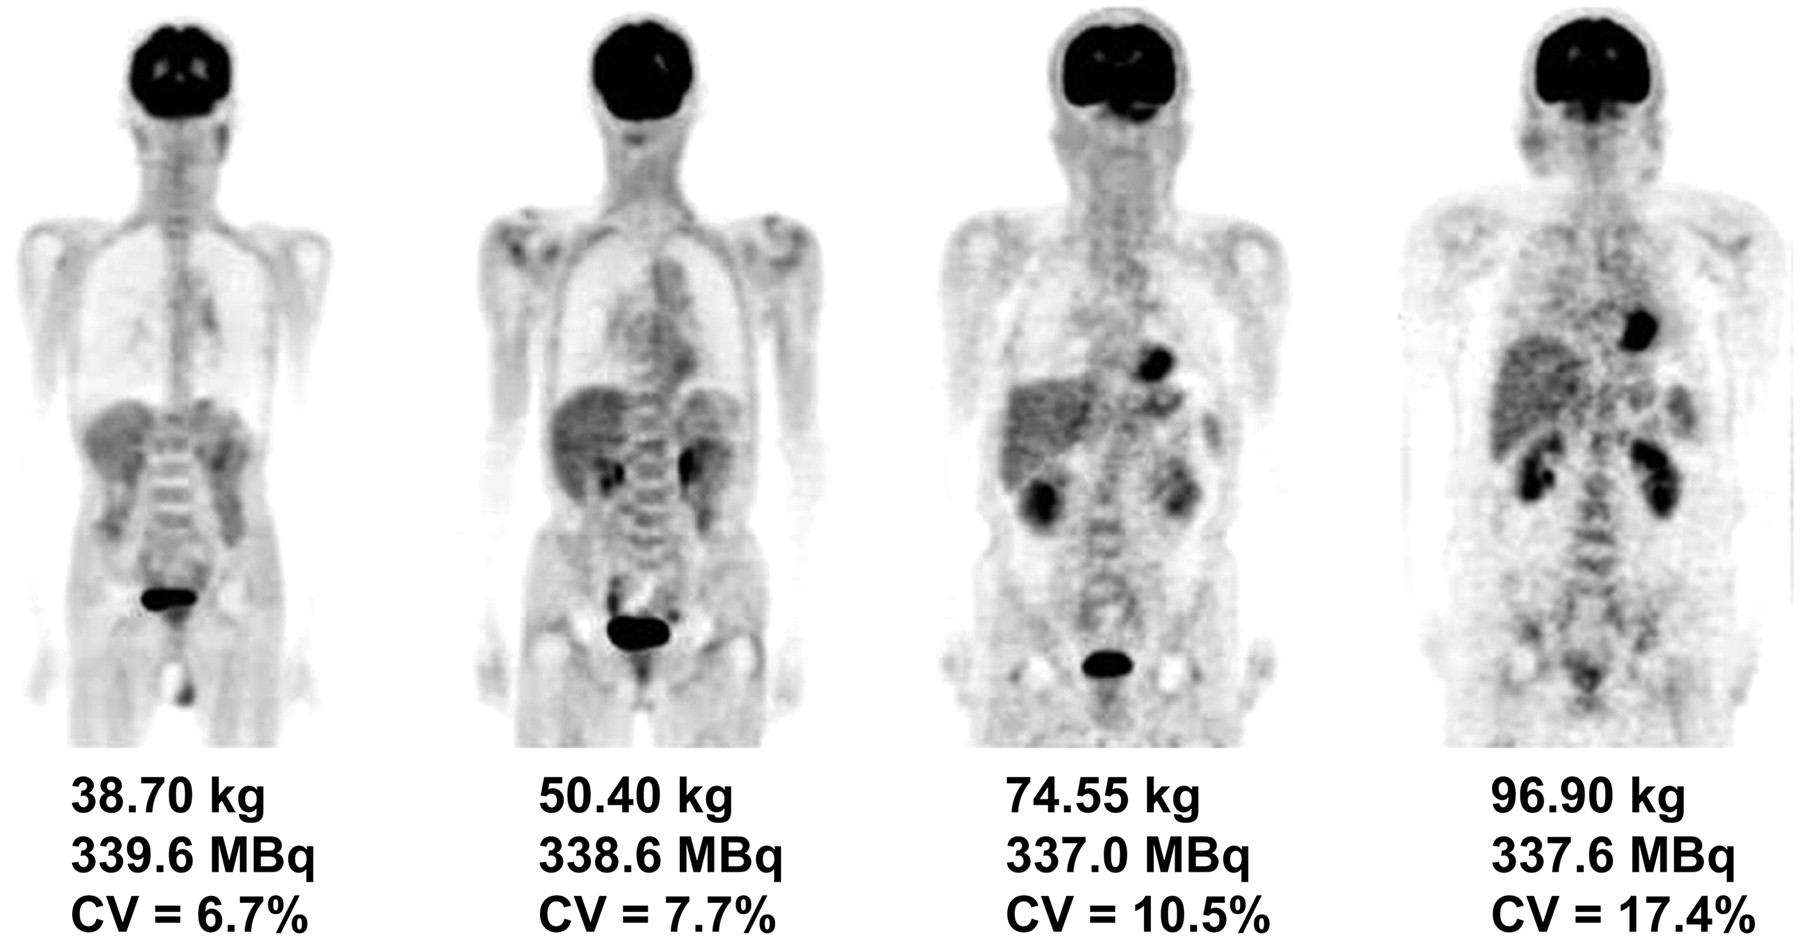
An increase in the injected dose per kilogram was associated with an improvement in image quality. At lower injected doses, the COV of PET images showed a steep decline. Higher COVs of 10% or more were observed at injected doses lower than 4–5 MBq/kg (Fig. 2). Figure 3 illustrates a representative scan for each weight group.

Plots of COV vs. injected dose per patient weight. At lower injected dose, COV of PET images shows steep decline.

Image quality of approximately same injected dose of 18F-FDG in patients of different body weights. PET images of underweight patients had lower COV and excellent quality. In contrast, PET images of overweight patients were noisy and of poor quality.
The true coincidence rate decreased with increasing patient weight: group 1 had an average of 177.80 ± 30.60 cps; group 2, 142.28 ± 19.85 cps; group 3, 103.74 ± 17.25 cps; and group 4, 90.78 ± 13.67 cps (Fig. 4A). The true coincidence rates of the 4 groups were significantly different from each other except for group 3 versus group 4. The ratios of the true coincidence rate for group 2 to groups 1, 3, and 4 were 0.8, 1.4, and 1.6, respectively. The COV of PET images increased with increasing patient weight: group 1 had an average of 5.64% ± 1.02%; group 2, 7.52% ± 2.18%; group 3, 10.98% ± 2.54%; and group 4, 14.15% ± 2.35% (Fig. 4B). Higher COVs were observed in group 4. Significant differences were observed for all pairs of each group (P < 0.01). The random fraction showed no significant differences for any pairs of each group, and the average random fraction for all 4 groups was approximately 35% (Fig. 4C).
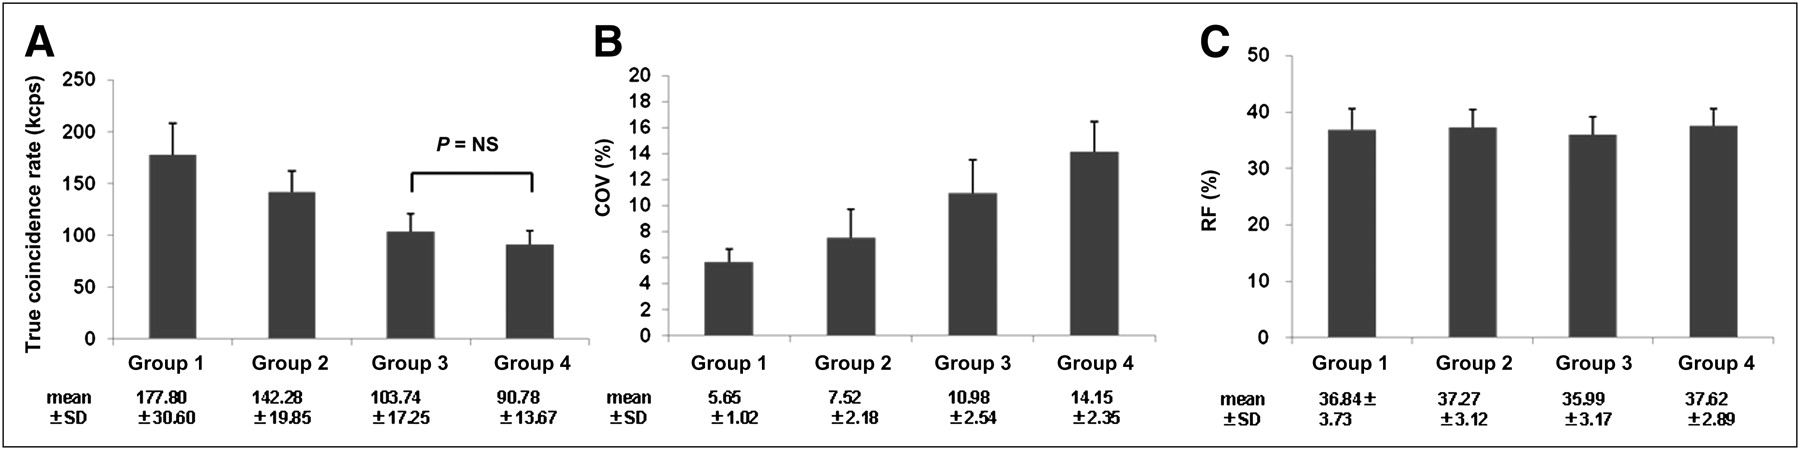
True coincidence rate (A), COV of PET images (B), and random fraction (C) for 4 patient-weight groups. Except for group 3 vs. group 4 (P < 0.01), true coincidence rate differed significantly among groups. COV of the 4 groups differed significantly for all pairs (P < 0.01). Average random fraction was approximately 35% in all groups (P = not statistically significant). RF = random fraction.
DISCUSSION
We found that an injected dose of more than approximately 10 MBq/kg did not contribute to greater image quality in thin patients for a peak NECR, and PET image quality declined for a lower true coincidence rate in overweight patients of 75 kg or more. However, because random fraction was independent of patient weight, these findings suggested that the same image quality could be obtained with a longer acquisition time.
With the development of PET/CT, 18F-FDG PET has been more widely used in the diagnosis and staging of malignant disease. In addition, 18F-FDG is also now available from commercial suppliers in most regions of Japan, as are radiopharmaceuticals labeled with 123I, 201Tl, and 67Ga. However, it is difficult to regulate the injected dose according to the weight of individual patients. If the injected dose in an overweight patient cannot produce high-quality PET images, the PET acquisition time is prolonged on the basis of empiric observation (2,5,10). Obesity affects PET image quality because of high photon attenuation and scatter. Therefore, we attempted to make adjustments to the acquisition protocols based on patient weight to optimize 18F-FDG PET/CT image quality. The quality of PET images in obese patients is degraded. The true and random coincidence rates increase significantly with increasing injected dose per kilogram, and the average random fraction was approximately 35% in this study. The true coincidence rate is proportional to the activity present, and the random coincidence rate is proportional to the square of the activity present. Therefore, random fraction increases linearly with activity (6). In this study, the true coincidence rate decreased with increasing patient weight at almost a fixed injected dose. The injected dose per kilogram in overweight patients was low, and the random coincidence rate was decreased. Because random fraction, which influences PET image quality, is unrelated to patient weight, PET image quality may be determined by the acquisition time (Fig. 5).

Follow-up images of 102-kg patient with lymphoma, injected with 388.7 MBq (A) and 254.1 MBq (B) of 18F-FDG. Because optimal protocols were regulated by acquisition time (A, 120 s/bed position; B, 190 s/bed position), COVs of PET images were nearly identical (A, 18.5%; B, 18.8%).
A higher injected dose significantly increased NECR, and the NECR curve peaked at 10.11 MBq/kg. This curve represents the exposure dose increase to a greater extent than does a higher injected dose in underweight patients, and PET quality is not improved by injected dose. The peak NECR attained in the phantom is different from phantom size and higher than mean patient value. Local experiments with a 70-cm NEMA phantom indicated that NECR with Acquiduo PCA-7000B (Toshiba Medical Systems) showed saturation for activities exceeding 12 MBq/kg. Therefore, the maximum injected dose in underweight patients is less than approximately 10 MBq/kg in 3D LSO PET/CT.
The COV of PET images was significantly higher for a low dose per kilogram, that is, higher in overweight patients than in underweight patients. In fact, patients over 75 kg showed a decrease in megabecquerels per kilogram, and the COV of PET images increased from 5.65 to 14.15. With the same injected dose, PET image quality was better in underweight patients than in overweight patients. Both the total true counts and the visual score of PET images had significant negative correlations with weight (11). However, the injected dose of 18F-FDG from commercial suppliers is not an adequate activity for overweight patients. Therefore, alternative protocols with longer acquisition times should be adopted to compensate for the loss of image quality (10). Because the random fractions remained steady, PET was evaluated with the same image quality for longer acquisition times. Acquisition times were estimated according to the relationship found between the true coincidence rate and the weight ranges of the 4 groups. The ratio of the true coincidence rate for group 2 to groups 3 and 4 were 1.4 and 1.6, respectively, and the estimated acquisition times for groups 3 and 4 were 170 and 190 s, respectively, per bed position.
PET image quality was evaluated for the COV in an ROI over the liver. The liver has often been used to distinguish image quality because it shows relatively high-level accumulation of 18F-FDG under physiologic conditions (4,11). In overweight patients, the COVs were larger than those in underweight patient and images were noisy. This study was performed to determine the best acquisition protocol for 3D LSO 18F-FDG PET/CT, and the findings suggested that the maximum injected dose was approximately 10 MBq/kg in underweight patients. The optimal acquisition time was approximately 1.6 times longer in overweight patients than in patients of normal weight.
In 18F-FDG PET scans, injected dose is one factor determining image quality. However, the radiation dose in the patient from radiopharmaceuticals should be kept as low as possible, particularly for younger patients. In this study, patients received an average injected dose of 340 MBq of 18F-FDG. Because the ratio of the true coincidence rate for group 2 to group 1 was 0.8, the injected dose in underweight patients was estimated to be 270 MBq. If the COV is accepted to be 10%, the injected dose should be kept under 200 MBq in adolescent patients because the ratio of the true coincidence rate for group 3 to group 1 was 0.6.
This study had several limitations. First, the clinical prompt and random coincidence rates were analyzed retrospectively for body position. Because the average injected dose of 18F-FDG was approximately 340 MBq, the peak NECR attained in underweight patients was not apparent in overweight patients. Second, we used the COV for quantitative analysis of PET image quality. The COV of the ROI on the liver may vary according to PET system, image reconstruction algorithm, and imaging filter. For example, the gaussian filter changes image quality by full-width-at-half-maximum parameters. This study did not systematically analyze the effect of the gaussian filter on PET image quality. However, we elected to use a standard reconstruction algorithm as suggested by the vendor.
CONCLUSION
We have measured the true and random coincidence rates, NECR, and random fraction in clinical scanning and evaluated PET image quality. Our findings suggested that in 3D LSO 18F-FDG PET/CT, the injected dose in underweight patients should be reduced 0.8 times, and acquisition time should be approximately 1.4–1.6 times longer in overweight patients than in patients of normal weight. Estimation of optimal acquisition times by the true coincidence rate based on patient weight is more important than other variables in improving PET image quality, especially in overweight patients.
REFERENCES
- Received for publication July 26, 2010.
- Accepted for publication November 10, 2010.


Jump to section
Related Articles
Cited By...
- Weight-Based Protocols Offer Significant Reduction in Radiation Dose Without Affecting PET-CT Image Quality
- Added Value of Digital over Analog PET/CT: More Significant as Image Field of View and Body Mass Index Increase
- Influence of Statistical Fluctuation on Reproducibility and Accuracy of SUVmax and SUVpeak: A Phantom Study
- Improvement in PET/CT Image Quality with a Combination of Point-Spread Function and Time-of-Flight in Relation to Reconstruction Parameters