


Abstract
99mTc-mebrofenin hepatobiliary scintigraphy has been introduced for the noninvasive assessment of liver function in the clinical setting and in experimental research. Methods: During a period of 2 y, 15 patients with fatty livers diagnosed as having nonalcoholic steatohepatitis underwent hepatobiliary scintigraphy using the radiopharmaceutical agent 99mTc-labeled mebrofenin. After intravenous administration of 85 MBq of 99mTc-mebrofenin, a dynamic image was acquired with the liver and heart in the field of view. In this study, a comparison between the values of hepatic uptake rate obtained by applying 2 methods in patients with nonalcoholic steatohepatitis—multiple-time graphical analysis (Gjedde–Patlak plot) and the differentiation between different regions of interest using hepatobiliary scintigraphy—was made. Results: The values of the uptake rate reveal that uptake obtained by applying the second method are significantly higher than that obtained by applying the first one (P = 0.001). A strong positive association (n = 15; r = 0.92; R2 = 0.84) was found between these measurements. From a Bland–Altman statistical test that was performed on the results we also found that 87% of the cases (13/15) were within 1.96 SD. Conclusion: The Gjedde–Patlak analysis method can be considered as an alternative technique to find and calculate the hepatic uptake rate.
- hepatic uptake rate
- Gjedde–Patlak plot
- hepatobiliary scintigraphy parenchymal disease
- nonalcoholic steatohepatitis
In multiple-time graphical analysis, the tracer concentration curves of the tissue region of interest (ROI) and arterial plasma are transformed and combined into a single curve that approaches linearity when certain conditions are reached. The data can be plotted in a graph, and a line can be fitted to the linear phase. The slope of the fitted line represents the net uptake rate of the tracer or volume of distribution (1).
The graphical analysis methods are independent of any particular model structure, although the slope can be interpreted in terms of a combination of model parameters for some model structure. Graphical analysis methods have been developed for reversibly and irreversibly binding tracers (2,3).
As described in the Web site of the Turku Medical Cyclotron Project (1): “The original idea of Patlak and Blasberg was to create a model independent graphical analysis method: whatever the tracer is facing in the tissue, there must be at least one irreversible reaction or transport step, where the tracer or its labeled product cannot escape.”
“It is assumpted [sic] that all the reversible compartments must be in equilibrium with plasma; i.e. the ratio of the concentrations of tracer in plasma and in reversible tissue compartments must remain stable. In these circumstances only the accumulation of tracer in irreversible compartments is affecting the apparent distribution volume. In practice, this can happen only after the initial sharp concentration changes when the plasma curve descends slowly enough for tissue compartments to follow.”
Hepatobiliary scintigraphy (HBS) using 99mTc-labeled iminodiacetic acid (IDA) analogs has been proposed as a liver function test (4). HBS is a noninvasive test that can be used to quantify hepatobiliary function (5); it is also useful for the evaluation of both total and regional liver function and excretory kinetics. Liver uptake function can be measured by first-pass hepatocyte extraction fraction or the IDA liver uptake rate (6,7).
Morphologic imaging (CT and ultrasound) rely on volume changes of the liver, which do not always represent hepatic function, indicating the importance of additional functional assessment of the liver (8–10).
The rate of liver uptake of IDA analogs correlates well with the indocyanine-green clearance test—using the method of Ekman et al. (7)—in patients scheduled for major liver surgery (11).
The aim of the present study was to compare hepatic uptake rates obtained by 2 methods—those of Gjedde–Patlak (multiple-time graphical analysis) (12,13) and Ekman et al. (differentiation between different ROIs) (7)—using HBS in patients with nonalcoholic steatohepatitis (NASH).
To our knowledge, this is the first study that calculated the hepatic uptake rate by applying the Gjedde–Patlak plot method and also the first study that compared the values of uptake rate applying the methods of Gjedde–Patlak (12,13) and Ekman et al. (7) using HBS.
MATERIALS AND METHODS
Subjects
The clinical diagnosis of NASH was established in 15 patients with fatty liver. All patients were evaluated by history and physical examination. Other causes of liver disease were excluded by a liver ultrasound and viral, autoimmune, and metabolic screens.
Scintigraphic Test
Patients underwent HBS using 99mTc-labeled mebrofenin. After the intravenous administration of 85 MBq of 99mTc-mebrofenin, anterior imaging was performed with a γ-camera (Meridian; Philips), with the liver and heart in the field of view. Dynamic images (128 × 128 matrix) were acquired for 1 h at 10 s/frame for 60 frames (liver uptake sequence), followed by 50 frames of 1 min each (bile excretion sequence). The liver uptake rate was calculated as described by Ekman et al. (7). ROIs were drawn around the liver, heart, and large vessels within the mediastinum (serving as blood pool) and around the total field of view (indicative of total activity). The liver ROI was drawn automatically on a threshold-based algorithm, using 20% of the maximum liver value on a summed image of the first 10 min of the acquisition as the cutoff threshold. Three different time–activity curves based on the liver, blood pool, and total activity were generated. Liver uptake based on these 3 parameters was calculated in percentage per minute. 99mTc-mebrofenin uptake was calculated between 150 and 350 s after injection, to ensure that the calculations were made during a phase of homogeneous distribution of the agent in the liver parenchyma and before the rapid phase of hepatic excretion (7).
Patlak Plot
The Patlak plot has been developed for systems with irreversible trapping (12,13) and belongs to a group of graphical analysis techniques whereby the measured time–activity curve undergoes a transformation and is plotted against some sort of normalized time. 99mTc-labeled IDA analogs are extracted from the blood by hepatic parenchymal cells and excreted thereafter into the biliary system. Between 150 and 350 s after tracer injection, significant uptake of the tracer by liver parenchyma, almost complete washout of blood-pool activity, and no significant tracer excretion into the biliary system were observed. Therefore, a steady state is present for this time interval, and the conditions for applying the Gjedde–Patlak method are met (14).
Theory
When the steady state is achieved, the Gjedde–Patlak plot becomes linear. The slope of the linear phase represents the net transfer rate K (influx constant). To make it simple, K represents the amount of accumulated tracer in the liver to the amount of tracer that has been available in plasma (1).
The y-axis of the plot contains apparent distribution volumes—that is, the ratio of activities of tracer in the liver and in plasma. The x-axis is the normalized plasma integral—that is, the ratio of the integral of plasma activity and the plasma activity (1).
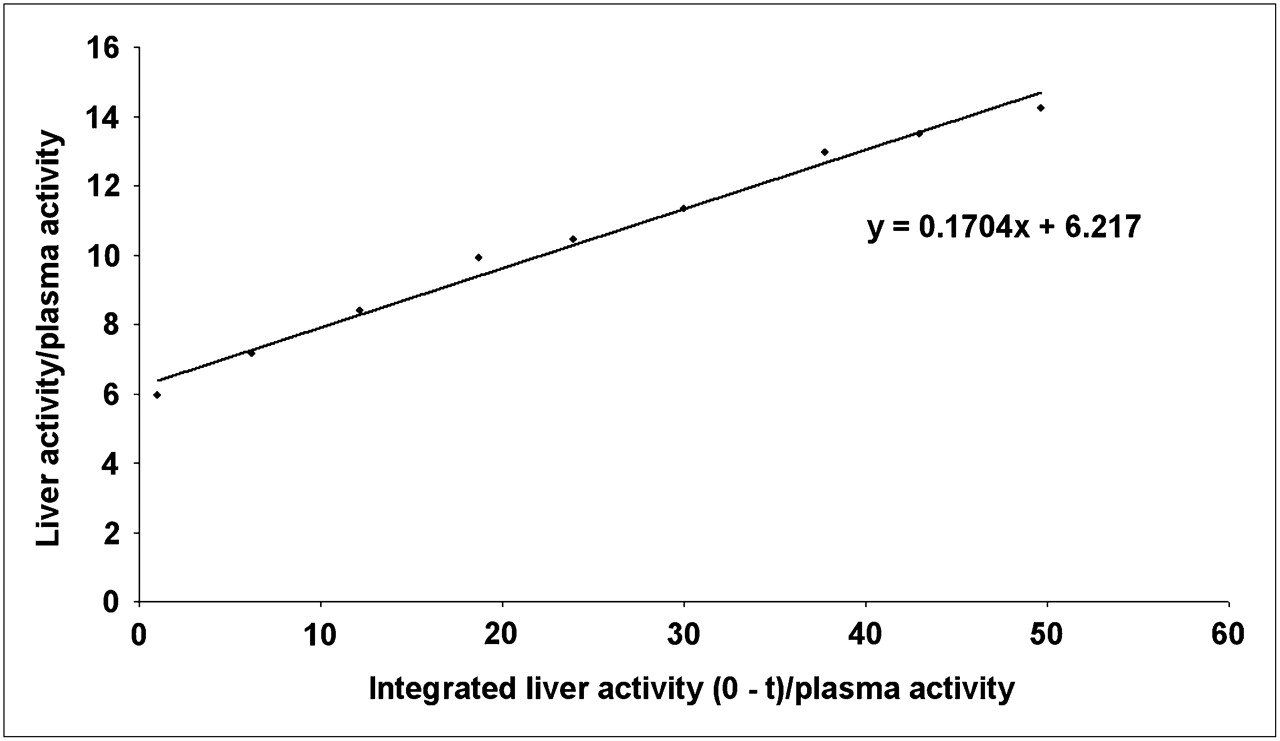
The Patlak plot is given by the following expression: This means that the measured liver activity is divided by plasma activity and plotted at a normalized time (integral of input curve from injection divided by instantaneous plasma activity). For systems with irreversible compartments, this plot will result in a straight line after sufficient equilibration time (Fig. 1). The slope and the intercept must be interpreted according to the underlying compartment model. For the 99mTc-mebrofenin, the slope represents the liver uptake rate, and the intercept V equals V0 + vB with the distribution volume V0 of the reversible compartment C and the fractional blood volume vB (14).

Hepatic Gjedde–Patlak plot.
For every scintigraphic examination, the hepatic uptake rate of 99mTc-mebrofenin was calculated twice, applying the 2 methods (those of Gjedde–Patlak (12,13) and Ekman et al. (7)) by the same operator.
RESULTS
Table 1 represents the values for the uptake rates obtained by the Gjedde–Patlak plot analysis and Ekman et al. methods.
Functional Data: Hepatic Uptake Rate for 15 NASH Patients with Fatty Livers
Figure 1 demonstrates the hepatic Gjedde–Patlak plot. The x-axis is the integrated radioactivity in the blood for an ROI around the heart, divided by the radioactivity in the blood for that ROI during a certain time. The y-axis is the radioactivity in the liver ROI during a certain time, divided by the radioactivity in the blood during the same time.
Figure 2 demonstrates the relationship between the values of the hepatic uptake rate obtained by applying Gjedde–Patlak plot analysis and the methods of Ekman et al.
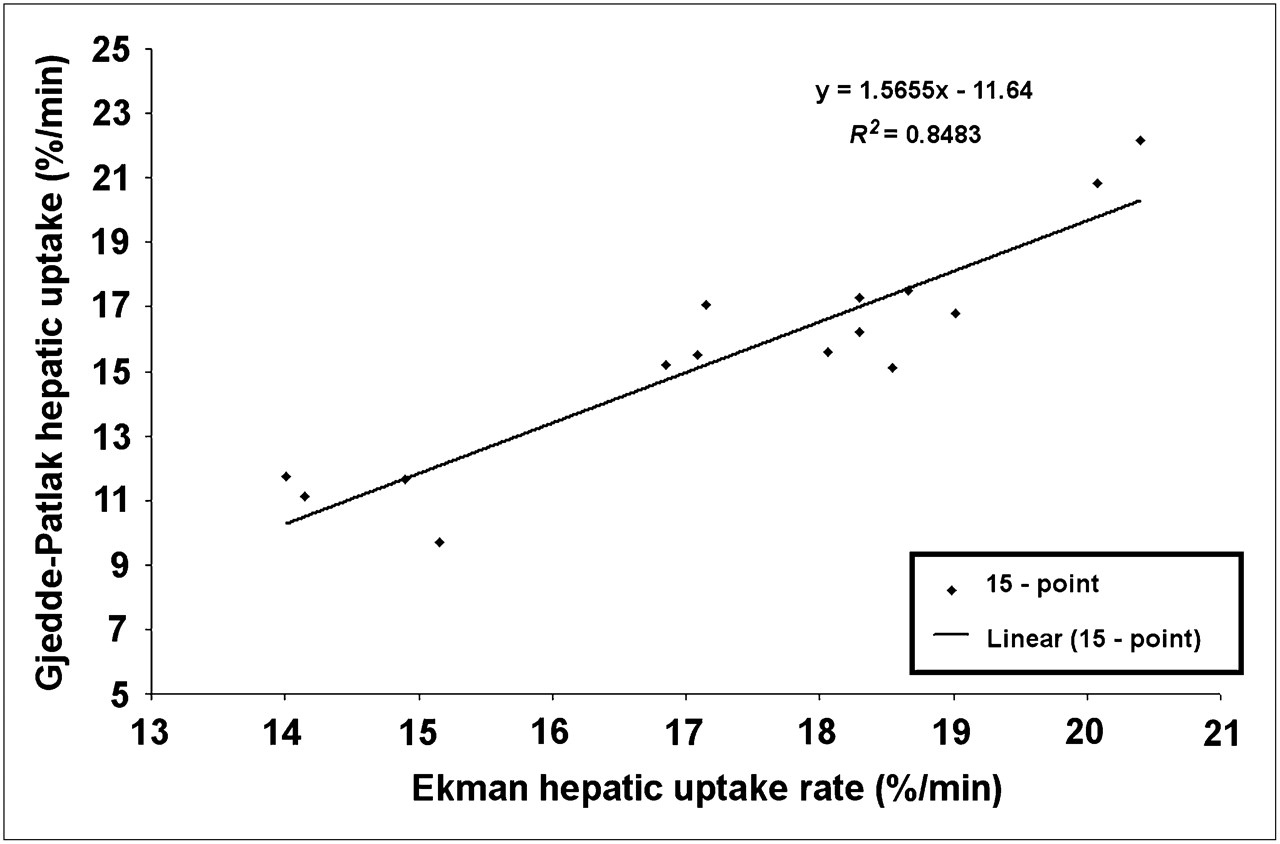
Scatter plot with linear regression line of HBS liver uptake rate values calculated by applying Gjedde–Patlak plot method and method of Ekman et al. (7).
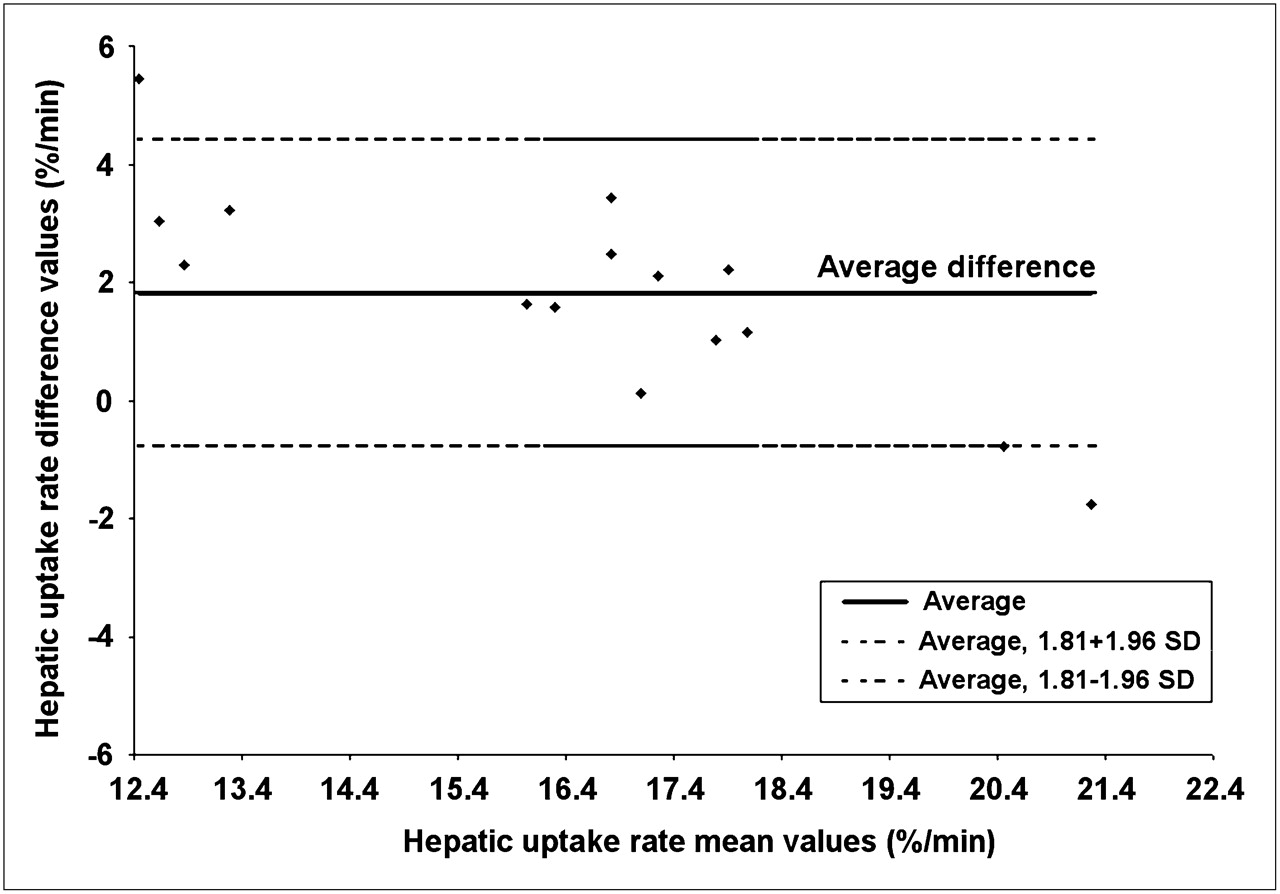
Scintigraphic calculations (Ekman et al. (7) and Gjedde–Patlak (13,14)) were further analyzed according to the Bland–Altman method, which is a supplemental test to compare 2 different methods when the true value is unknown. Data are presented as a scatter plot of the mean values versus the difference of both calculations (Fig. 3). Mean liver uptake obtained by applying the 2 methods (horizontal axis) is plotted against the differences in the 2 methods (vertical axis). Horizontal solid lines indicate the mean difference between the 2 methods. Horizontal dashed lines indicate the 95% limits of agreement (mean ± 1.96 SD). Of the values in the study, 87% (13/15) were within the limits of agreement.

Bland–Altman plot. x-Axis represents mean values of uptake rate values, and y-axis represents differences between values of uptake rate that were obtained by applying Gjedde–Patlak plot method and method of Ekman et al. (7).
Uptake rate as shown in Table 1 was significantly higher with the method of Ekman et al. than with the Gjedde–Patlak plot method (P = 0.001). Only 1 patient demonstrated a higher rate with the method Gjedde–Patlak. A strong positive association (n = 15; r = 0.92; R2 = 0.84) was found between both methods (Fig. 2).
DISCUSSION
Hepatic fatty accumulation (i.e., steatosis) is a clinicopathologic condition that presents with a wide spectrum of liver damage ranging from simple steatosis to a severe inflammatory form, advanced fibrosis, and cirrhosis (15). It is currently the most common parenchymal liver disease in the Western world, affecting 20% of individuals in the general population and up to 95% among obese subjects (16,17). Because of the evolving knowledge of the clinical importance of steatosis combined with its increasing prevalence, new pharmacologic therapies are being developed to treat this disorder (17). However, to assess the potential impact of treatment, serial biopsies are required, subjecting patients to potentially harmful or even lethal complications (18). As long as reliable noninvasive diagnostic methods are lacking, the gold standard for the diagnosis of steatosis is histopathologic examination (19). Even the latest state-of-art radiologic modalities (ultrasonography, CT, or MRI) fail to reliably identify the extent of steatosis (17,19). HBS is a widely available, simple, inexpensive tool that can assess parenchymal liver function noninvasively.
Several studies in patients with acute and chronic parenchymal liver disease (5,20) have shown a correlation between hepatobiliary function assessed by 99mTc-mebrofenin scintigraphy and the histopathologic severity of the underlying pathology (21–23). Therefore, HBS would be of great clinical importance for the follow-up of patients during pharmacologic therapy
The potential role of biliary transport malfunction in progressive hepatocellular injury and inflammation present in steatotic livers has been described (24). Cholestasis promotes the accumulation of hepatotoxins, consequently instigating hepatocellular necrosis and local proinflammatory response (25). Recently, the correlation between hepatobiliary function and structural—that is, histopathologic—changes during the development of steatosis using the Ekman method was also documented in a rat model (26).
Several methods of liver function assessment have been used, including liver biochemistry, Child classification, and quantitative liver function tests (27). The indocyanine-green clearance test is regarded as the most accurate for the evaluation of preoperative hepatic function reserve and for the prediction of postoperative mortality (28,29). Research conducted by Roelof et al. (30) demonstrated a strong positive association between liver function measured with indocyanine-green clearance and liver function measured with HBS by applying the method of Ekman et al. (7). In our study, an excellent correlation (n = 15; r = 0.92; R2 = 0.84) was found between the Gjedde–Patlak plot and Ekman uptake rate.
The Gjedde–Patlak analysis can be considered as an alternative technique to find and calculate the hepatic uptake rate. Also, the Patlak method is expected to be more reproducible because the uptake rate equals the slope of the straight line—that based on integration of activity in the cardiac pool and the activity in the liver ROI at 8 different time intervals. These 8 intervals are shown in Figure 1 for 1 patient; for this patient, the slope is equal to 17%/min, whereas the value of uptake obtained from the Ekman method is calculated from 1 point that represents activity in the liver ROI over the total activity in the field of view. The significantly higher Ekman uptake values might be due to the probable interference of hypoalbuminemia or elevated serum bilirubin levels in total-field-of-view counts.
Mebrofenin is an organic anion conjugated to an acetanilide (a lidocaine analog) and to 99mTc compounds. The hepatic uptake occurs via organic anion transporters 1 and 2, and its excretion into the bile occurs through multidrug-resistance proteins 2 and 3 (31–33).
In a study on methionine- and choline-deficient (MCD) diet–induced steatohepatitis in a rat model, the decreased mebrofenin uptake rate correlated closely with hepatic fat accumulation, increased inflammation, and other histopathologic changes (34). The half-life for excretion was prolonged but demonstrated poorer correlation with liver histopathology and biochemical parameters (35). These findings were obtained after 1 wk of diet when hepatic tumor necrosis factor-α, plasma bilirubin, aspartate aminotransferase, and prothrombin time were also abnormal. It was argued that elevation of serum enzymes indicates that membrane rupture and cell death had already occurred before the study at 1 wk, and it was assumed that if data had been collected at earlier times (2, 4, 6, 24, 48, 72, or 96 h) after introduction of the diet, it could have been possible to show cell damage before death by demonstrating a normal uptake rate but a prolonged excretory half-life (22). This argument is supported by the previously documented unperturbed 99mTc-hydroxyiminodiacetic acid uptake observed in chronic liver disease in a few studies (21–23,36). These studies used thiacetarsamide, CCl4, copper, and ischemia to induce liver damage; however, these changes are not representative of human NASH. The diet used by Veteläinen induced histopathologic changes similar to human steatosis (34). Furthermore; it has been recently demonstrated that NASH induced experimentally in rats by an MCD diet is characterized by impaired function of hepatic anion transporters (37) and increased multidrug-resistance protein 2 and 3 levels (37,38). In addition, NASH is a diffuse process involving the whole liver parenchyma; therefore, HBS is applicable in this disease entity, offering a simple quantitative noninvasive method to assess liver function and degree of parenchymal infiltration.
However, reproducibility depends largely on the level of automatic and systematic ROI drawing, which is subject to a learning curve. ROIs in our patients were drawn automatically using a 20% threshold to minimize subjective interference. Data were elaborated by 1 experienced nuclear medicine physician.
The points mentioned in this article stress the importance of hepatic uptake measurements in patients with NASH. Commercially available software based on the Patlak method is available in most nuclear medicine facilities and is currently used to measure the function of other organs. Using this readily available method to quantify liver function would help to boost the use of HBS in management of the widely prevalent NASH.
CONCLUSION
HBS is a widely available, simple, inexpensive tool that can assess parenchymal liver function noninvasively. NASH is a diffuse process involving the whole liver parenchyma, for which it seems that uptake function is more involved than excretory function. At this point, developing noninvasive scintigraphic methods to measure liver uptake is necessary to boost the role of HBS in the management of this widely prevalent disease.
There was a strong correlation between hepatic uptake values measured by the Ekman and the Patlak methods; however, the reported Ekman values were significantly higher than the Patlak values.
The Gjedde–Patlak (13,14) analysis method is expected to be more reproducible than that of Ekman et al. (7), and it can be considered as an alternative technique for finding and calculating the hepatic uptake rate.
Footnotes
-
COPYRIGHT © 2010 by the Society of Nuclear Medicine, Inc.
References
- Received for publication June 18, 2009.
- Accepted for publication November 16, 2009.


Jump to section
Related Articles
Cited By...
- No citing articles found.