


Abstract
Respiration-correlated PET (RCPET) can reduce motion artifacts, but image quality generally decreases. The use of phase-by-phase attenuation correction (PAC) for RCPET using respiration-correlated CT (RCCT) requires large computational resources, and tumor positions will not always match correctly because of different binning methods for CT and PET. In this study, we investigated whether PAC for RCPET can be replaced by midventilation attenuation correction (MidV-AC) for a group of lung cancer patients. Methods: RCPET/CT scans of 19 non–small cell lung cancer patients were performed. List-mode PET and CT data were binned and reconstructed into 8 phases. Two AC methods for RCPET were applied. First, the corresponding 8 RCCT phases were used for PAC. Then MidV-AC was used. Analyses were performed in terms of standardized uptake values (SUVs), volume recovery, contrast, and signal-to-noise ratio (SNR). Results: Average differences between PAC and MidV-AC for mean and maximum SUV were 1.0% and 0.9% (P = 0.007 and P = 0.002), respectively, whereas SNR, contrast, and volume did not differ significantly (P ≥ 0.2). Large motion amplitudes and irregular breathing revealed larger differences between phase 1 and MidV-AC values. Conclusion: Differences in SUV, volume, SNR, and contrast between PAC as available in currently used clinical software and MidV-AC for RCPET are small. MidV-AC provides an excellent surrogate for PAC for most lung cancer patients encountered in clinical practice.
CT is the most commonly used imaging modality in radiotherapy and provides anatomic and morphologic information; however, compared with 18F-FDG PET, CT lacks sensitivity and specificity in lung cancer patients for detecting disease (1). PET takes advantage of the increase in the glucose uptake within lesions and can provide metabolic and physiologic information about these lesions (2). Therefore, combined PET/CT is an excellent way to image lung tumors for radiotherapy (3). Nevertheless, respiratory motion is seen as a limiting factor of image quality and quantification in PET (4) and, thus, in combined PET/CT.
In combined PET/CT, a CT scan is normally performed before the PET scan to obtain a CT-based attenuation map for attenuation correction (AC) of the PET data. CT is a fast imaging modality, and a regular multislice CT scan of the complete thorax is often completed in several seconds. The image of a certain slice is thus recorded in fractions of a second, and a moving tumor will likely not be imaged at its average position, given the average duration of a full respiration cycle (4 s) (5). A PET scan, on the other hand, will take 2–5 min per bed position, resulting in a distortion of the combined PET/CT image (6,7). Furthermore, respiratory motion could lead to blurring of the PET image and consequently to uncertainties in tumor size, position, and shape of the tumor and an underestimation of the measured standardized uptake value (SUV) (8,9).
To overcome this shortcoming, several techniques such as respiration-correlated acquisitions have been proposed (10–17). In respiration-correlated PET (RCPET)/CT (RCCT), the patient's respiratory signal is recorded during the acquisition of the data. Many studies have shown the benefit of respiration-correlated PET for a fixed number of phases in terms of improved volume recovery and SUV quantification for moving tumors (11,12,15,17).
For most of the clinically made RCPET scans today, AC is performed using the static multislice CT. For a moving tumor, CT and RCPET tumor positions will not match for all of the phases and an inaccurate AC could take place. This can lead to another introduction of motion artifacts and incorrect SUV quantification. Time- or phase-averaged CT data have been used for AC (18,19) of PET and RCPET. Others have used only particular CT phases for AC of gated and ungated PET (20). The use of midventilation CT has been investigated with respect to its use in radiotherapy treatment planning for lung cancer patients (21,22), but not for AC of RCPET.
Only a few studies have investigated the use of combined RCPET and RCCT for phased AC (PAC) (23–25). With PAC, the RCCT phases are used for the AC of the corresponding RCPET phases. Generally, these phantom and simulation studies show the application of PAC results in even better volume estimation and more accurate localization and quantification of activity and SUV with RCPET. However, the experiments described in these studies were performed on a Siemens TruePoint Biograph scanner. Currently, on these scanners the raw CT data were binned on the basis of the amplitude of the patient's breathing signal, whereas the raw list-mode PET data were binned on the basis of the phase of the breathing signal. The different reconstructed frames of the RCCT will, therefore, not completely match with the phases of the RCPET and may lead to image artifacts and unreliable quantification in terms of SUV for the different reconstructed PET phases. These studies (23–25) have all corrected for this mismatch. However, performing such a correction requires specific knowledge and equipment; it is also a time-consuming procedure that cannot be readily used in daily clinical practice. In this study, we proposed a method, using the standard hardware and software of current Siemens Biograph PET/CT scanners, to use RCCT for AC of RCPET in daily practice for lung cancer patients.
MATERIALS AND METHODS
The measurements were performed on a Biograph 40 TruePoint PET/CT scanner (Siemens Medical Solutions). Table 1 shows the specifications for the Siemens Biograph 40 TruePoint. The scanner is equipped with ultra-fast detector electronics (Pico3D) and is able to acquire PET data in list mode. Furthermore, the scanner is also capable of acquiring RCCT scans. The respiration signal was recorded with the Anzai system (AZ-733 V; Anzai Medical Corp.), which consists of a load cell in a fixing belt strapped around the patient's chest. During an RCCT scan, the Anzai system records the full respiration signal, and the scanner software allows the operator to adjust, add, or remove markers (e.g., end expiration) derived from the respiration signal retrospectively before a reconstruction is made. In contrast, during an RCPET scan, the Anzai system analyzes the respiration signal in real time and places markers according to the stability of the respiration signal. These triggers are then recorded in the 1-bed-position PET list-mode file, with no retrospective adding or adjusting of triggers possible.
Relevant System Specifications of PET and CT Components of Siemens TruePoint Biograph 40 PET/CT Scanner
Patients
For this study, 19 patients with non–small cell lung cancer were included. The patients were injected with 18F-FDG at 4 MBq/kg of body weight + 20 MBq (which is the standard injected activity used at our department) and scanned 1 h after injection. The respiration belt was strapped around the patient's chest, and the patient was positioned on the flat tabletop in head-first/supine position with the arms raised above the head. Patients first received an RCCT scan, followed by the 24-min list-mode PET scan of 1 bed position.
Data Processing and AC
After acquisition of the RCCT, the data were binned into 8 frames according to the respiration amplitude. The binning method is based on amplitude; that is, the distance between the global minimum and global maximum amplitude within 1 respiration cycle was divided into 4 equally spaced zones. Minimum and maximum triggers were automatically placed by the software but could also be adjusted manually after the scan so that no respiration cycles were missed. For each zone, we considered both inhalation and exhalation portions of the respiration trace separately. By separating each zone into inhalation and exhalation, we obtained a total of 8 amplitude bins. Phase 1 was chosen at begin expiration, corresponding to the frame at 0% expiration (Fig. 1). The beam-on signal of the scanner was used to synchronize the respiration signal with the CT data. Binning and reconstruction of the CT data were performed using dedicated software installed on the scanner (Siemens).

Overview of RCCT and RCPET phases with their corresponding amplitudes. Mismatch of position of tumor if 2 different binning methods are used. Blue and red circles indicate tumor location for amplitude binning and phase binning, respectively. Blue and red dashed lines illustrate division of signal into, respectively, equally spaced amplitude bins and equally spaced phase bins.
Binning of the PET list-mode data was also performed retrospectively. A trigger could be set at arbitrary amplitude. We chose to trigger at peak amplitude, which refers to the moment of maximum inhalation. The time between 2 consecutive triggers was then divided into 8 phase bins, and the data were sorted to the corresponding bin. All the PET images were reconstructed using Fourier rebinning and ordered-subsets expectation maximization reconstruction with 4 iterations and 8 subsets and postfiltered with a gaussian filter (5 mm in full width at half maximum). A 3-dimensional (3D) scatter correction of the PET data was applied.
The raw list-mode PET file was reconstructed using the 8 corresponding phases of the RCCT scan for AC, which will be referred to as phased attenuation-corrected RCPET. Furthermore, we also reconstructed the 8-phase RCPET while using the 50% expiration CT or midventilation CT for the AC of all the phases (MidV-AC) of RCPET.
For patients, exhalation usually takes longer than inhalation, which could result in a mismatch between the RCCT phases and the corresponding RCPET phases because of different binning methods (Fig. 1). Therefore, when averaged over all 8 bins, this mismatch could partly undo the improvement of PAC relative to MidV-AC.
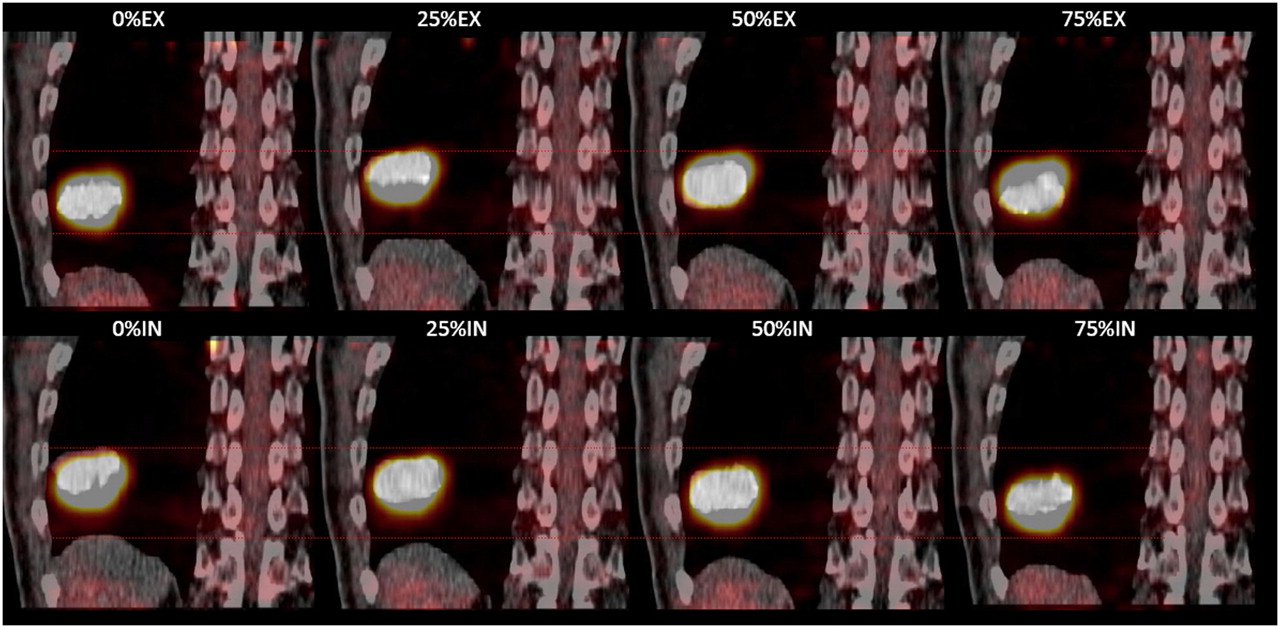
However, because the match in theory is optimal at phase 1, values of the phase 1 PAC and phase 1 MidV-AC for patients were also compared. Figure 2 shows this mismatch between the 8 RCCT and 8 RCPET phases for a patient.

Analysis
RCPET images were analyzed in terms of signal-to-noise ratio (SNR), contrast, volume recovery, and recovery of the maximum and mean SUV (SUVmax and SUVmean, respectively). SUV is defined as the ratio of decay-corrected activity in a certain tissue volume to the injected activity per patient body weight.
Noise was defined as the SD of the activity from a region of interest (ROI) outside the patient (AN), and mean activity was defined as the mean activity inside the tumor (AM). Then, SNR was defined as the maximum ratio between AM and AN (Eq. 1). The ROI to determine the noise outside the patient was kept constant for every scan and every phase; the ROI to determine the mean of the tumor was drawn using an automated contouring method for every phase and every scan. Meanwhile, the window level and window width settings were kept constant for every scan. All the ROIs were drawn on the axial slices. To determine contrast, an additional 8 identical ROIs were placed in the immediately surrounding tissue without increased uptake. Then contrast was defined by Equation 2, where AM is again the mean activity inside the tumor and AS is the mean activity of the ROIs surrounding the tumor (26). Eq. 1
Eq. 1 Eq. 2
Eq. 2
Tumor contours and volume were determined using an automated threshold-based SUV contouring method and performed in the dedicated software package TrueD (version VC30; Siemens). A volume of interest (VOI) is selected around the tumor. Then an isocontour, consisting of slice-by-slice ROIs, is automatically generated on the basis of a certain percentage of the SUVmax found inside the selected VOI following the method described by Daisne et al. (27) and Öllers et al. (28). On the basis of experiments performed in-house, the threshold value to determine tumor volume for patients was set to 38% (28). The average SUVmax and SUVmean were defined as, respectively, the peak value of the SUV and the mean SUV found within the isocontoured tumor volume per phase, averaged over the 8 phases. The phase 1 SUVmax and SUVmean were defined as, respectively, the peak value of the SUV and mean SUV within the isocontoured tumor volume for phase 1.
Software developed in-house with MATLAB (The MathWorks Inc.) was used to determine the motion amplitude of the lesion in all 3 orthogonal directions. The 3D motion vector is defined as the quadratic sum of the motion amplitudes of the 3 orthogonal directions.
Statistics
Both average values and phase 1 differences for SUV, tumor volume, SNR, and image contrast between the 2 AC methods PAC and MidV-AC were evaluated for the group of patients using a paired 2-tailed Wilcoxon signed rank test, with a threshold for statistical significance of P < 0.05 (SPSS software, version 15 for Windows; SPSS Inc.). Furthermore, the difference between MidV-AC and PAC against the average of the 2 methods per patient is determined using a Bland–Altman analysis, which gives a better understanding of the magnitude of the differences and whether these depend on the magnitude of the average measurement (29).
RESULTS
In Tables 2–4⇓⇓, the results of PAC RCPET versus MidV-AC RCPET for patients are given. We compared both average values and phase 1 values. Three-dimensional motion vectors and tumor locations are presented as well. No large differences were seen between the 2 AC methods. However, for larger motion amplitudes (3D vector), larger differences could be seen between phase 1 values and the MidV-AC values (patients 6, 10, and 17). The large difference between the 2 attenuation methods for all parameters for patients 2 and 7 can be clearly explained by those patients' irregular breathing patterns.
Patient Average and Phase 1 SUVmax with SD for 8 Phases of PAC RCPET and MidV-AC RCPET
Patient Average and Phase 1 Volumes (cm3) with SD for 8 Phases of PAC- and MidV-AC RCPET
Average Differences Between 2 Attenuation-Correction Methods for Average and Phase 1 Values for SUV, Image Quality, and Volume
PAC average SUVmax and SUVmean were, respectively, 0.9% and 1.0% larger than MidV-AC (P = 0.002 and P = 0.007, respectively). On the other hand, PAC phase 1 SUVmax was 0.9% smaller than MidV-AC (P = 0.01). No significant differences were seen for the phase 1 SUVmean and for SNR, contrast, and volume obtained with the 2 different AC methods (P ≥ 0.1).
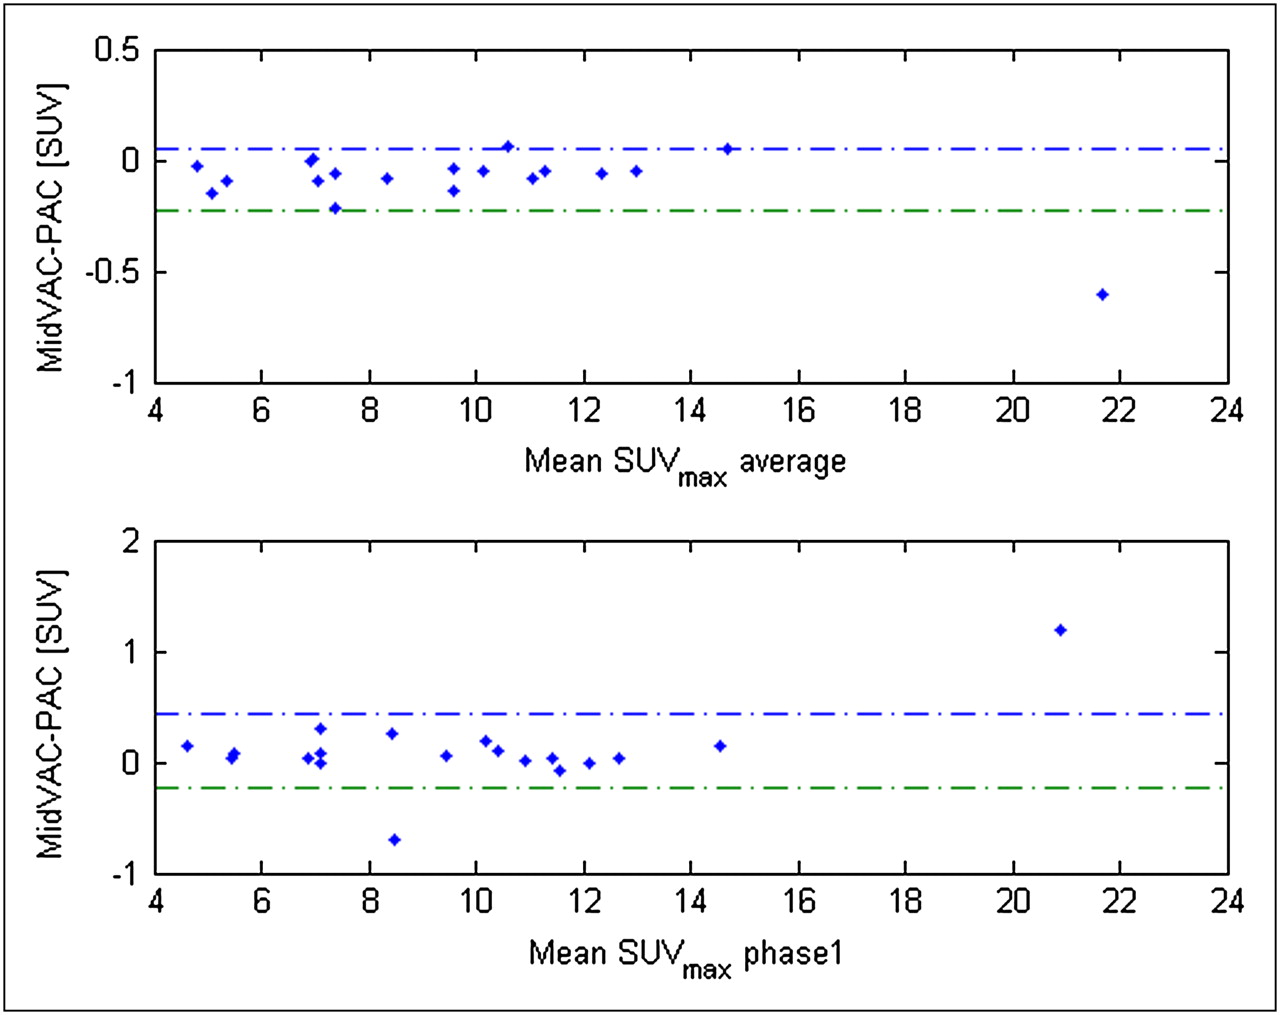
Patients 5, 6, 10, and 17 have large tumor motion and are located in the lower lobes of the lung (with the exception of patient 17). Theoretically, one expects tumor motion to be large in this location because of motion of the diaphragm, but from the literature it is known (30,31) that there is no significant correlation between motion amplitude and tumor location in the lung. For the tumors of patients 5, 6, 10, and 17, a large difference was not found between PAC and MidV-AC for SUV, SNR, and contrast, although somewhat larger differences were found for tumor volume. In Figures 3 and 4, the absolute difference between MidV-AC and PAC against the mean of the 2 methods is plotted for average and phase 1 values of SUVmax and volume with 95% limits of agreement (dashed lines). Although for SUV no clear relationship between the difference of the 2 methods and the magnitude is seen, high tumor volumes (>40 cm3) tend to have larger absolute differences than the low volumes. However, with the exception of patient 5, these differences were never larger than 1.4 cm3, corresponding to a 1.8% relative difference.

Bland–Altman plots showing absolute difference between MidV-AC and PAC against mean SUVmax in tumor per patient for average and phase 1 values. Blue and green dashed lines represent, respectively, upper and lower 95% limit of agreement.

Bland–Altman plots showing absolute difference between MidV-AC and PAC against mean tumor volume per patient for average and phase 1 values. Blue and green dashed lines represent, respectively, upper and lower 95% limit of agreement.
For most of the patients, values averaged over all phases and the phase 1 values differed independently of the AC method.
DISCUSSION
Nagel et al. (23) showed that for phantoms the application of PAC RCPET, compared with non–phase-corrected (NPAC) RCPET, could improve uptake quantification by 9% for a 25-mm motion amplitude (cranial–caudal and anterior–posterior direction) to as much as 20% for a 39-mm motion amplitude. A comparison of differences in volume recovery between the 2 AC methods was not performed.
In the study by Pönisch et al. (25), an inhomogeneous respiration phantom was used, simulating a sinusoidal motion amplitude of 20 mm in the cranial–caudal direction and 5 mm in the anterior–posterior direction. They found that with PAC, the volume determined with RCPET was 0.5% larger than the true volume, and with NPAC volume recovery ranged between 0.8% larger and 8% lower than the true volume, depending on the moment of the start of the CT scan. Maximum recovered activity within the phantom was between 4% and 10% larger with NPAC than with PAC, in contrast to the study by Nagel et al., which showed less recovered activity with NPAC than with PAC.
For the 19 patients analyzed in this study, only activity values obtained with PAC differed significantly from those obtained with MidV-AC, although the difference was not more than 1% on average. For image quality (SNR and contrast) and volume determination, the difference was not significant (P ≥ 0.2). For the patients with high tumor volumes (>40 cm3), the absolute difference between the 2 correction methods tends to increase; however, with the exception of patient 5, the relative difference for these patients was not more than 1.8%. Furthermore, no specific relation was seen between the absolute difference and the magnitude for SUVmax.
The differences between the phantom studies mentioned earlier and the results from this study can be explained by the following reasons. First, Nagel et al. (23) used a homogeneous spheric phantom placed in air. A lung tumor is surrounded by different tissue types, including normal lung (which does not equal air), emphysematous bullae, fibrosis and inflammation, bone, muscle, and blood vessels. For a moving tumor, not all the surrounding attenuating tissue will move at the same degree as the tumor. As shown by a recent simulation study of Hamill et al. (24), the location of the tumor in the lung has a large influence with respect to the attenuation of the surrounding tissue. In lung, for example, errors in AC due to tumor motion are less than for tumors located close to the liver. For patients with a tumor close to the diaphragm or the liver, PAC could still play an important role because the more dense moving structures near the liver have a much larger effect on attenuation and this is also the area in which one would theoretically expect tumor motion to be in phase with diaphragm motion. No specific correlation of the effect of PAC with tumor location was found. This is in agreement with previous studies that found no correlation between the 3D tumor motion vector and tumor location in the lung (30,31).
It is clear that the effect of PAC increases with larger tumor motion amplitudes. In the studies by Nagel et al. (23) and Pönisch et al. (25), motion vectors larger than 20 mm were tested. This degree of motion helps to demonstrate the benefit of PAC; however, tumor motion amplitudes larger than 20 mm are rarely seen in our daily clinical practice. The largest tumor motion vector found in this study was 15 mm.
Furthermore, for precise AC, correct matching of the PET and the CT is essential. This is, however, a difficult task to fulfill in current daily clinical practice. Since the introduction of hybrid PET/CT scanners, the PET and CT images are acquired with minimal movement of the patient between the PET and the CT scan. However, with respiration-correlated scanning, the location of the tumor and surrounding anatomy in a CT phase should also match that of the PET image of the corresponding phase. Therefore, in addition to the need for a similar positioning of the patient during the 2 scans, a similar breathing pattern during the scans is also normally considered essential.
For a regular sinusoidal signal for a phantom, this is relatively easy to achieve as was shown by Pönisch et al. (25). Patients, however, often show an irregular breathing pattern. An RCCT scan often performed at the beginning of a scanning session requires a maximum of 1–2 min to acquire the RCCT data. Patients may have been somewhat more stressed at the time RCCTs were performed, resulting in a different breathing pattern during the RCCT than during the RCPET scan, which takes much longer, and thus allows the patient to relax and breathe normally.
Although several studies have investigated the use of advanced binning methods, which are able to handle irregular breathing patterns (32,33), currently available clinical software and hardware has the limitation of still relying on basic amplitude- or phase-binning methods, as was also the case in this study. However, although averaged over all phases, differences between PAC and MidV-AC were small, and phase 1 values, which are less influenced by the use of different binning methods (Fig. 1), did not differ much. For most patients, values averaged over all phases were different from the phase 1 values; however, these difference were not caused by the AC method.
We have shown that despite all the drawbacks of the currently available RC software and hardware in the Siemens PET/CT scanners, MidV-CT can be used for attenuation of RCPET for a large portion of lung cancer patients.
The limitations of currently used available clinical software, such as the different binning methods for RCPET and RCCT reconstruction, first have to be solved to obtain the full benefit of PAC RCPET. In that case, the use of full PAC RCPET for individual phases could be advantageous for large tumor motion and tumors close to the diaphragm.
However, in the current clinical setting, averaging over all phases is more relevant, and most of the over- and underestimation of the attenuation with the MidV-CT will most probably cancel out.
CONCLUSION
In this study, we showed that the differences between the PAC and midventilation correction for RCPET are small for a group of lung cancer patients. With the currently available clinical software, the benefit of PAC for RCPET scanning is not clinically relevant for most patients, and AC using the MidV-CT for RCPET provides similar image quality and is a fast and suitable method to implement in daily clinical practice. Only if current clinical binning and reconstruction software are improved substantially might the application of PAC RCPET improve image quality and volume and SUV quantification.
Acknowledgments
We thank Siemens Medical Solutions for providing financial and technical support for this study.
Footnotes
-
↵* Contributed equally to this work.
-
COPYRIGHT © 2009 by the Society of Nuclear Medicine, Inc.
References
- Received for publication June 2, 2009.
- Accepted for publication October 7, 2009.


