


Abstract
The superiority of PET/CT and 18F-FDG imaging in cancer assessment has created the need in rural community hospitals to acquire this technology. However, high cost and lack of patient volume have prohibited these institutions from attaining in-house scanners. By using mobile PET/CT scanners, small rural hospitals are able to deliver this valuable clinical tool to their patients. As mobile PET/CT scanners are shifted from one site to another, however, they are exposed to harsher and frequently varying ecologic conditions that can alter their performance. Because of the importance of the standardized uptake value in cancer evaluation and its linear relationship to the sensitivity of the scanner, we investigated conditions affecting the sensitivity of the mobile PET/CT scanner. Methods: We used a 68Ge cylindric phantom with 2 bed frames scanned for 3 min each to simulate a patient to assess quantitatively the influence of location, increase in scanner internal temperature, idle time, and normalization on the sensitivity of the mobile PET/CT scanner. The raw phantom data were acquired and reconstructed with the parameters used for oncology patients. The scanner sensitivity values (Bq/mL) were obtained from circular regions of interest drawn on the phantom images. These values were compared with the true phantom activity concentration after it was decay-corrected to the specific scanning day. Results: The average sensitivity errors (mean ± SD) of this mobile PET/CT scanner at sites 1–4 were 1.84% ± 0.98%, 2.43% ± 2.05%, 2.08% ± 0.91%, and 4.34% ± 1.93%, respectively. A 41.17% increase in the scanner internal temperature decreased its sensitivity by an average of 16.09% ± 3.58%. After day 1 and day 2, its average sensitivity errors were 3.27% ± 0.01% and 2.65% ± 0.02%, respectively. Before and after normalization, the average sensitivity errors were 3.06% ± 1.37% and 2.69% ± 1.69%, respectively. Conclusion: Temperature and normalization affected the sensitivity of the scanner the most and should be monitored closely, with normalization performed as recommended by the manufacturer.
- instrumentation
- molecular imaging
- PET/CT
- quality assurance
- mobile PET/CT sensitivity
- parameters affecting sensitivity
Mobile PET/CT scanners (1,2) have allowed small community hospitals to offer molecular imaging technology to their patients without the heavy financial burden of operating an in-house scanner. Unlike fixed PET/CT machines, however, mobile scanners are constantly moved from one small health care institution to another. This frequent shifting of the mobile PET/CT scanner from one site to another, sometimes under unusual and harsh conditions, can degrade the scanner performance characteristics. Because of the importance of the semiquantitative standardized uptake value (SUV) (3) in cancer assessment (4–6) and its linear relationship to the sensitivity of the scanner, we quantitatively evaluated the effect on sensitivity of the following factors for the mobile Reveal RT PET/CT scanner (Siemens) (7): location (at 4 random rural hospitals); an inadvertent increase in the internal temperature of the scanner by 41.17%; idle time (on 2 successive days, at a single location and for 19 consecutive months); and normalization. Because some cancer patients obtain their baseline scans at one health care institution and follow-up scans at other sites, consistency in the sensitivity of the mobile PET/CT scanner becomes critical when SUVs are compared for treatment assessment. Also, a mobile PET/CT scanner can serve a community hospital on 2 or more consecutive days, allowing patients to obtain their scans before or after the scanner has been idle overnight, possibly leading to a more stable machine the next day. Although normalization is part of the periodic maintenance schedule of a scanner, it is occasionally overlooked, resulting in potential alterations of the sensitivity characteristics of the scanner.
MATERIALS AND METHODS
The same mobile PET/CT scanner, operating in 3-dimensional mode only, and the same cylindric 68Ge phantom (supplied by the scanner manufacturer) were used in this study. All data collection and analysis used to evaluate the influence of scanner idle time (for day 1 and day 2) and normalization and increase in the internal temperature on the sensitivity of the mobile PET/CT scanner were performed at Phoebe Putney Memorial Hospital. The phantom scans used to quantify the influence of locations on this mobile PET/CT scanner were acquired at 4 rural health care institutions served by the scanner. The phantom volume was 6,189 mL, and its activity ranged from 48.1 to 18.5 MBq (1.3–0.5 mCi). Each phantom scan was performed and reconstructed following the oncology protocol with 2-bed positions scanned for 3 min each (8,9). The CT scans were used to extract the PET attenuation-correction coefficients (10). Scatter, randoms, geometry, and decay corrections were applied to all reconstructed phantom images. Circular regions of interest were drawn on the images to quantify the scanner sensitivity (Bq/mL) at 4 random rural health care institutions, on 2 successive days at a single site for 19 consecutive mo, before and after normalization, and after the internal temperature of the scanner had increased by 41.17% (chiller malfunction). The values of these regions of interest were then compared with the true activity concentration of the phantom, decay-corrected to each scanning day. Because of the fast decline of the sensitivity at the edges of the scanner operating in 3-dimensional mode, only the middle slices were used in the quantification of the scanner sensitivity.
RESULTS
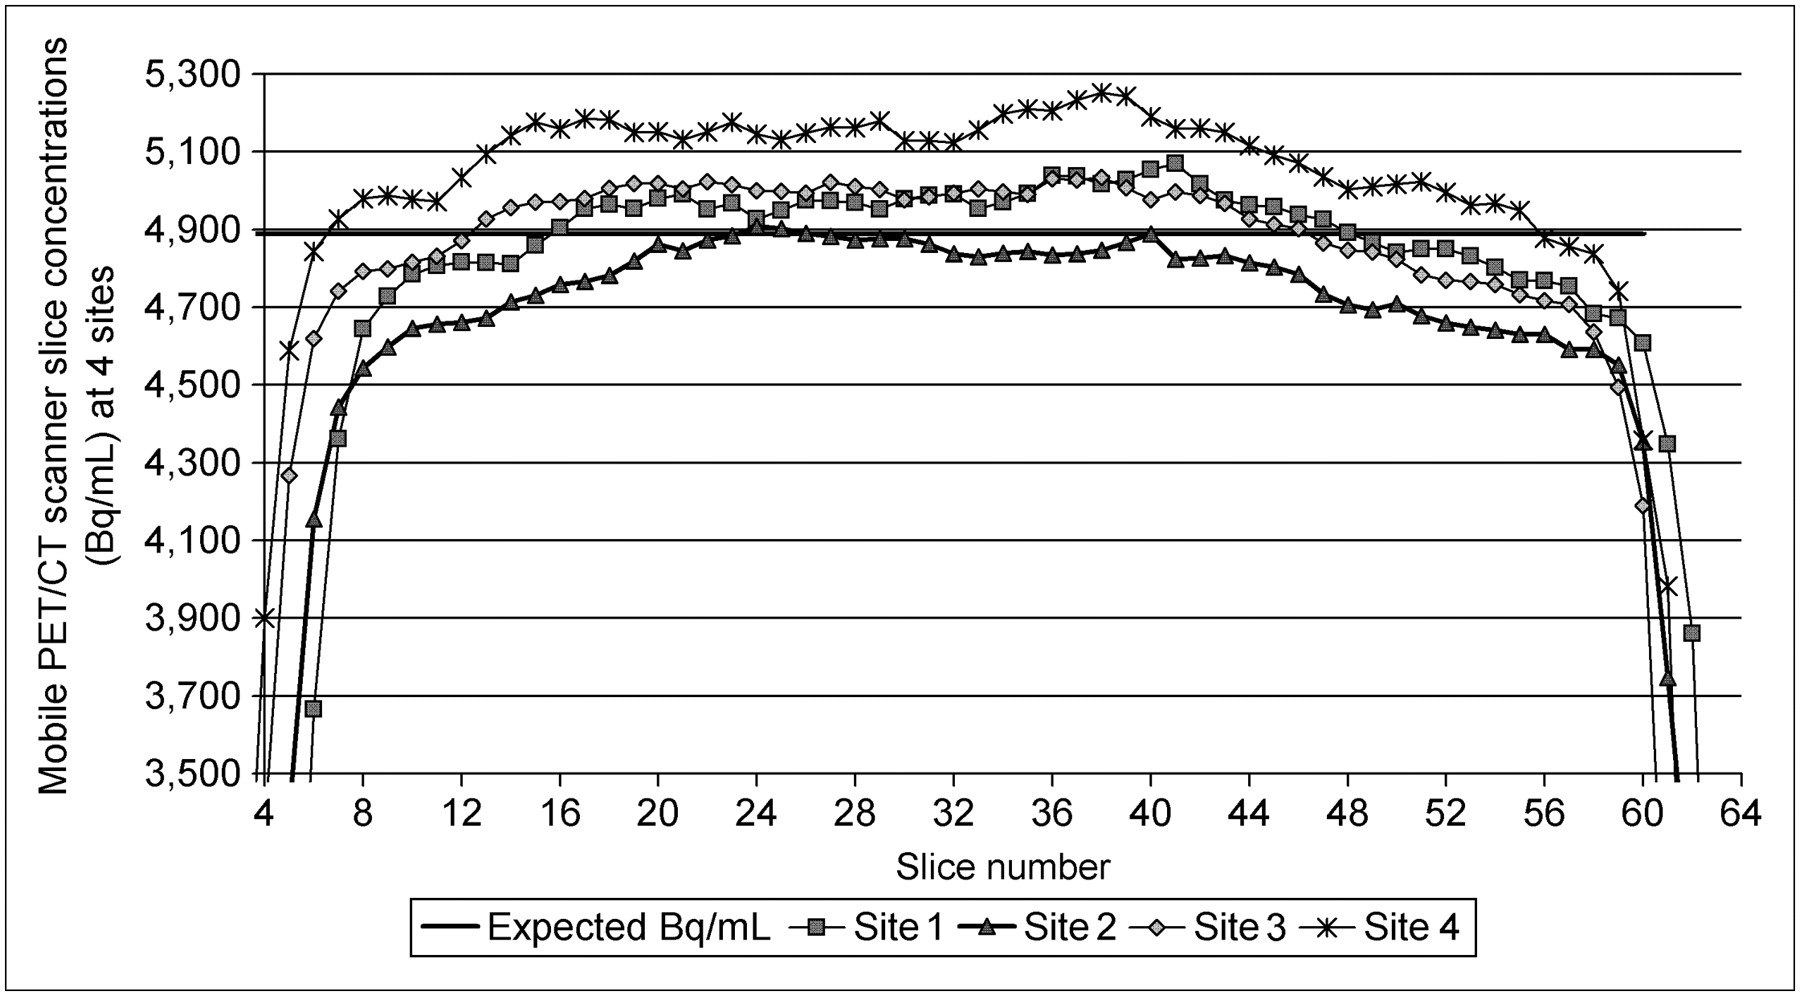
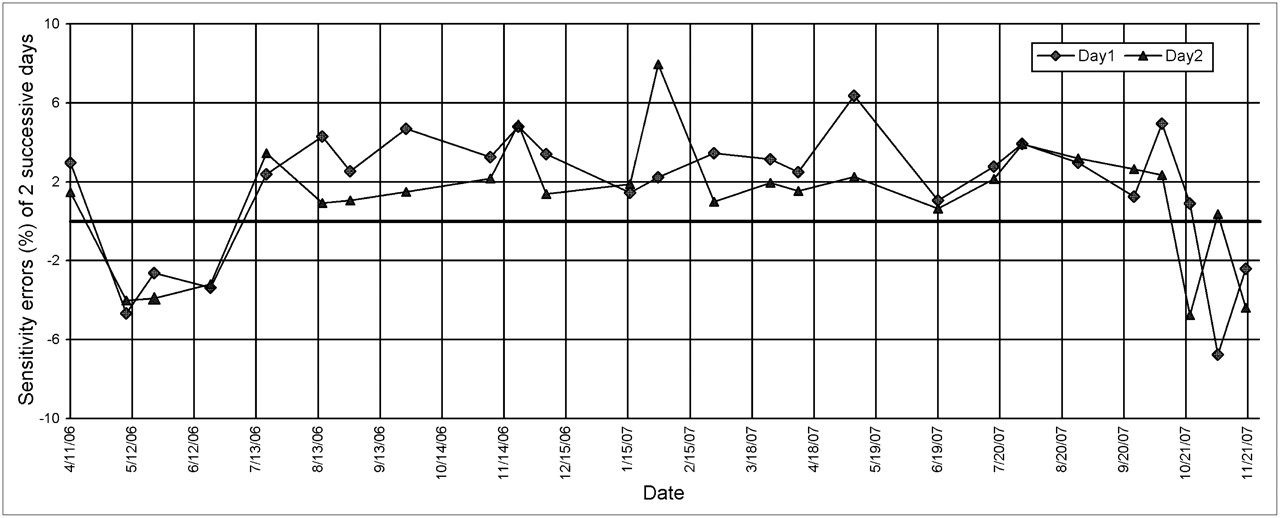
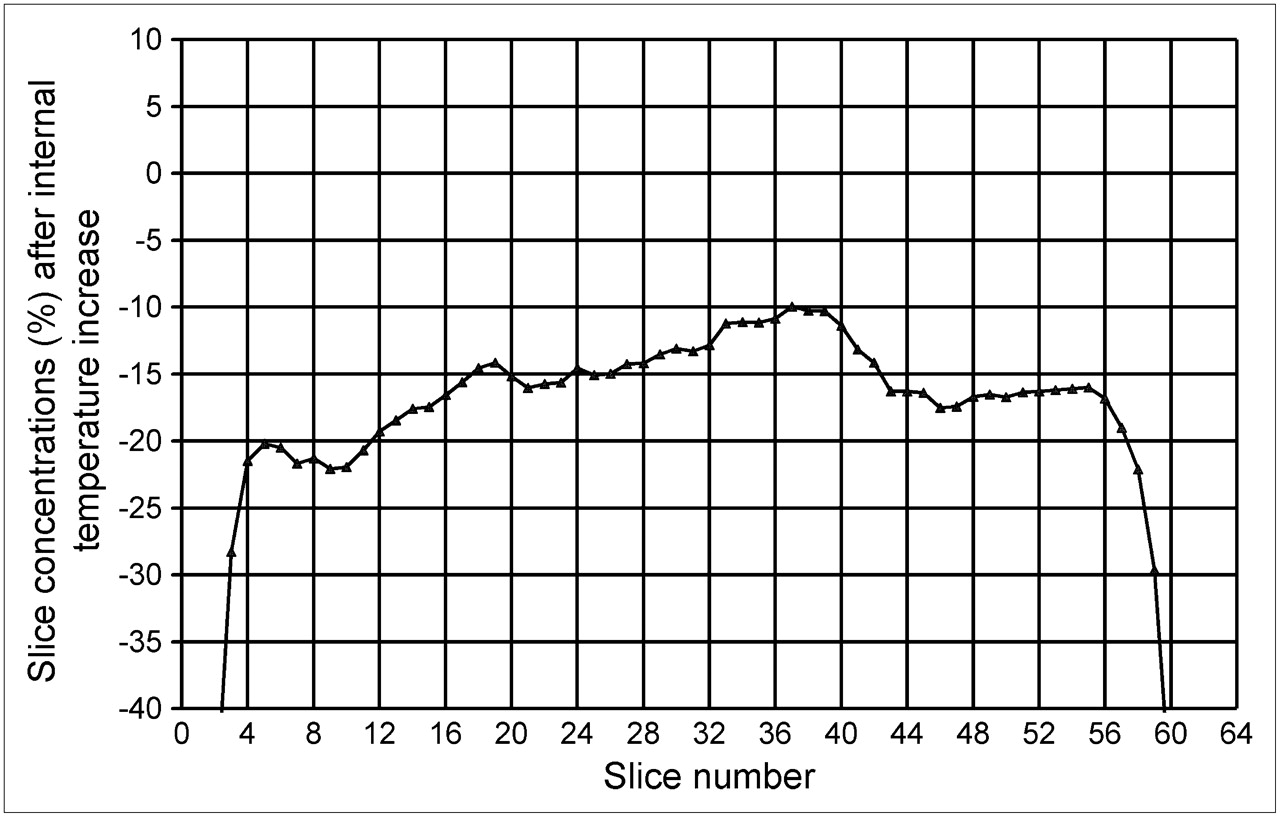
The average sensitivity errors of this mobile PET/CT scanner when assessed at community health care locations 1–4 were (mean ± SD) 1.84% ± 0.98% (range, 0.07%−4.99%), 2.43% ± 2.05% (range, 0.00%−7.03%), 2.08% ± 0.91% (range, 0.29%−5.13%), and 4.34% ± 1.93% (range, 0.20%−7.45%), respectively. An increase in the internal temperature of the scanner by 41.17% resulted in a 16.09% ± 3.58% (range, 9.98%−74.46%) decrease in its average sensitivity. The average sensitivity errors of the scanner at location 3, on day 1 and day 2, were 3.27% ± 0.01% (range, 0.91%−6.75%) and 2.65% ± 0.02% (range, 0.36%−7.95%), respectively. Old and newly performed normalization resulted in average sensitivity errors of 3.06% ± 1.37% (range, 0.10%−5.39%) and 2.69% ± 1.69% (range, 0.11%−4.23%), respectively.
DISCUSSION
Location (Fig. 1) and idle time for day 1 and day 2 (Fig. 2) affected only minimally the sensitivity of the Reveal RT mobile scanner. Temperature (Fig. 3) and normalization (Fig. 4), however, significantly influenced this critical parameter, particularly on the edges of the scanner field of view. The internal temperature of this type of scanner is displayed in real time, in the scanning room, and should be monitored regularly by the technologist. As degradation of the sensitivity was more prominent in the front and back of the scanner, normalization demonstrated greater sensitivity improvement in these 2 regions. The limited number of coincidence plans, used in 3-dimensional-mode acquisition at both ends of the field of view, could explain this edge-sensitivity vulnerability. Although normalization is part of the manufacturer-recommended periodic maintenance schedule, it is sometimes overlooked, resulting in suboptimal performance of the scanner. This study suggests that normalization should be performed at least as recommended by the manufacturer and even more frequently when possible. Stability of the mobile PET/CT scanner sensitivity is critical because baseline and follow-up SUVs, which are compared in cancer assessments, are sometimes obtained from imaging performed at different locations or at the same site but on different days of the week. The maximum variability of 7.95% in the scanner sensitivity on day 2 suggests that patients should be imaged on similar days of the week, when possible. We showed in an earlier study (11) that visual inspection of the phantom images alone was not enough to ensure proper sensitivity performance of the scanner. In this study, the large decrease in the sensitivity of the scanner after the chiller malfunctioned was not reflected on the reconstructed images. It was the quantification of the slice concentrations that revealed the decrease in the sensitivity that led to chiller malfunction.

Slice concentrations (Bq/mL) extracted from reconstructed images of data acquired with mobile PET/CT scanner on 2-bed-frame cylindric phantom at 4 random community hospitals. Slice concentrations from 4 locations demonstrated similar pattern, with center slices of scanner exhibiting better homogeneity.

Average sensitivity errors of Reveal RT Mobile PET/CT scanner, obtained over 19 consecutive mo, on day 1 and day 2, at our community health care center. Minor improvement is noticeable in average sensitivity of scanner on day 2.

Increase in internal temperature resulted in significant and nonuniform decrease in slice sensitivity of scanner.

Normalization improved sensitivity of mobile PET/CT scanner significantly, particularly at edges of field of view. norm = normalization.
CONCLUSION
In this study, we found that normalization and the internal temperature of the scanner affected extensively the sensitivity performance of the scanner. Therefore, the nuclear medicine technologist should perform normalization as recommended by the manufacturer and monitor closely the scanner internal temperature.
Footnotes
-
COPYRIGHT © 2008 by the Society of Nuclear Medicine, Inc.
References
- Received for publication March 17, 2008.
- Accepted for publication April 16, 2008.


Jump to section
Related Articles
Cited By...
- No citing articles found.