


Abstract
Quantitative nuclear renography has numerous potential sources of error. We previously reported the initial development of a computer software module for comprehensively addressing the issue of quality control (QC) in the analysis of radionuclide renal images. The objective of this study was to prospectively test the QC software. Methods: The QC software works in conjunction with standard quantitative renal image analysis using a renal quantification program. The software saves a text file that summarizes QC findings as possible errors in user-entered values, calculated values that may be unreliable because of the patient's clinical condition, and problems relating to acquisition or processing. To test the QC software, a technologist not involved in software development processed 83 consecutive nontransplant clinical studies. The QC findings of the software were then tabulated. QC events were defined as technical (study descriptors that were out of range or were entered and then changed, unusually sized or positioned regions of interest, or missing frames in the dynamic image set) or clinical (calculated functional values judged to be erroneous or unreliable). Results: Technical QC events were identified in 36 (43%) of 83 studies. Clinical QC events were identified in 37 (45%) of 83 studies. Specific QC events included starting the camera after the bolus had reached the kidney, dose infiltration, oversubtraction of background activity, and missing frames in the dynamic image set. Conclusion: QC software has been developed to automatically verify user input, monitor calculation of renal functional parameters, summarize QC findings, and flag potentially unreliable values for the nuclear medicine physician. Incorporation of automated QC features into commercial or local renal software can reduce errors and improve technologist performance and should improve the efficiency and accuracy of image interpretation.
Medical errors are reported to kill as many as 98,000 people every year in the United States, and preventable errors cost at least $9 billion annually (1). Efforts to reduce or eliminate medical errors are proceeding on multiple fronts, but progress has been slow (2). In nuclear medicine, much of the effort to reduce medical errors has focused on developing and implementing procedures to minimize the frequency of misadministration. Quality control (QC) of the user interaction with computer software has received much less attention yet is an increasingly important component of nuclear medicine practice, especially in areas such as renal nuclear medicine, in which clearance measurements and software-generated parameters can play a considerable role in scan interpretation (3–13).
A number of quantitative values may be used in the scintigraphic evaluation of renal function. For example, the Santa Fe consensus report and the Society of Nuclear Medicine procedure guideline on renovascular hypertension recommend measurements of time to maximum counts (Tmax) and 20-min/maximum count ratios for whole kidney and cortical regions of interest (ROIs) to assist in the interpretation of angiotensin-converting-enzyme inhibition renography (6,7). Müller-Suur et al. recommend measurement of 99mTc-mercaptoacetylglycine (MAG3) clearance before and after captopril administration to further assist in the detection of renovascular hypertension (8). The 20-min/2- to 3-min count ratio has been proposed as a useful parameter to simultaneously evaluate clearance and excretion and may be especially useful in monitoring transplant patients to distinguish between acute tubular necrosis and rejection (9). The time from peak to half-peak counts (T½) is a measurement commonly used to assist in the interpretation of diuresis renography (10,11). A measurement of urine drainage based on a quantitative comparison of prevoiding or postvoiding kidney counts to the 1- to 2-min or maximum counts obtained during the prevoiding period improves sensitivity and specificity for detecting an obstructed kidney (4,12,13). Finally, the postvoiding urine volume can easily be determined at the time of the scan and may provide important additional information on excretory function (3). Technical factors and errors occurring in the user–software interaction have the potential to result in erroneous or unreliable values that may, if unrecognized, lead to an incorrect interpretation of the study.
In the process of developing a decision support system (RENEX) to assist physicians in the interpretation of diuresis renography in adult patients (14), we recognized a need to perform automatic QC checks to verify that input data were reliable. To address this need, we developed a QC module to help detect errors in data entry, image acquisition, ROI assignment, and processing as well as erroneous or unreliable values due to poor renal function (15). The goal of this prospective study was to apply the QC module in a clinical setting to determine the number, type, and frequency of errors that could be detected or prevented.
MATERIALS AND METHODS
Patients
To test the performance of the QC software module prospectively, we used a group of 83 consecutive nontransplant clinical patients consisting of 40 men (mean age ± SD, 57 ± 17.6 y) and 43 women (mean age, 48 ± 14.0 y). The present study was restricted to adults because camera-based 99mTc-MAG3 clearances have not been validated in patients less than 18 y old.
The patients received a mean dose of 337 MBq (10.2 mCi) of 99mTc-MAG3. Patient studies were processed by a technologist who was not involved in software development. All demographic and dose information for each patient was entered manually for calculation of camera-based renal clearance. After processing had been completed, the output files were used to tabulate the number of QC events detected.
Data Analysis
All patient studies were processed using QuantEM-II, an enhanced version of the commercially available QuantEM (GE Healthcare) renal quantification software program (16). QuantEM was developed specifically for 99mTc-MAG3, generates specific quantitative parameters recommended for scan interpretation, allows 99mTc-MAG3 clearance to be calculated using a camera-based technique, and was previously validated extensively in a multicenter trial (17). The QC module is intended as an adjunct to the existing QuantEM-II software and was integrated into this enhanced version of the program.
QC Module
The QC module was developed to address potential errors at 3 points in the handling of data: when input data are first submitted to the processing program, when images are processed and calculations performed, and when output data are displayed for review. This module was programmed using Interactive Data Language (Research Systems, Inc.).
Any parameter that the QC module detects as a potential error in image acquisition, processing, or other aspects of the study is labeled as a “QC event.”
QC events can be classified as technical or clinical. Technical events relate to data entry, image acquisition, and ROI assignment. Clinical events reflect elements of the patient's anatomy and renal function that may cause certain calculations to be misleading or incorrect.
Technical QC Events.
The QC module monitors the input of patient demographics, radiopharmaceutical doses, and urine voiding times. These items are entered by the user at a dialog window. Each item has a textual prompt, a place to enter the value, and a drop-down list to indicate the units. For all user-entered data, the program attempts to detect errors in order to allow for their correction. For each user-entered item, there are 3 possible QC events. Any value that causes the entry dialog to be redisplayed will first generate a “trigger” event. If values are entered and then changed, this is recorded as a “change” event. If the final value is determined to be outside an expected range, then an “out-of-range” event is recorded.
When an entered value is determined to be definitely wrong or outside an expected range, the dialog window is redisplayed with the value in question highlighted. Figure 1 shows an interface example in which an unusually high patient weight has been entered.
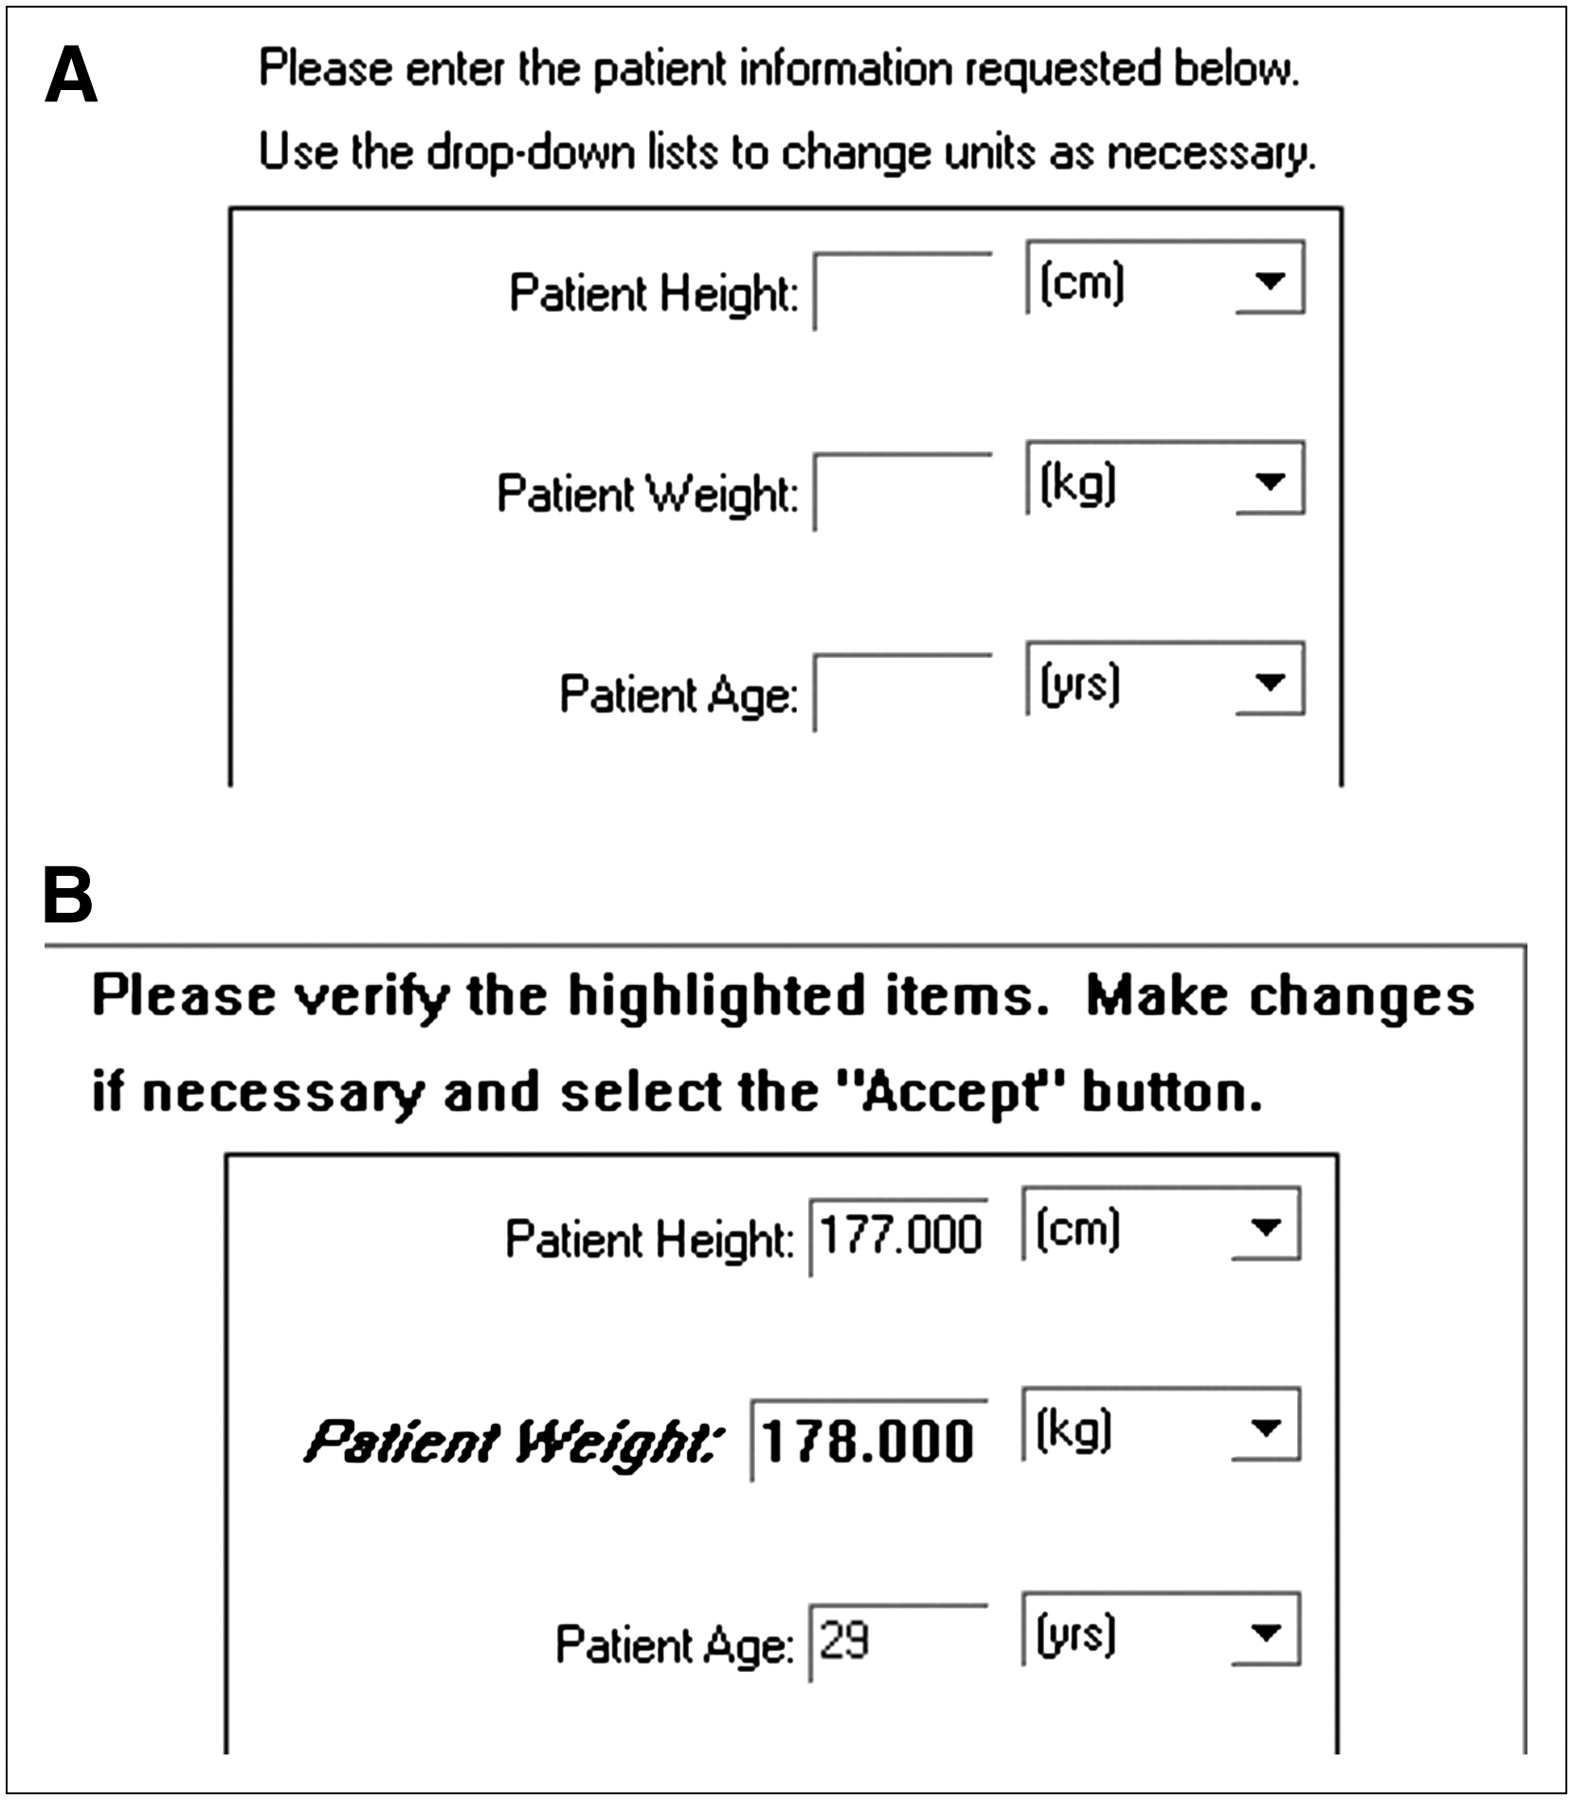
(A) QuantEM-II software displays dialog box that asks user to enter patient's height (cm), weight (kg), and age (y). Technologist entered 178 kg as patient's weight. (B) After entry, QC software highlights questionable weight and gives user option of changing weight if 178 really referred to pounds rather than kilograms.
Internally, the QC module sets a system variable to a specific value (a “flag,” in computer terminology) when any QC event is detected. These values can later be gathered and tabulated.
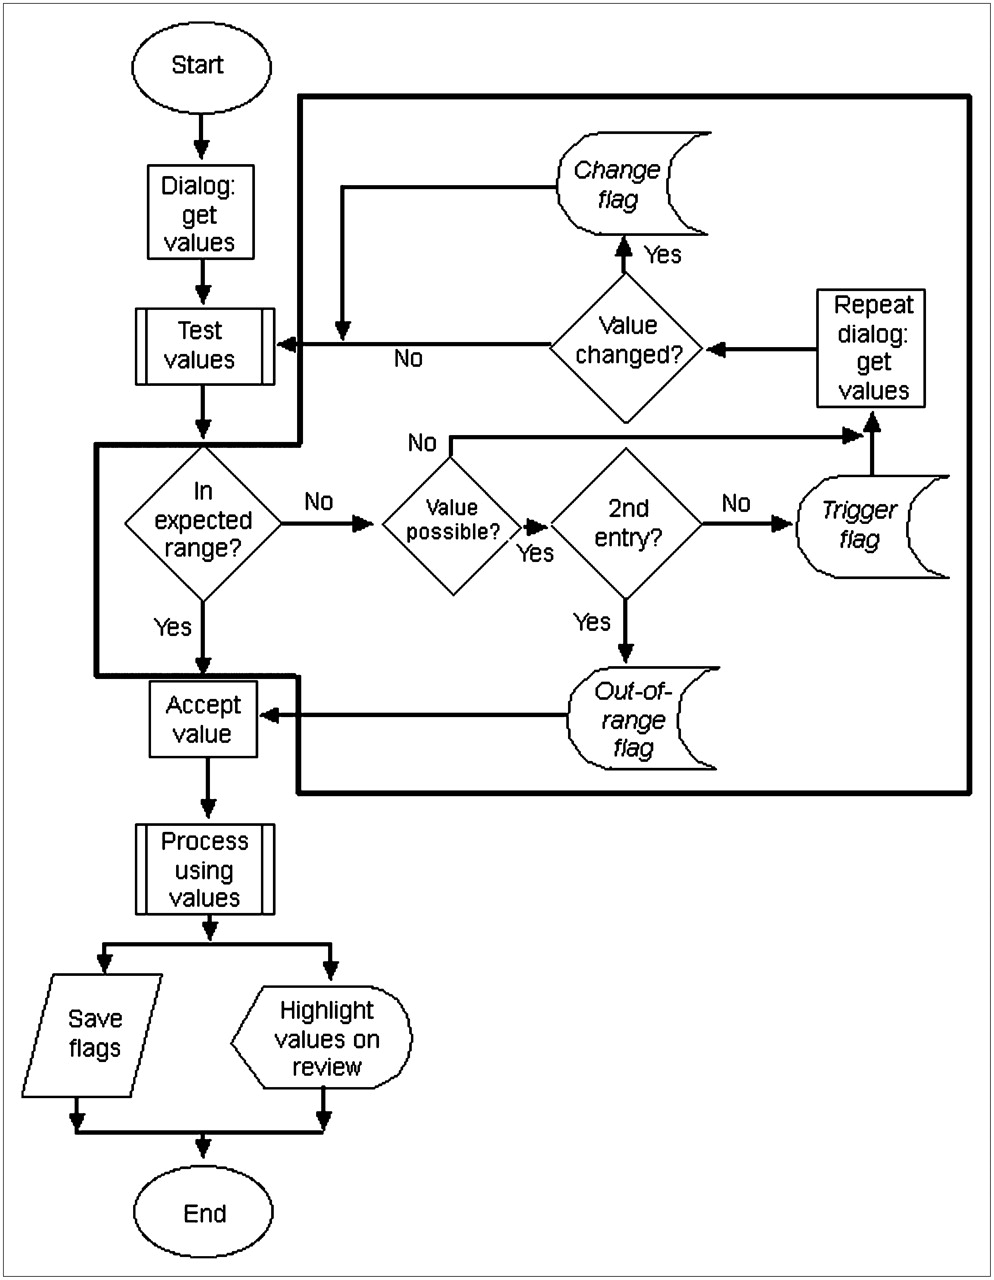
All entered values are tested for appropriateness using an algorithm, which is summarized in Figure 2. Once the user has been given an opportunity to change potentially erroneous values, the QC module must decide how to proceed. Erroneous values, such as negative numbers, are not accepted by the program. The dialog will be redisplayed until a valid entry is made.

Algorithm that is followed when values are input by user. Area within black outline represents QC-related steps. There are 3 opportunities for QC event (flag) to be set when values are entered and tested: when value is detected on entry to be outside expected range (trigger flag); when value is changed by user (change flag); and when final, accepted value is outside expected range (out-of-range flag). These are indicated on flowchart by italicized type.
Calculation of renal clearance by the camera-based method requires accurate measurement of the injected dose of 99mTc-MAG3; if the injected dose is large (>148 MBq, or 4.0 mCi), a small dose must be counted on the γ-camera as a standard to avoid dead-time losses (16). The standard (small dose) and the dose to be injected are counted in a dose calibrator, and the ratio between the 2 doses allows the injected counts to be determined. The relative and absolute values of the 2 doses are monitored by the QC module.
Dose values are entered in the processing software to 2 decimal places, taking advantage of the precision of the dose calibrator. It is unlikely that the measured value for either dose will be a whole number, such as “8.00 mCi.” If either dose activity is entered as a whole number, the user has most likely rounded the number for convenience. This entry is flagged as a QC event, because a substantial error in the clearance calculation can result.
If an item is not entered at all, the dialog will also be redisplayed under certain circumstances. For example, camera-based renal clearance requires entry of the radiopharmaceutical dose and the patient height and weight. If some, but not all, of these items are entered, the missing items were probably omitted accidentally by the user. This omission is detected, and the user is prompted to supply the missing data. If, on being given a second chance, the user does not enter a value, the main processing program will simply skip the calculations that require that value.
The initial and final voiding times are the clock times at which the patient voids urine before and after the dynamic acquisition. These voiding times are needed, along with the voided volume, to calculate the urine flow rate. The program places logical constraints on the entered voiding times. The prevoiding time must occur before the start of the dynamic study, the postvoiding time must occur after the end of the dynamic study, and no clock time can be of an hour outside the range 0–23 or a minute outside the range 0–59.
Any user-entered value that is logically permitted but outside the usual, expected range is detected and recorded. Although this entry is recorded as a QC event, the invalidity of the value cannot initially be determined with certainty. In this case, the dialog box is redisplayed only once, so that the user can change that value. If the value is not changed, the program will accept it.
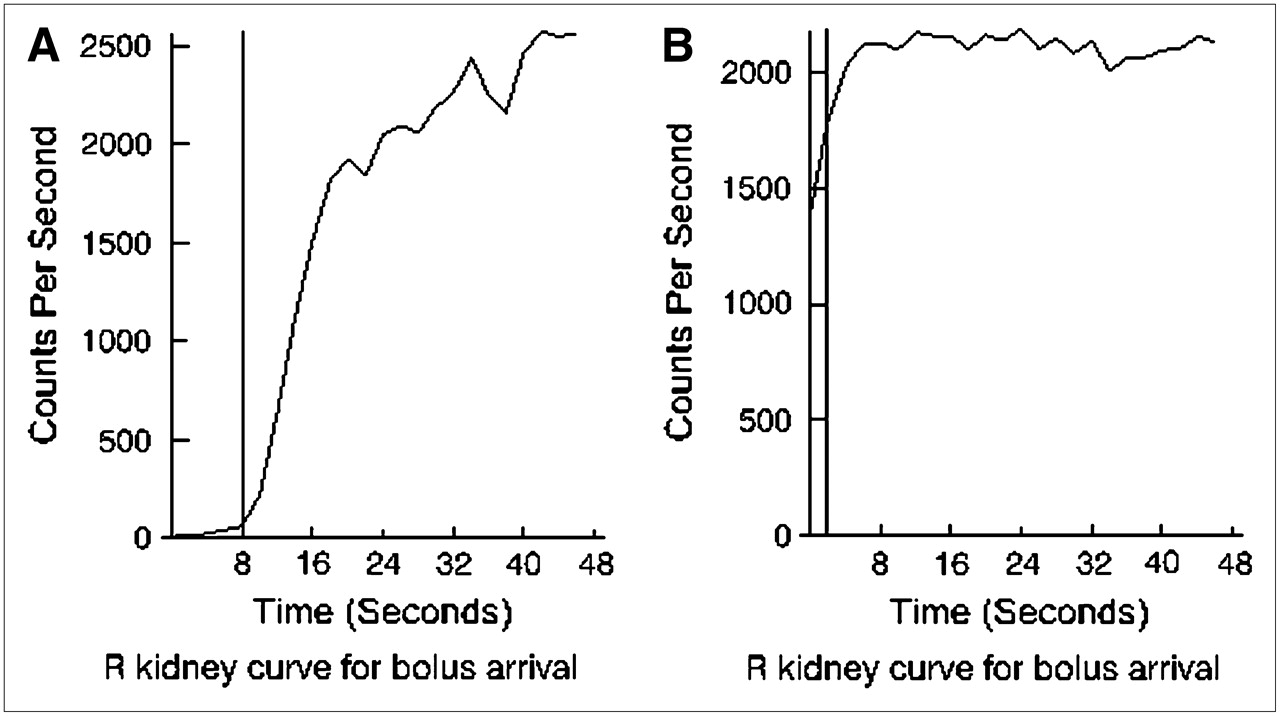
Several items other than data entry are tracked by the QC module. For example, the QuantEM-II software identifies arrival of the radiopharmaceutical bolus by performing a linear fit from 15% to 50% of the peak for the initial part of the renogram curve and then extrapolating to the x-axis. If this extrapolation results in an x-intercept of less than zero, the camera acquisition was probably started too late to detect the bolus arrival, in which case calculated functional values will be less accurate. An example is shown in Figure 3.

Early phase of renogram curve, indicating arrival of radiopharmaceutical bolus in kidneys. (A) In usual case, a fit to upslope of curve is extrapolated to x-axis, and this intercept identifies bolus arrival (vertical line). (B) If camera acquisition was started too late, earliest part of uptake phase will be missing, and bolus arrival cannot be identified with certainty. A default early frame (vertical line) is used in calculations, but accuracy is reduced.
The QC module monitors the dose of furosemide administered. In patients being evaluated for possible obstruction, a reduced clearance value (<30% of that expected) means that obstruction may not be evident if less than 40 mg of furosemide are administered (18).
General aspects of the defined ROIs are monitored. If one whole-kidney ROI is more than 25% larger than the other, or if the injection site ROI is significantly large (>35 cm2), a QC event is recorded. Assuming that camera orientation has been recorded correctly, the QC module can detect that the left and right kidney ROIs have been swapped. This type of error could occur if automatic renal ROIs have failed and one or both kidney ROIs have manually been defined. If this error is detected, the user is alerted and the QC program offers to swap the ROIs back to their proper side. However, it is up to the user to confirm that an error has actually occurred and should be corrected.
Clinical QC Events.
Clinical QC events do not occur as a result of any shortcoming in the acquisition or processing of the study but rather as a result of the patient's physical condition or disease. If renal function is reduced, with prominent liver or spleen uptake of the radiopharmaceutical, the pixel counts included in the background ROIs can be high, causing one or both renogram curves to be overcorrected for background activity. If the renogram curve reaches zero as a result of background correction, a QC event is generated.
Parameters generated by QuantEM that fall outside the reference ranges (19) generally indicate a clinical abnormality. However, times shorter than 1 min for Tmax and 2 min for T½ are too short to represent true renal functional parameters and therefore indicate a technical problem (a common cause is poor renal function resulting in a noisy curve with unreliable parameters).
Body mass index is calculated from the entered height and weight and used to express clearance in a standard manner (mL/min/1.73 m2). If the body mass index is outside the expected range, a QC event is stored.
Some overlap occurs between technical and clinical QC events. For example, patient age could be entered as 12 y. If the correct value is 22 y, this error would be a technical one. However, if 12 y is the true age, a clinical issue exists because the camera-based MAG3 clearance has not been validated in children. Because the clearance calculation of the QuantEM software is intended for use in adults, the QC module uses 18 y as the lower limit of the expected age range. Another example is a small left whole-kidney ROI, which may indicate that the kidney is small and poorly functioning or that a technical error has occurred in the ROI definition, such as the spleen's being mistaken for the left kidney when the left kidney is absent.
RESULTS
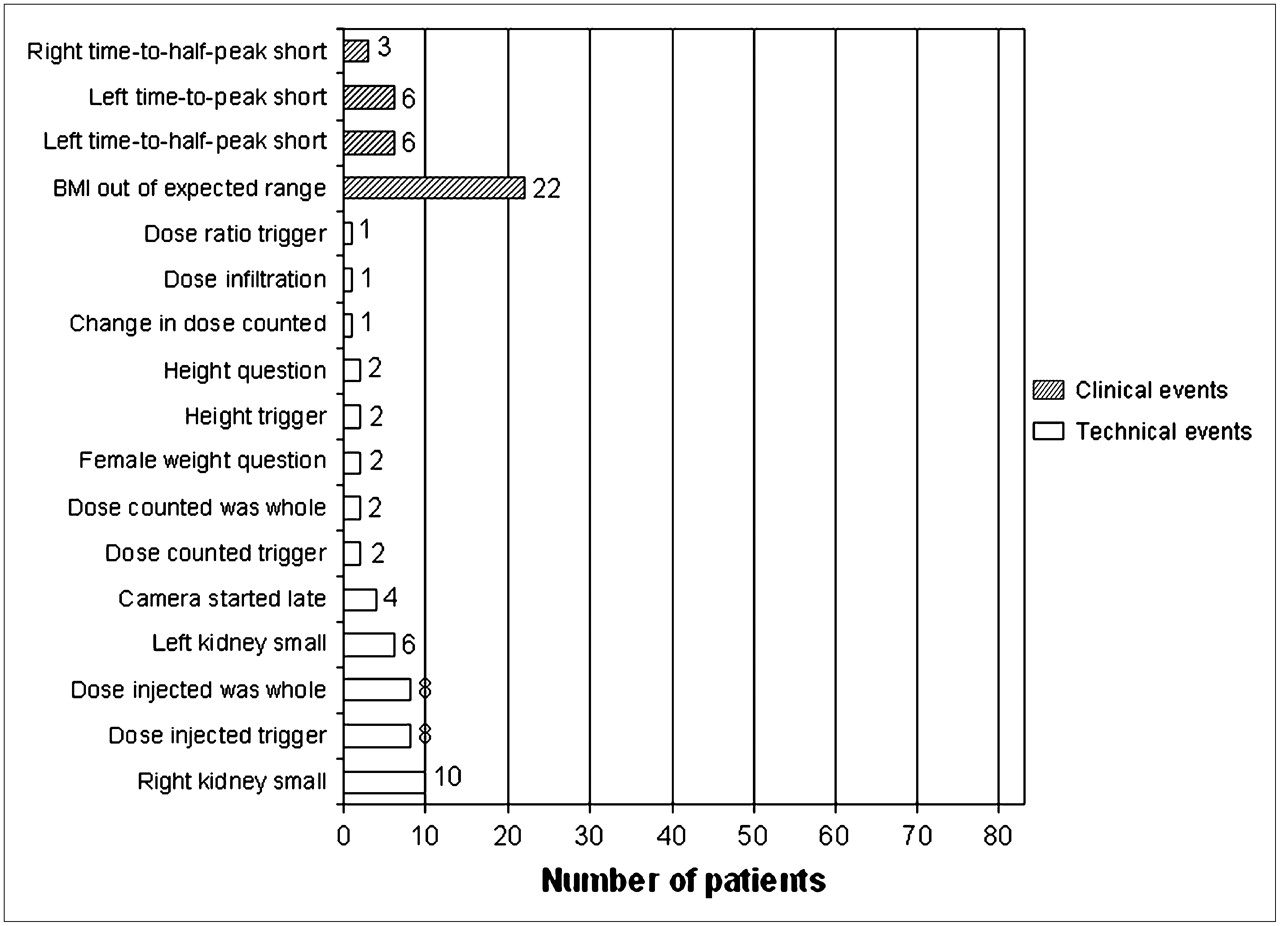
Technical QC events were identified in 49 (59%) of 83 studies, in 36 (43%) of 83 studies when trigger events were excluded, and in 35 (42%) of 83 studies when triggers and change events were excluded. Clinical QC events were identified in 37 (45%) of 83 studies. Excluding triggers, 43 studies (52%) had at least 1 technical or clinical QC event. Fifteen studies (18%) had at least 1 technical and 1 clinical QC event. Detected errors are summarized in Figure 4. The most frequent clinical QC event was a body mass index outside the expected range, and the most frequent technical QC event was a small right kidney. The right whole-kidney ROI was found to be small (>25% smaller than the left whole-kidney ROI), triggering a QC event in 10 (12%) of 83 studies, and the left kidney was smaller than the right in 6 (7%) of 83 studies.

Summary of all technical QC events (white bars) and clinical QC events (hatched bars) that were detected. Trigger events (events initially displayed as being outside expected range) are included; these events occur when an unusual value is entered by user. Purpose of these flags is to trigger redisplay of data entry dialog. Presence of trigger may or may not indicate error, because value may be corrected by user or may have been correct as originally entered. If redisplayed value is accepted by technologist, it is recorded as an out-of-range event.
In 83 studies, there were 163 kidneys; 9 (6%) of the 163 were associated with a QC event likely to affect the validity of a functional parameter. Of these 9 events, 6 were instances of a left Tmax value that was too short, and 3 were instances of a right T½ value that was too short. Other QC events included 4 instances of the camera's being started late and 1 case of infiltration of 1.07% of the injected dose (Fig. 5).
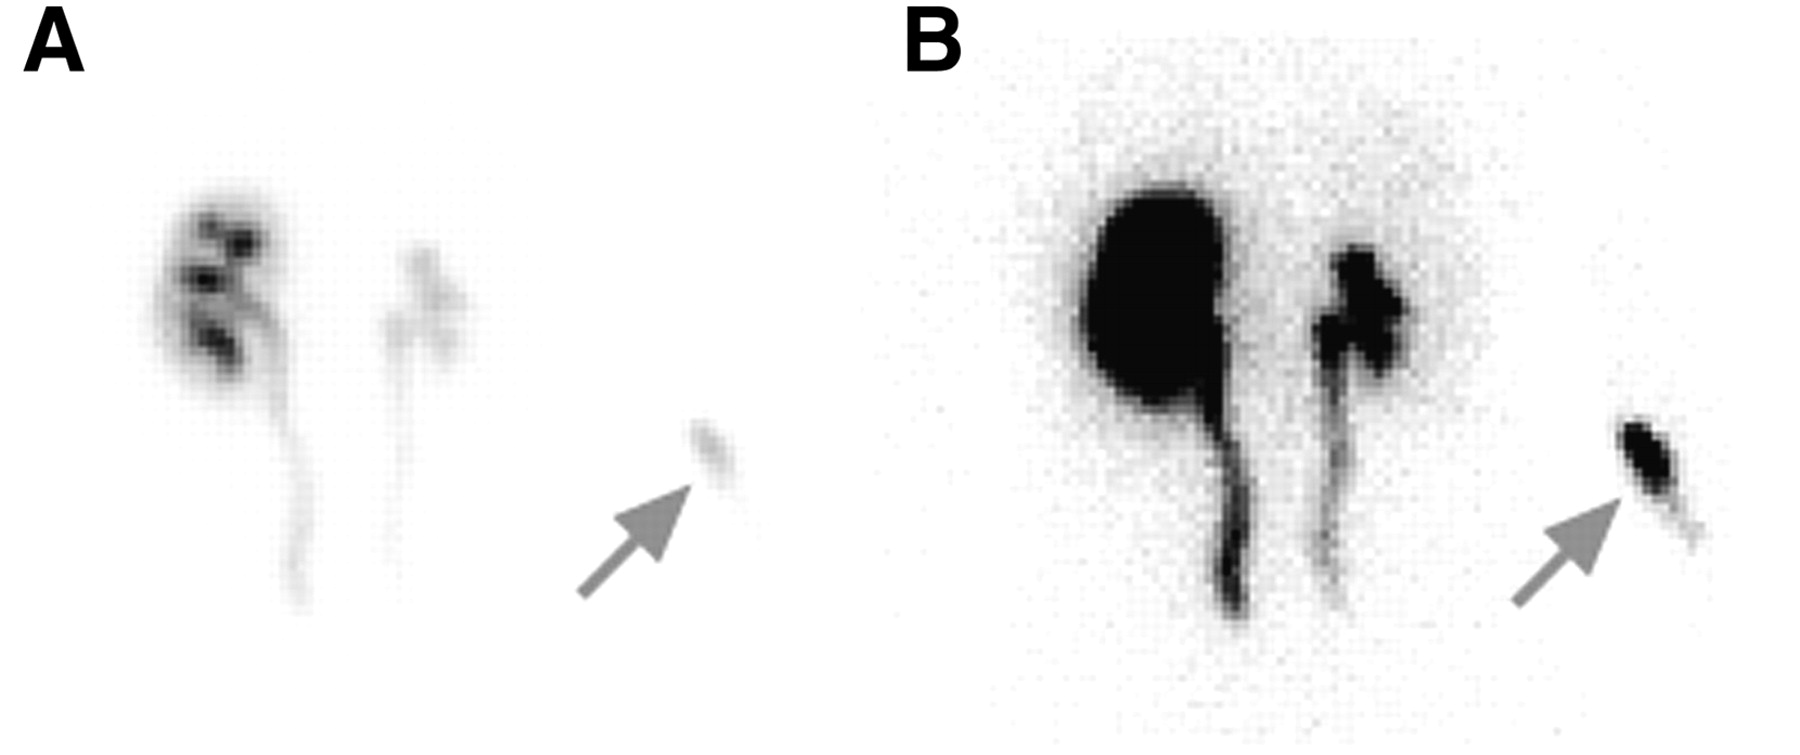
Posterior injection site image from patient determined to have significant infiltration (>1% of injected dose; arrows). (A) Image displayed at default window level, which is scaled to counts in kidney. (B) Window level adjusted to show body outline and to better show injection site in right arm.
DISCUSSION
We previously reported the initial development of a software module for automatically monitoring the QC of the image processing that is part of renographic study analysis (15). The goal of the present study was to evaluate the performance of this QC module in the processing of clinical studies. In a series of 83 nontransplant studies, 43 studies (52%) had at least 1 technical or clinical QC event. This high incidence is due in large part to our broad definition of a QC event, which includes instances in which an entered value was changed or was outside the expected range. As shown in Figure 4, entry of patient demographic values resulted in 26 events, all for height, weight, or body mass index. Although these values were unusual and could have affected study interpretation, all were attributable to patient size. None was suggestive of entry error. Monitoring the entered height and weight is important because these values are used to estimate renal depth, which is necessary to correct for attenuation in the camera-based clearance calculation.
Eleven events were related to user-entered values for the dose counted or the dose injected, with 10 of these being dose values that were whole numbers. This finding was unexpected and may have related to a practice on the part of some technologists of rounding the dose calibrator readings to simplify data entry. This practice could result in a major error. For example, suppose a 30-y-old patient had received a 374.4-MBq (10.12-mCi) injection of MAG3, and a syringe containing 48.5 MBq (1.31 mCi) was counted on the γ-camera. If both doses were assayed in the dose calibrator and entered correctly in the program by the technologist, the calculated MAG3 clearance would be approximately 250 mL/min/1.73 m2, which is in the reference range. However, if the dose values were entered in the program as 370 and 37 MBq (10.0 and 1.0 mCi), respectively, the clearance would be approximately 190 mL/min/1.73 m2, which is falsely low. If the dose values were rounded up, the calculated clearance would be higher, and a reduction in renal function could potentially be missed.
Other QC events included 15 relating to Tmax or T½ values that were too short. These events occurred in only 9 (6%) of 163 kidneys and were not likely to be related to user error.
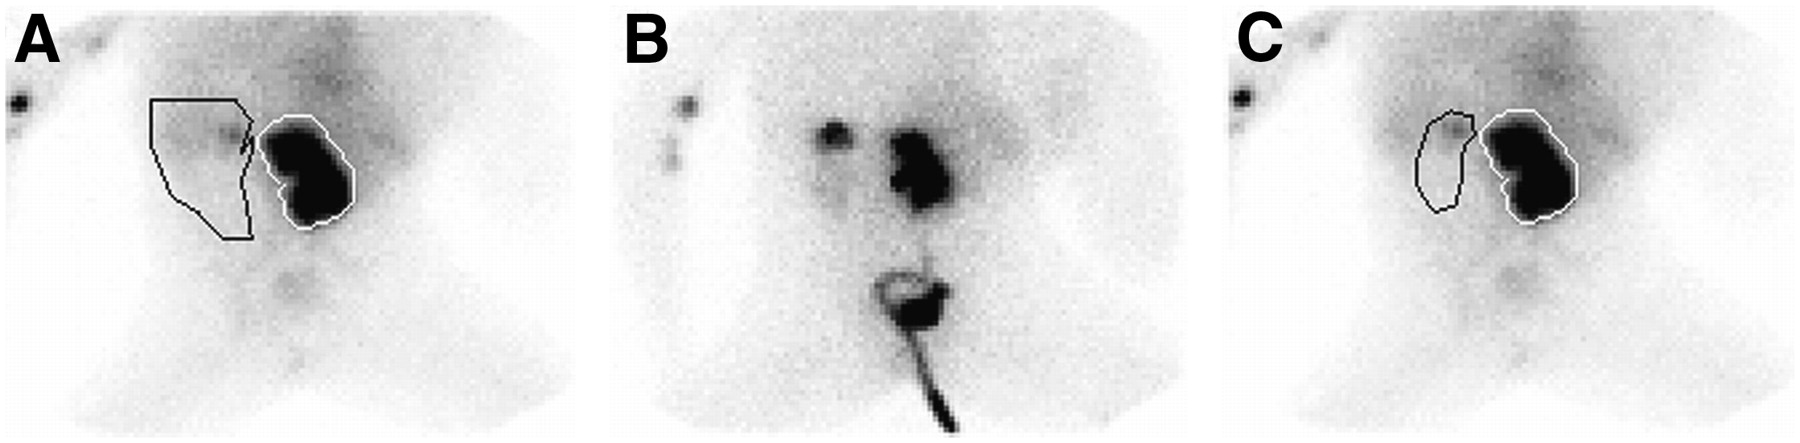
Either the right or the left whole-kidney ROI was found to be small in 16 (19%) of 83 studies. Visual review of these studies showed that, in all but 1 case, ROIs appeared to be assigned appropriately, suggesting that the left–right ROI area difference reflected a real difference in kidney size. In 1 study, the left-kidney ROI was incorrectly defined because of extremely poor function on that side. The original region included the spleen and other background areas that were of the same intensity as the kidney on the 2- to 3-min summed image that was used for ROI definition (Fig. 6). When this region was adjusted on the basis of a visual review of the entire image set, the calculated renal clearance changed from 152 to 138 mL/min and the percentage of relative uptake on the left changed from 11 to 2. The values of these parameters are clinically similar and imply significantly reduced left kidney function. However, correcting the ROI also caused the left Tmax to change from 0.6 to 22.3 min. A time to peak of 0.6 min is lower than expected and would often result from a technical problem with the data, whereas a value of 22.3 min is well above the reference range and is additional evidence of abnormal left-kidney function.

Posterior images from study in which QC event (right-kidney ROI significantly smaller than left-kidney ROI) led to discovery of incorrectly placed left-kidney region. (A) Original region on 2- to 3-min summed image. Little uptake of radiopharmaceutical is seen in left kidney. (B) Nineteen- to 20-min summed image, in which faint outline of left kidney is seen. (C) Two- to 3-min image with redrawn ROI.
One patient had an infiltration of 1.07% of the injected dose. This would not be expected to have a major effect on camera-based clearance but would be more problematic for a plasma clearance calculation, which depends on injection of the entire dose into the plasma as a single bolus.
In 4 patients, the camera was started late. Interpretation was not compromised, but a late start causes an error in the bolus arrival time and can lead to erroneous values for MAG3 clearance and Tmax. A delay in starting the camera would be of greatest concern in a study in which renography results were borderline-normal or abnormal or in which the clinical question is one of the change in renal function compared with a prior study.
The importance of QC in radionuclide renography has long been acknowledged (6,20–22), resulting in recommended procedures such as the use of injection site images to monitor dose delivery (16) and inspection of the entire image study in dynamic format to assess patient motion (22). The issue of QC has been addressed proactively by the use of surveys to promote protocol standardization (23), audits to test calculations derived from the same studies by different institutions (24,25), phantoms developed specifically for renography (26,27), and motion correction software developed for renal images (28). To date, we find no report of computer software for automatic monitoring of renographic image processing.
QC software could be used in several ways. The software module described in this article is currently being used to monitor image processing for renographic studies in our laboratory. We are developing an expert system, RENEX, to be used as a decision support system in the interpretation of nuclear medicine renography (14,29). The availability of objective measures of the quality of a study is expected to enhance RENEX by helping with the discrimination of valid calculations from invalid calculations and by identifying problems that may result in erroneous values, such as dose infiltration and starting of the camera after the bolus has reached the kidney. Figure 7 shows an example of output for the QC module.
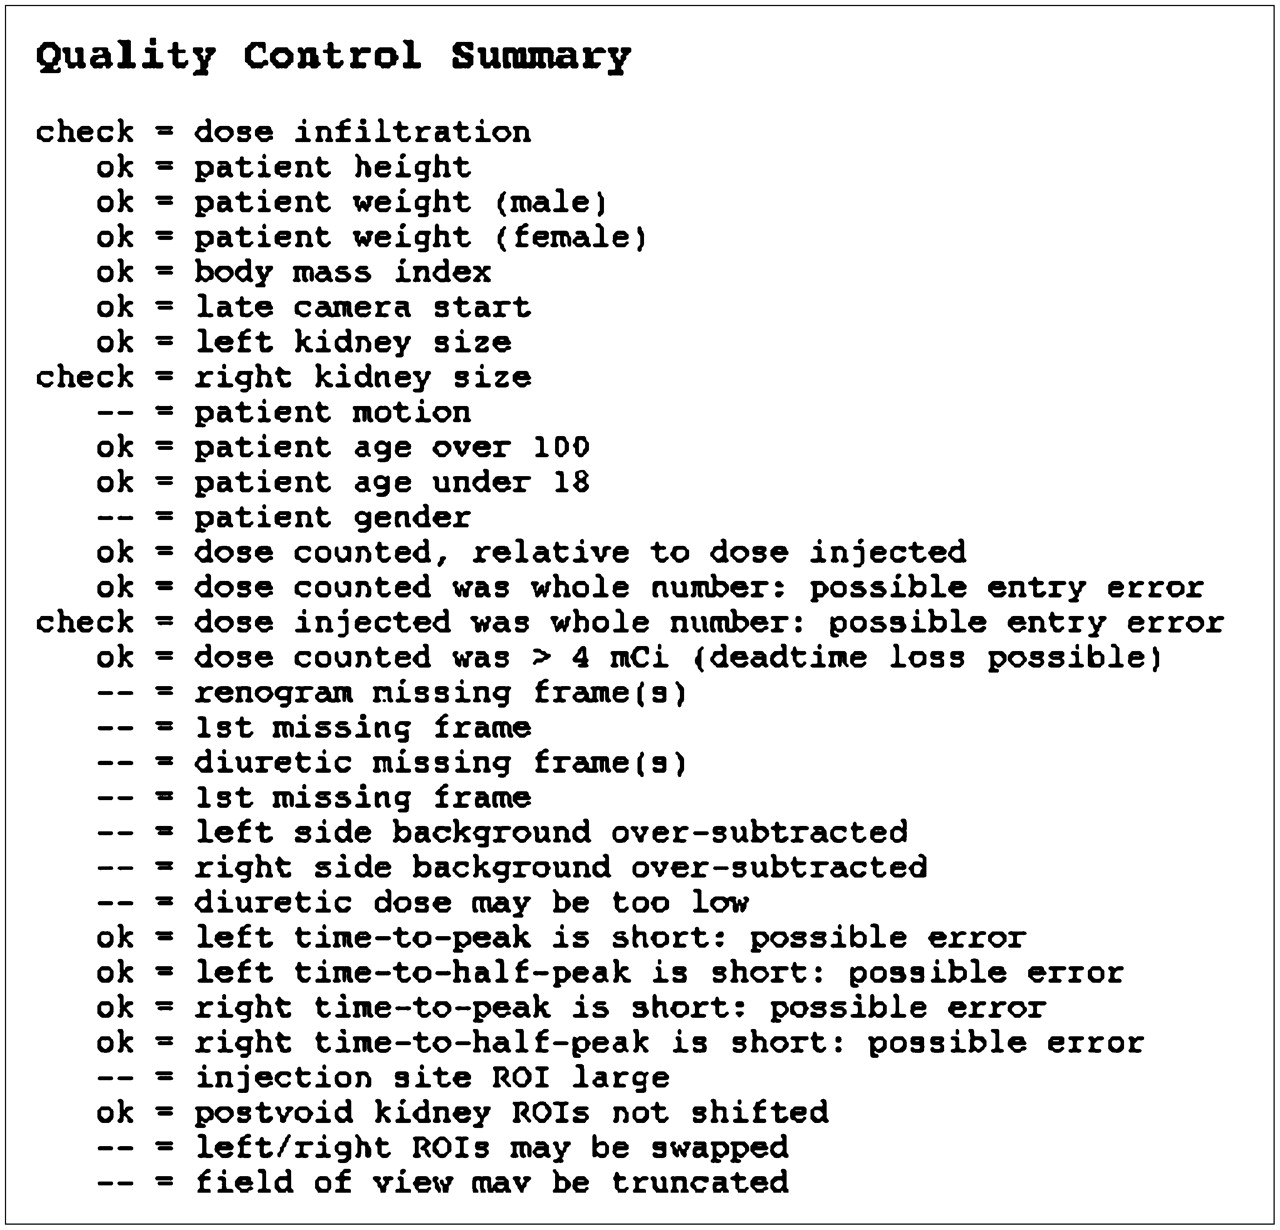
Example output of QC module. As integrated into existing QuantEM-II software, this display is accessed by selecting a button on main review screen. All QC items are listed. Items that were checked without error are indicated by “ok”, whereas those that represent potential errors are indicated by “check”. Items with neither “ok” nor “check” were not verified by QC module. On actual computer display, “ok” items are listed in green text and “check” items in red text, as an additional visual cue.
Analysis of the QC findings may reveal an unsuspected need for technologist training, as was shown in our study when it was discovered that some of the technologists had been rounding off the dose assayed in the dose calibrator to the nearest whole number. Moreover, the software can be used for objective monitoring of the effectiveness of training.
The study had some limitations. Patient height, weight, and age are supplied by the user, and the software cannot know whether these are correct, only whether they are outside the expected range. If the technologist enters a value incorrectly but it falls within the reference range, the entered value will not be recognized as erroneous. A long-term goal is to incorporate demographic information directly from the patient's digital medical record. Because there is no upper or lower limit for urine volume, the software must accept any entered value. The software must also accept any valid clock time for the voiding times (within the logical criteria outlined above).
Factors not monitored by the software may influence the renal functional results as much as, or more than, factors that are monitored. An example is the whole-kidney ROI. If an ROI is inappropriately placed, the clearance or the renogram curve can adversely be affected. In QuantEM-II, the location of whole-kidney ROIs constrains the location of automatic cortical regions. An error in identification of the whole kidney would therefore result in an error—not detected by the QC module—in the location of the cortex.
Patient motion is not addressed in the current QC module and can adversely affect renogram curves and curve parameters because kidney activity will be moving into and out of the defined ROIs.
CONCLUSION
QC software has been developed to automatically verify user input, monitor calculation of renal functional parameters, summarize QC findings, and flag potentially unreliable values for the nuclear medicine physician. Incorporation of automated QC features into commercial or local renal software can reduce errors and enhance technologist performance and should improve the efficiency and accuracy of image interpretation.
Acknowledgments
This work was supported by grant R01-LM007595 from the National Library of Medicine. We thank Aaron Scott and Valerie Harris for image processing of all studies. We receive royalties from the sale of the QuantEM software package related to this study. The terms of this arrangement have been reviewed and approved by Emory University in accordance with its conflict-of-interest practice.
References
- Received for publication May 12, 2006.
- Accepted for publication November 28, 2006.


Jump to section
Related Articles
Cited By...
- Development of a Relational Database to Capture and Merge Clinical History with the Quantitative Results of Radionuclide Renography
- Automated Patient Motion Detection and Correction in Dynamic Renal Scintigraphy
- Diagnostic Performance of an Expert System for Interpretation of 99mTc MAG3 Scans in Suspected Renal Obstruction