


Abstract
Objective: This study aims to determine if normal absolute uptake values of dimercaptosuccinic acid (DMSA) can be predicted accurately over the optimal time for imaging.
Methods: Eighty-eight normal kidneys were analyzed from 44 children with a median age of 4 y. The mean time between injection and scan was 171.7 min. The absolute uptake of DMSA in milligrams was calculated for each kidney.
Results: A strong positive linear relationship was found between the absolute uptake of DMSA and the amount of DMSA injected in milligrams (corr = 0.940 [P < 0.0005]), and the age of the child (corr = 0.770 (P < 0.0005)). Multiple linear regression showed that these 2 factors accounted for 92.2% of the change in absolute DMSA uptake. Conclusion: The absolute uptake of DMSA can be accurately predicted using a linear regression equation incorporating the amount of DMSA injected in milligrams and the patient’s age. Time between injection and scan appears to play little role in the absolute uptake of DMSA over 2–4 h.
Several authors have shown that absolute uptake of DMSA is a viable proposal and that it provides additional information about the functional status of the kidneys (1–7). In most cases, it has been argued that absolute uptake measurements should be performed at least 6 h postinjection (8,9), by which time it has been postulated that the uptake has reached a plateau. However, for imaging with high count statistics, a time interval of only 2–4 h between injection and imaging is optimal. This limitation poses a practical problem: To combine the properties of good-quality images and accurate quantitative uptake measurements to gain the maximum information from the investigation, the patients would likely need to attend the department on 2 separate occasions.
99mTc DMSA is a kidney imaging agent introduced in 1974 by Lin et al. (10) as a substitute for organomercurial renal imaging agents. Autoradiographic studies reveal intense labeling at the site of the proximal and distal tubules leading to a cortical-to-medullar uptake ratio of greater than 20:1. At 2 h postinjection, approximately 50% of the dose is retained by the kidneys in the rat model, leading to a very high kidney-to-liver ratio of 35:1. At this point, there is also a lack of visualisation of the urinary collecting system, which allows optimum time for imaging and relative uptake measurements. Once 2 h postinjection is reached, kidney uptake of DMSA increases (more slowly) until 6 h, when a plateau is reached. It can be postulated that the uptake rate from 2–6 h is stable and dependent on the patient’s renal function. This relationship has been argued by Flower et al. (11), who determined that a 4-h delay postinjection provided a reasonable compromise between image quality requirements and absolute uptake measurement accuracy. This delay, however, is still longer than usual.
This study was designed to investigate the relationship between absolute uptake of DMSA and a combination of measurable factors (age, sex, time between injection and scan, and amount of DMSA complex injected) for the range of normally used scanning intervals in most departments (2–4 h postinjection). It was hoped that an understanding of this relationship would enable absolute uptake of DMSA measurement to become part of the standard DMSA protocol without the need for additional patient attendance.
Research Questions: Can a regression equation be used to accurately predict the absolute DMSA uptake in pediatric patients with normal functioning kidneys? Can this relationship be used to predict the unknown absolute uptake of a pediatric kidney and determine if it lies within the normal range?
MATERIALS AND METHODS
The research strategy consisted of a statistical audit or survey. The reference population was children between the age of 3 mo to 16 y, inclusive.
The study population consisted of children in the Southland region of New Zealand who were being investigated for urinary tract infections. To be included in the study, the children needed to be between 3 mo and 16 y of age and needed to have been free from urinary tract infections for at least 3 mo. Children outside the age range were excluded, as were those with suspected or proven infections within the 3 mo before the examination. Subjects were recruited from those children who were sent for DMSA scintigraphy at Southland Hospital Department of Nuclear Medicine.
Procedure for Obtaining Data
For each subject, the injection syringe was first counted on the gamma camera and the total volume of the reconstituted DMSA kit was recorded, as was the volume and activity of the injection. Subjects were all injected intravenously via indwelling cannulas, which were removed after use. The dose syringe and cannula assembly was then recounted and recorded. Subjects returned for imaging (2–4 h postinjection) and were scanned as per the normal routine in the department (256-word matrix, low-energy high-resolution collimator). For the purpose of this study, a 10-min posterior acquisition was used for placement of regions of interest (ROIs) for each kidney and for background subtraction. Background regions were corrected for area, and this value was subtracted from the kidney counts obtained.
The method for calculation of 99mTc-DMSA absolute uptake in milligrams of DMSA complex in each kidney was as follows:

 Where:


Subjects classified as having normal renal function were those who had 2 kidneys, no scarring on either kidney on the planar DMSA images, a differential DMSA uptake measurement of 50% ± 5%, and a creatinine plasma level within the normal limit for their ages.
Statistical testing for strength of association of 99mTc-DMSA absolute uptake and various measurable factors such as age, sex, time between injection, and scan and amount of DMSA injected was performed. Ninety-five percent prediction intervals were produced for predicted values of 99mTc-DMSA uptake.
Instruments of Measurement
A single-head gamma camera (Millennium; General Electric Medical Systems, Milwaukee, WI) with a rectangular field-of-view was fitted with a low-energy, parallel hole collimator and was used to record all isotope data. For both patient data collection and syringe (pre- and postinjection) data collection, the same imaging couch (Millennium imaging couch) was placed between the source and the detector to standardize this attenuation factor.
Tissue Attenuation Correction
The linear attenuation coefficient for 99mTc in tissue is 0.153/cm (12,13); however, the effective attenuation is actually less due to scatter. (14,15,16) Therefore, the values used for attenuation in tissue were 0.12 cm−1 for the first 5 cm and 0.14 cm−1 for each additional 1 cm of renal depth. This offered a better estimate of the effective attenuation coefficient. Kidney renal depth estimations were made for each kidney using the Tonnesen equation (17).


Counting the Dose on the Camera
When counting samples on the Millennium gamma camera, GE Medical measurements of dead-time losses have shown that losses of approximately 1% were experienced at 55MBq, increasing to approximately 6% at 185MBq. The manufacturers of the camera concluded that the maximum dose that should be counted on the camera is 185MBq (18). Because the adult dose of 99mTc-DMSA given in the department is 185MBq, and because all the participants in this project were children (who were given less than 185MBq), counting the dose on the camera did not represent a significant error due to dead-time losses in this case.
Recording the Isotope Data
All isotope data were recorded on the computer system. The matrix size was the same for all data acquisitions (kidneys and dose counting) = 256 × 256 word matrix. To maintain a uniform field for counting, the whole field-of- view was used for the dose count analysis. For the patient measurement (kidneys, background and injection site), ROIs were drawn manually by the same operator for all subjects. Background counts were calculated per pixel and then applied appropriately to each kidney ROI, dependent on its size.
Radioisotope Information
For all subjects, the same generator-pharmaceutical combination was used (Australian Radioisotopes [ARI] Molybdenum- 99mTc [99Mo-99mTc] generator and Amersham International (U.K.) DMSA Agent). The radiopharmaceutical was reconstituted by the same operator in accordance with the manufacturer’s instructions, and labeling efficiency was determined with thin layer chromatography kits designed for testing DMSA. Patient dose was determined by weight, by calculating the fraction of the standard adult dose used in the department (185MBq for a 70-kg adult) that each child should receive. The 99mTc-DMSA complex was injected into all subjects intravenously via a heparin-free indwelling cannula flushed with saline pre- and postinjection. Postinjection, the entire cannula and syringe assembly was measured.
Subjects
In total, 44 children (88 kidneys) were eligible for the research program, 28 girls and 16 boys. The median age of the study subjects was 4 y, range 0.4–15 y.
Statistical Design
Compared with data from other published papers on the calculation of 99mTc-DMSA absolute uptake (2,5), the values were found to be normally distributed with a SD of approximately 9%. Based on this information, the required sample size for a margin of error of 2% with a 95% confidence interval was 77 data subjects (kidneys) (19). Each kidney was treated as a separate entity, with each normal patient contributing 2 data subjects to the study.
For the regression analysis, the dependent (outcome), or y, variable was defined as the absolute 99mTc-DMSA uptake in a kidney in milligrams. Possible independent (explanatory), or x, variables were time between injection and scan in minutes, age of subject, sex of subject, and amount of DMSA injected in milligrams.
The outcome of this project was evaluated by using the statistical information presented to determine if future absolute DMSA uptake values can be confidently predicted for specific values of the explanatory variable(s). A 95% confidence interval was used to assess the accuracy of the mean absolute DMSA value. For the prediction of unknown future normal values, 95% prediction intervals were calculated.
Significance testing was used to evaluate the claim that explanatory variable(s) and absolute renal uptake are positively associated. The decisive value of P (significance level) used was 0.05.
RESULTS
First, it was necessary to determine if the results from girls and boys could be regarded as coming from a single population. It was assumed that there was a random sample(s) from the population(s) (girls and boys). One-way analysis of variance (ANOVA) was used to assess the statistical significance of any difference in the sample. Table 1 displays the mean DMSA uptake (mg) and SD for girls and boys.
Mean and standard deviation of DMSA absolute uptake (mg) for girls and boys
Figure 1 shows side-by-side boxplots of absolute uptake for girls and boys. The boxplots indicate that the data values from the 2 groups have a significant crossover, with the girls (1) having 1 outlier and the boys (2) having 4 outliers. The ANOVA analysis computed an F statistic. Comparison of the means was accomplished by using the F statistic, which was 0.16 with an associated P value of 0.690. This indicated that the groups were from the same population, and that the differences in the mean DMSA uptake in milligrams between girls and boys were not statistically significant.
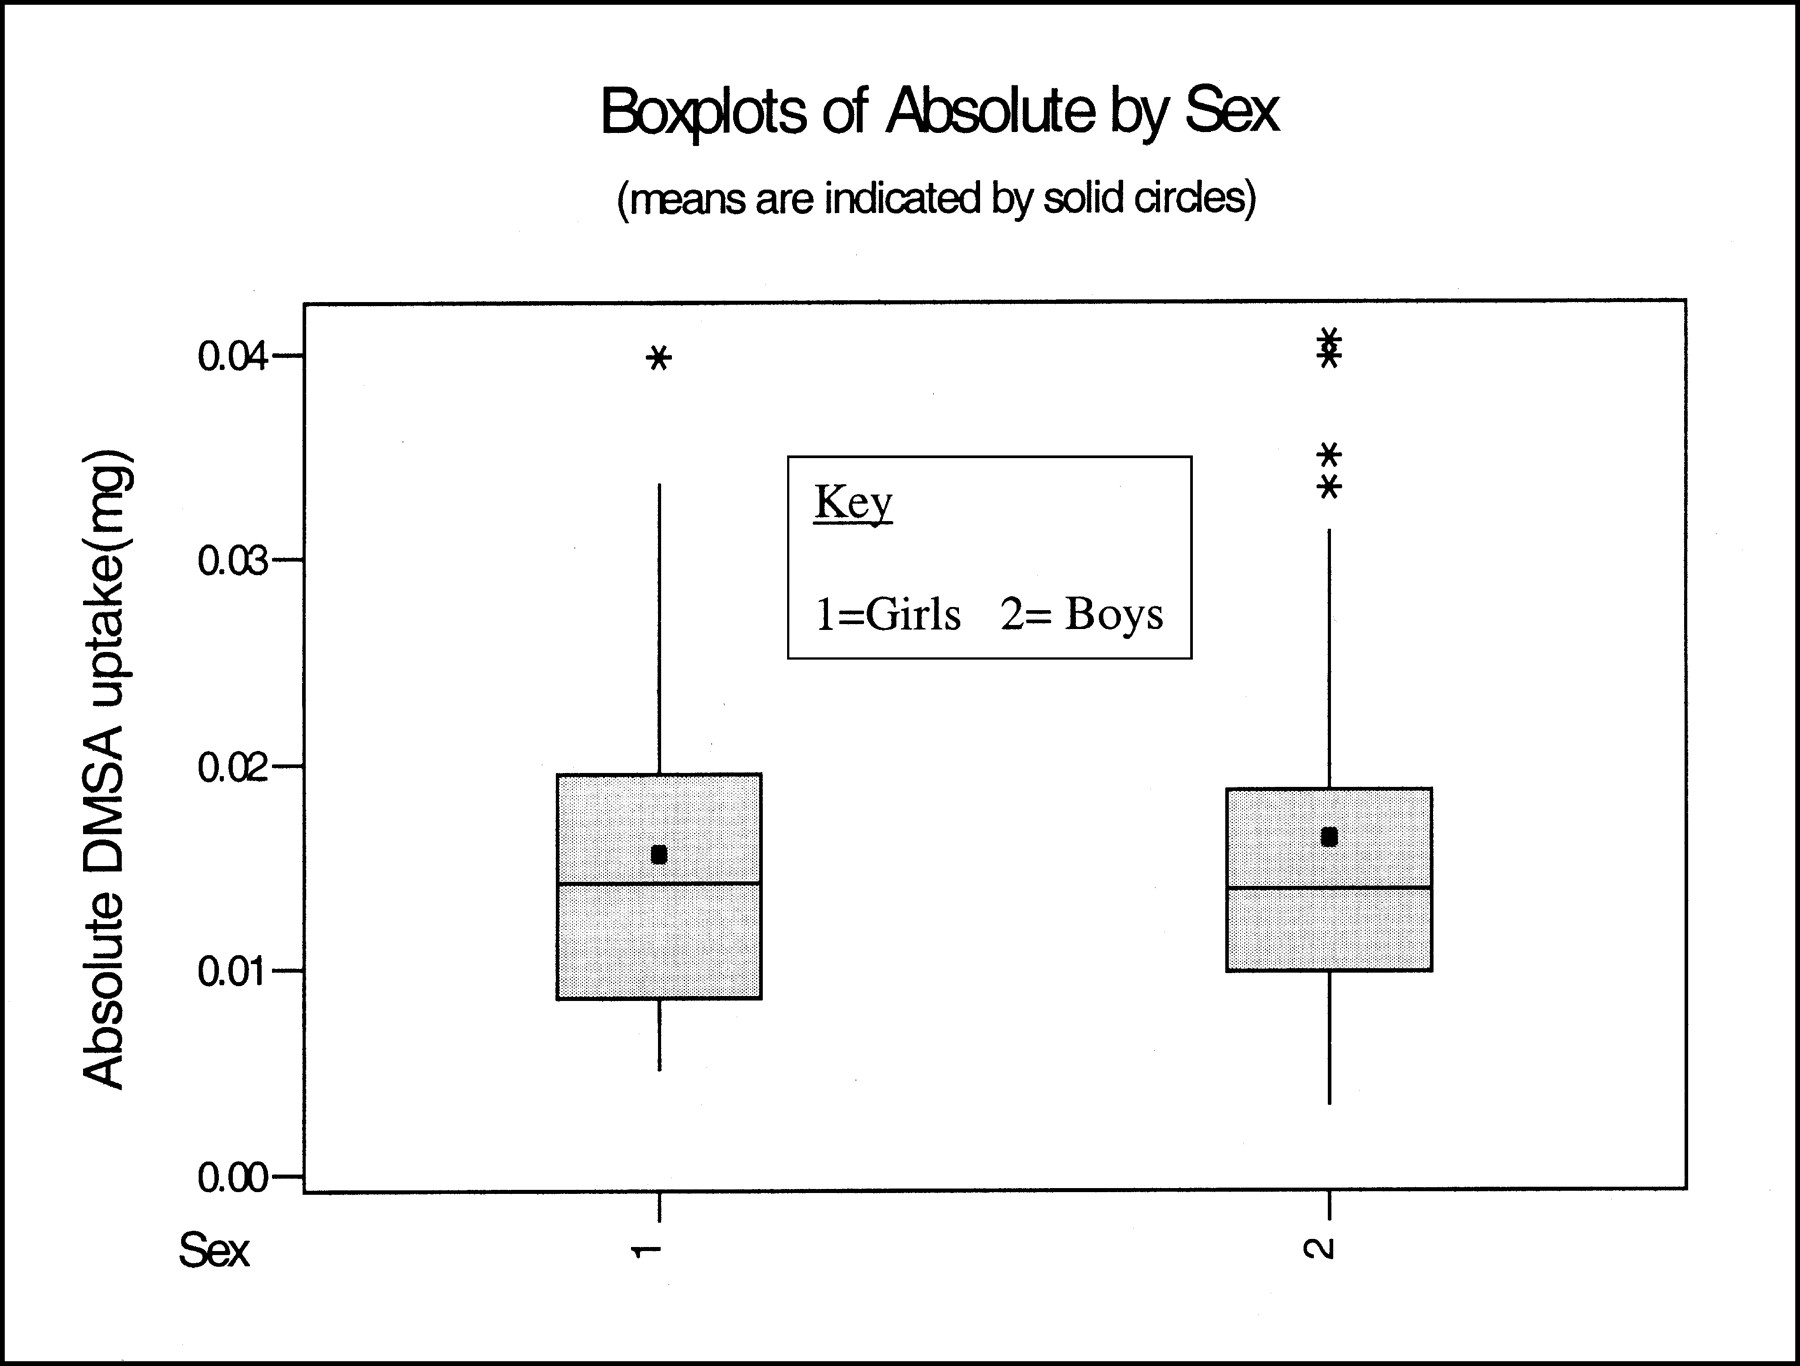
Box-plots of absolute uptake of DMSA by sex. The box represents Quartile 1, Median and Quartile 3 of the data points. Whiskers show min to max data points, out to 1.5 X Interquartile range. The mean is indicated by a point within the box.
The relationship between pairs of variables was investigated to determine if any 2 explanatory variables were related. This factor might have accounted for part of the pairs’ relationship to an outcome variable, due to the overlap of predictive information. Table 2 shows the correlation of the paired variables that were analyzed.
Correlation of paired variables
Two explanatory variables, age and DMSA injected, appear to show high correlation with the outcome variable. These 2 variables also showed a good (moderate) level of correlation with each other. This finding would seem sensible; the older the child is, generally more DMSA complex will be injected because more radioactivity will be given and, therefore, more volume from the vial (assuming the vial is reconstituted to give a fairly consistent concentration of radioactivity per milliliter). This relationship may result in an artificially higher correlation to age and absolute DMSA uptake than is really deserved. The 2 variables, age and DMSA injected, are inseparably linked in this study. This factor was a weakness in the study design.
The scatter-plots in Figures 2 and 3 show a visual assessment of the correlation and also helped to identify any outliers or extreme values. An outlier was noted in Figure 3, “DMSA uptake against DMSA injected”. In this plot, this value lies away from the trend. After careful checking of the original data, it was decided to exclude this child from the analysis (case number 6R and 6L). Table 3 shows the correlation for the paired variables with this case excluded.
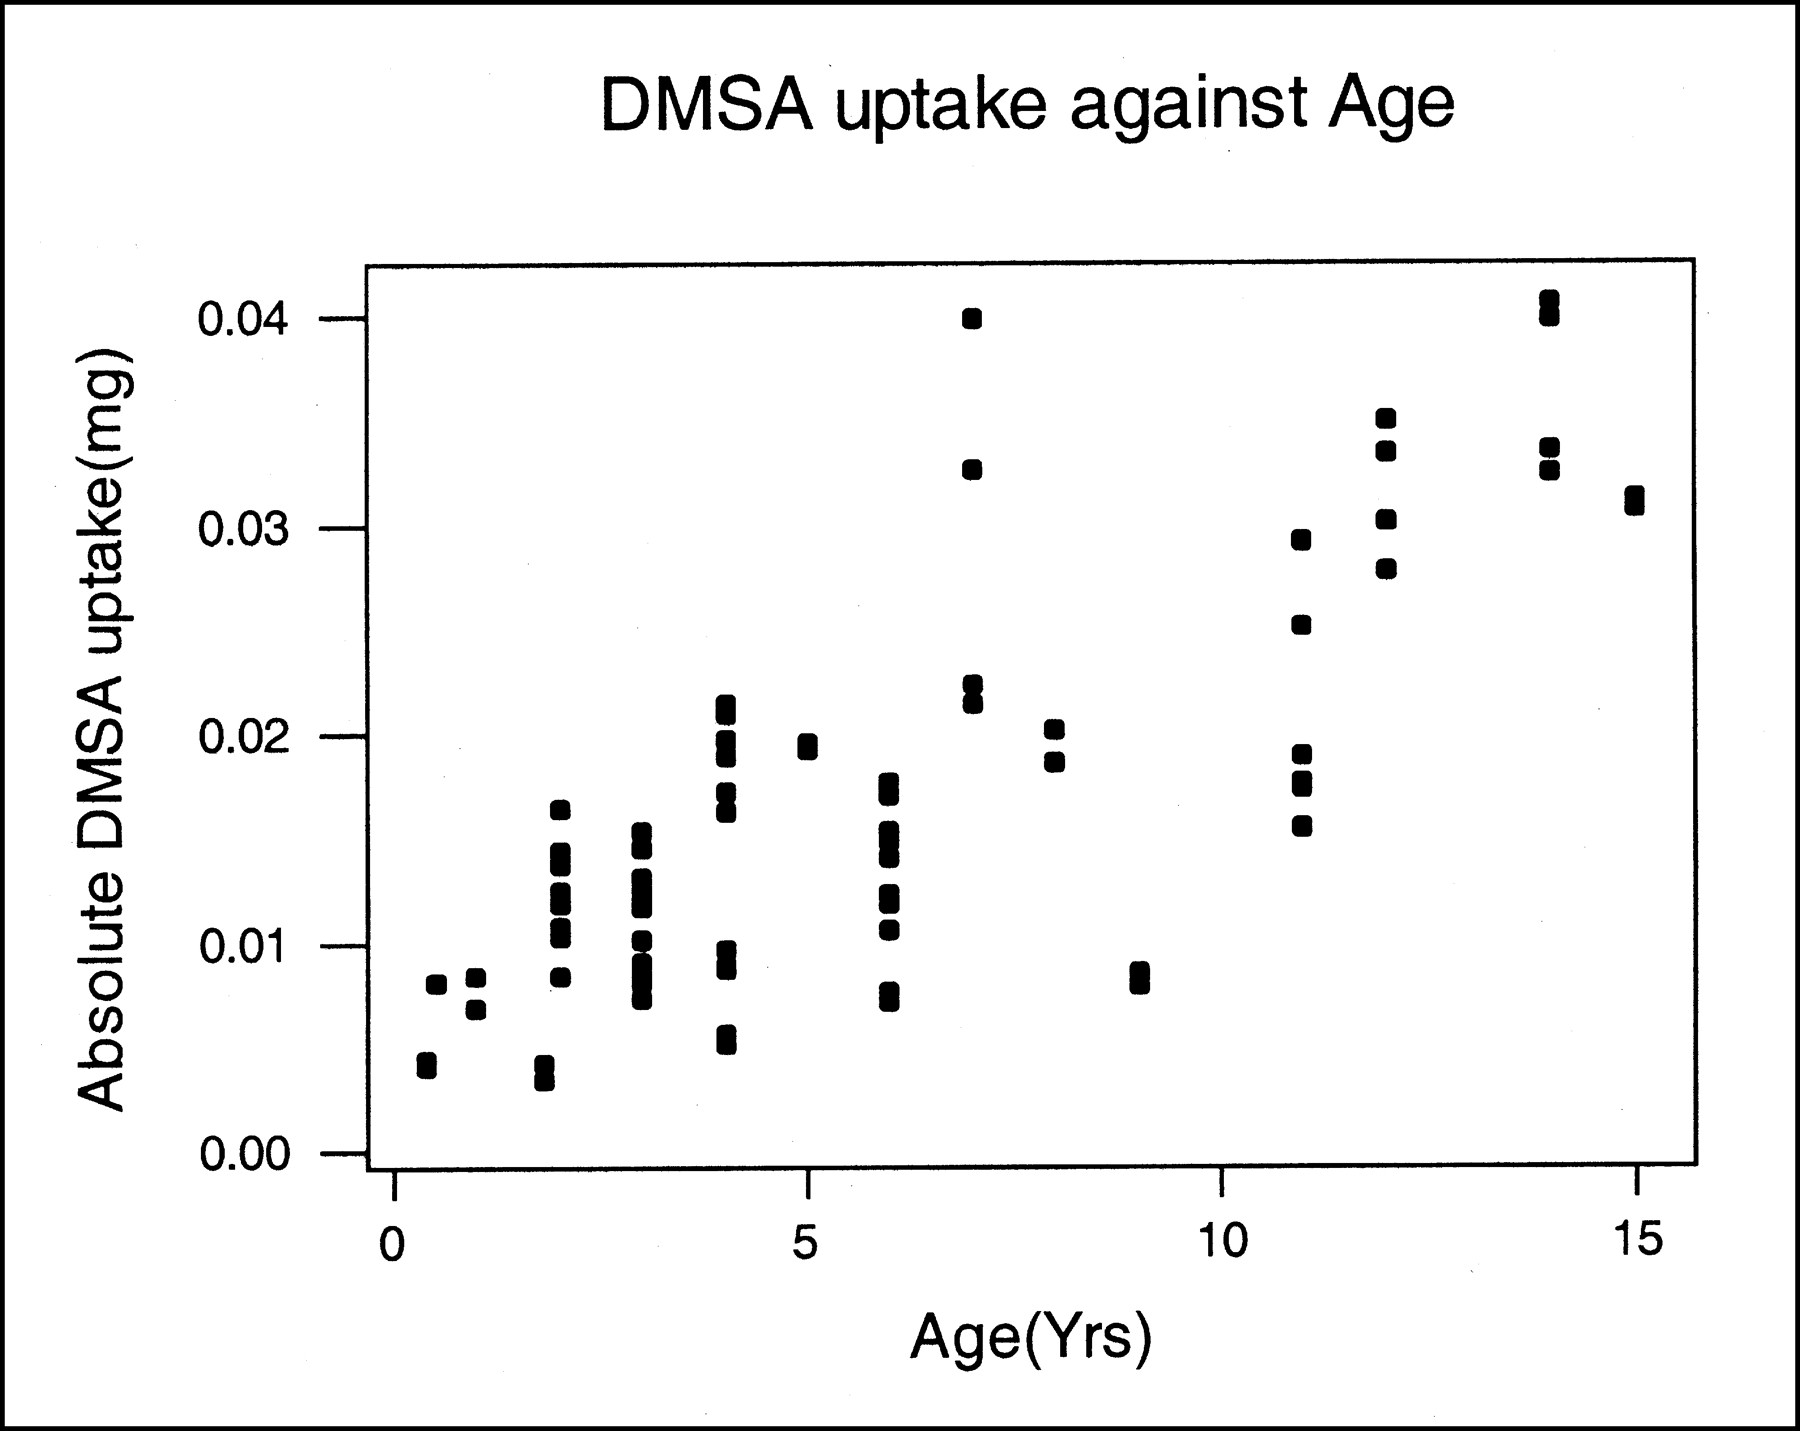
Scatter-plot of age of child against DMSA absolute uptake.
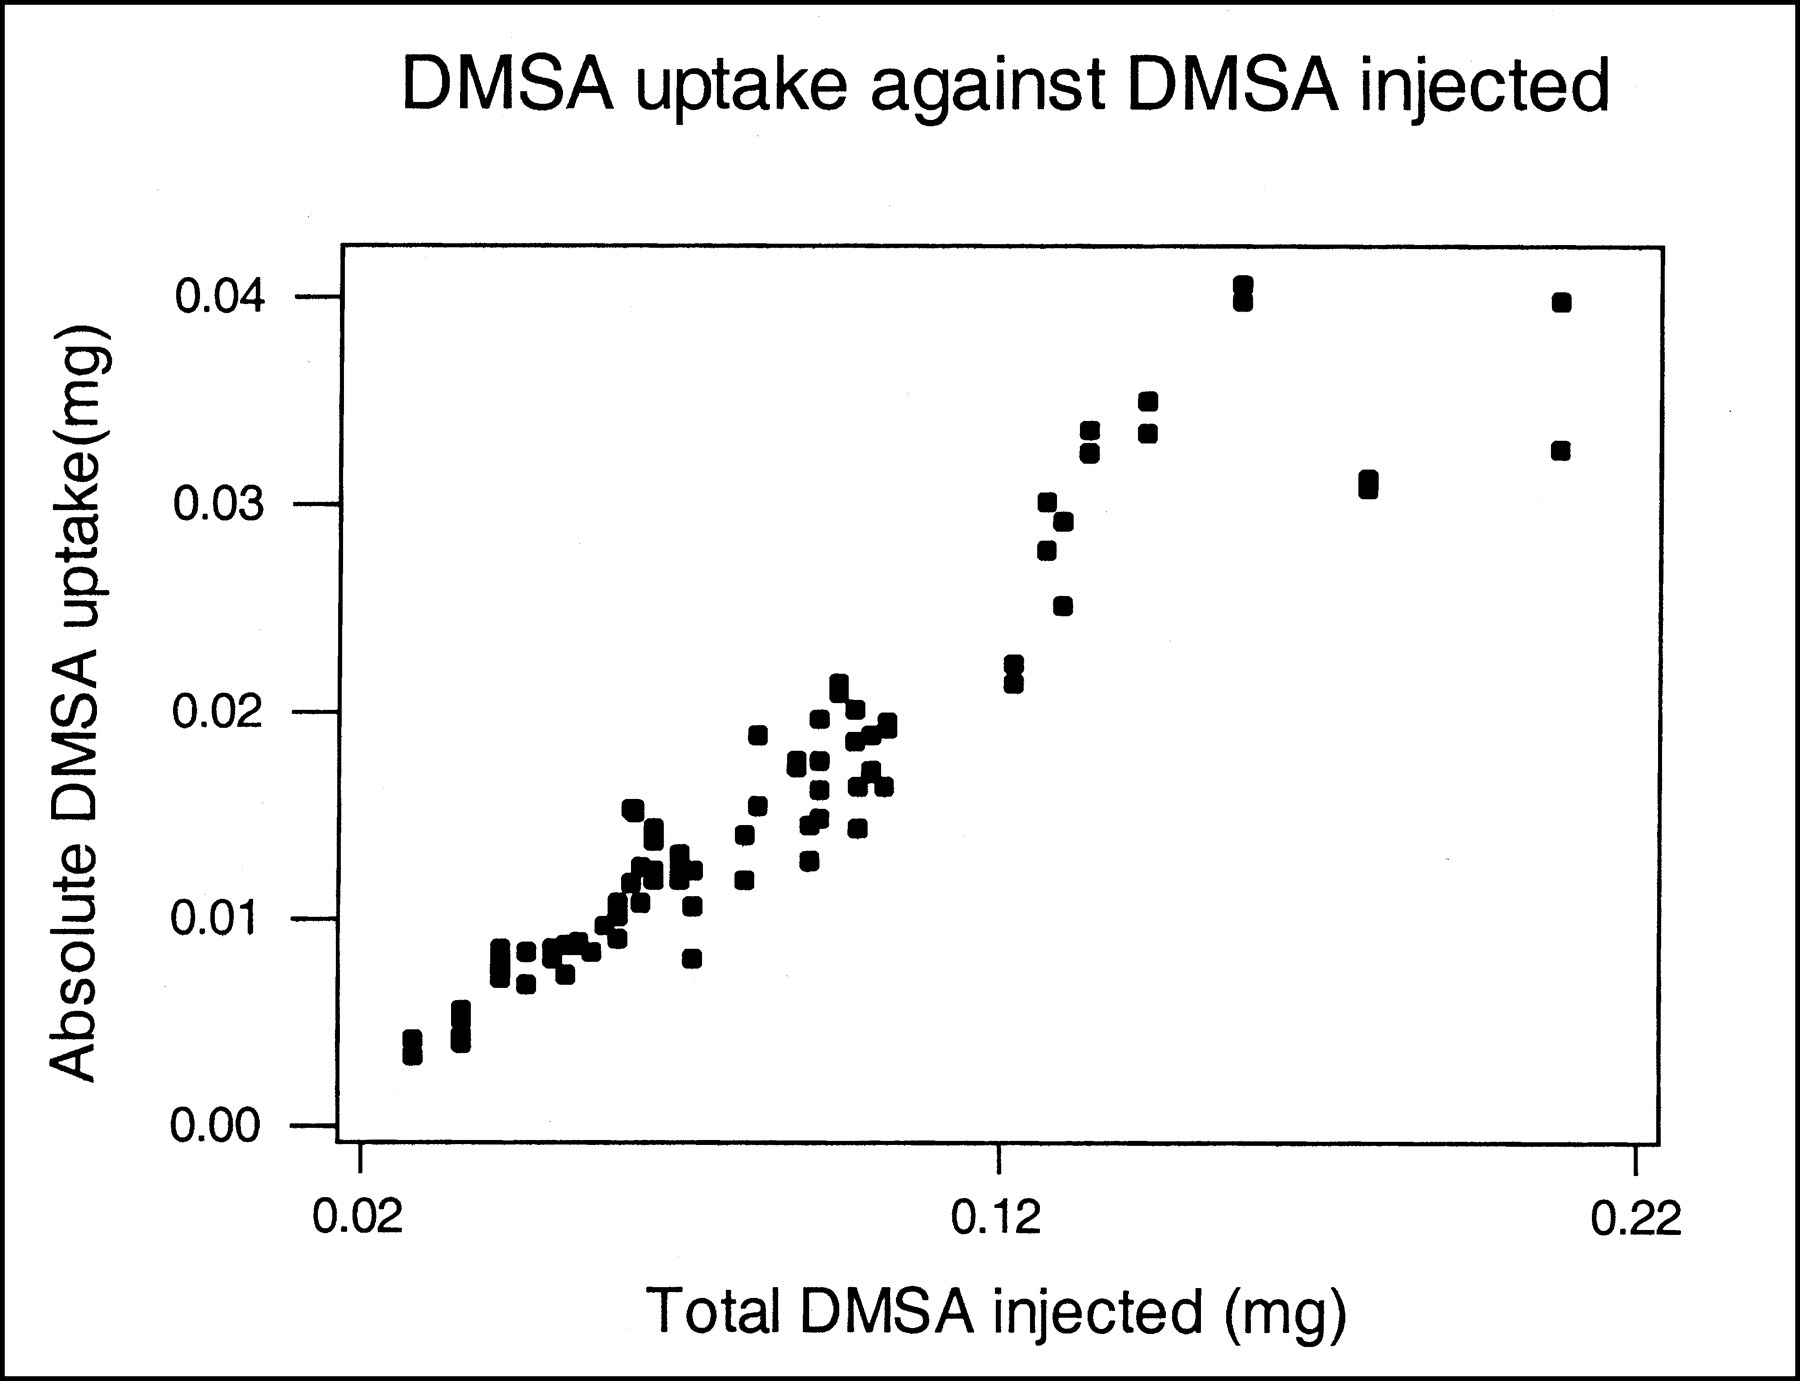
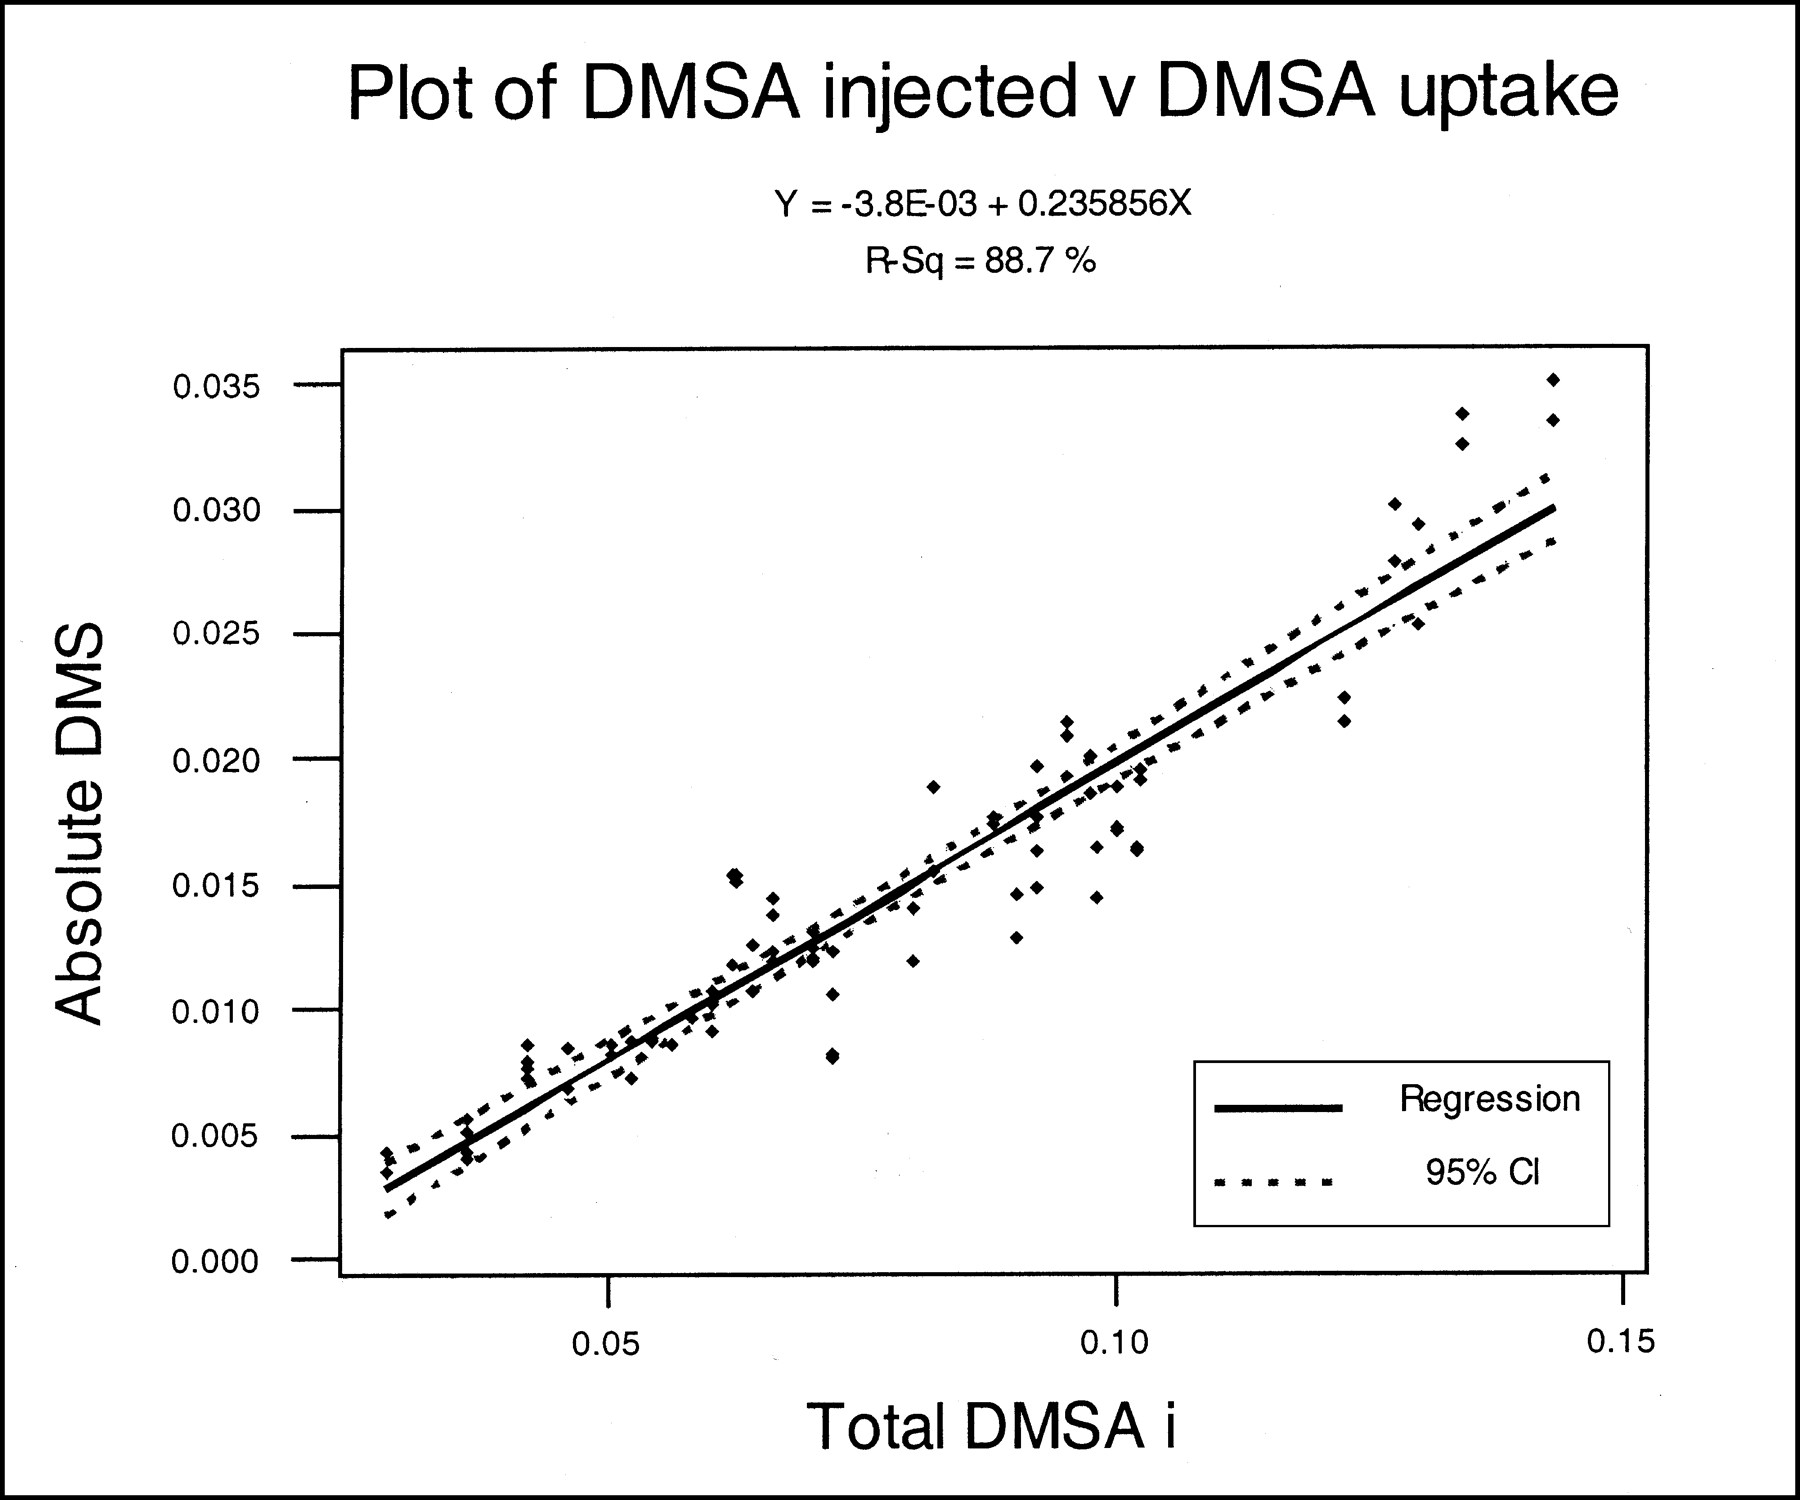
Scatter-plot of DMSA injected (mg) against DMSA absolute uptake.
Correlation of paired variables with case number 6R and 6L excluded
The removal of case no 6R&L increased the correlation value of DMSA uptake against age, as expected. It also increased the correlation between age and DMSA injected, but made no significant difference to the correlation between DMSA uptake and DMSA injected.
Multiple linear regression was performed on those explanatory variables that showed a linear correlation with the outcome variable (DMSA uptake [mg]). These variables were age and DMSA injected (mg).
The multiple linear regression equation for this relationship is as follows:


The ANOVA F statistic for this regression = 441.80 with a P value of < 0.0005. The squared multiple correlation R2 was 0.914; this finding indicates that the proportion of the variation of the outcome variable explained by the explanatory variables in the multiple linear regression = 91.4%. The multiple correlation coefficient R was 0.95; this indicates that the correlation between the observed values of the outcome variable (DMSA uptake [mg]) and the predicted values, as given by the multiple linear regression analysis, = 95%. The estimated SD from the regression line(s) = 0.002476.
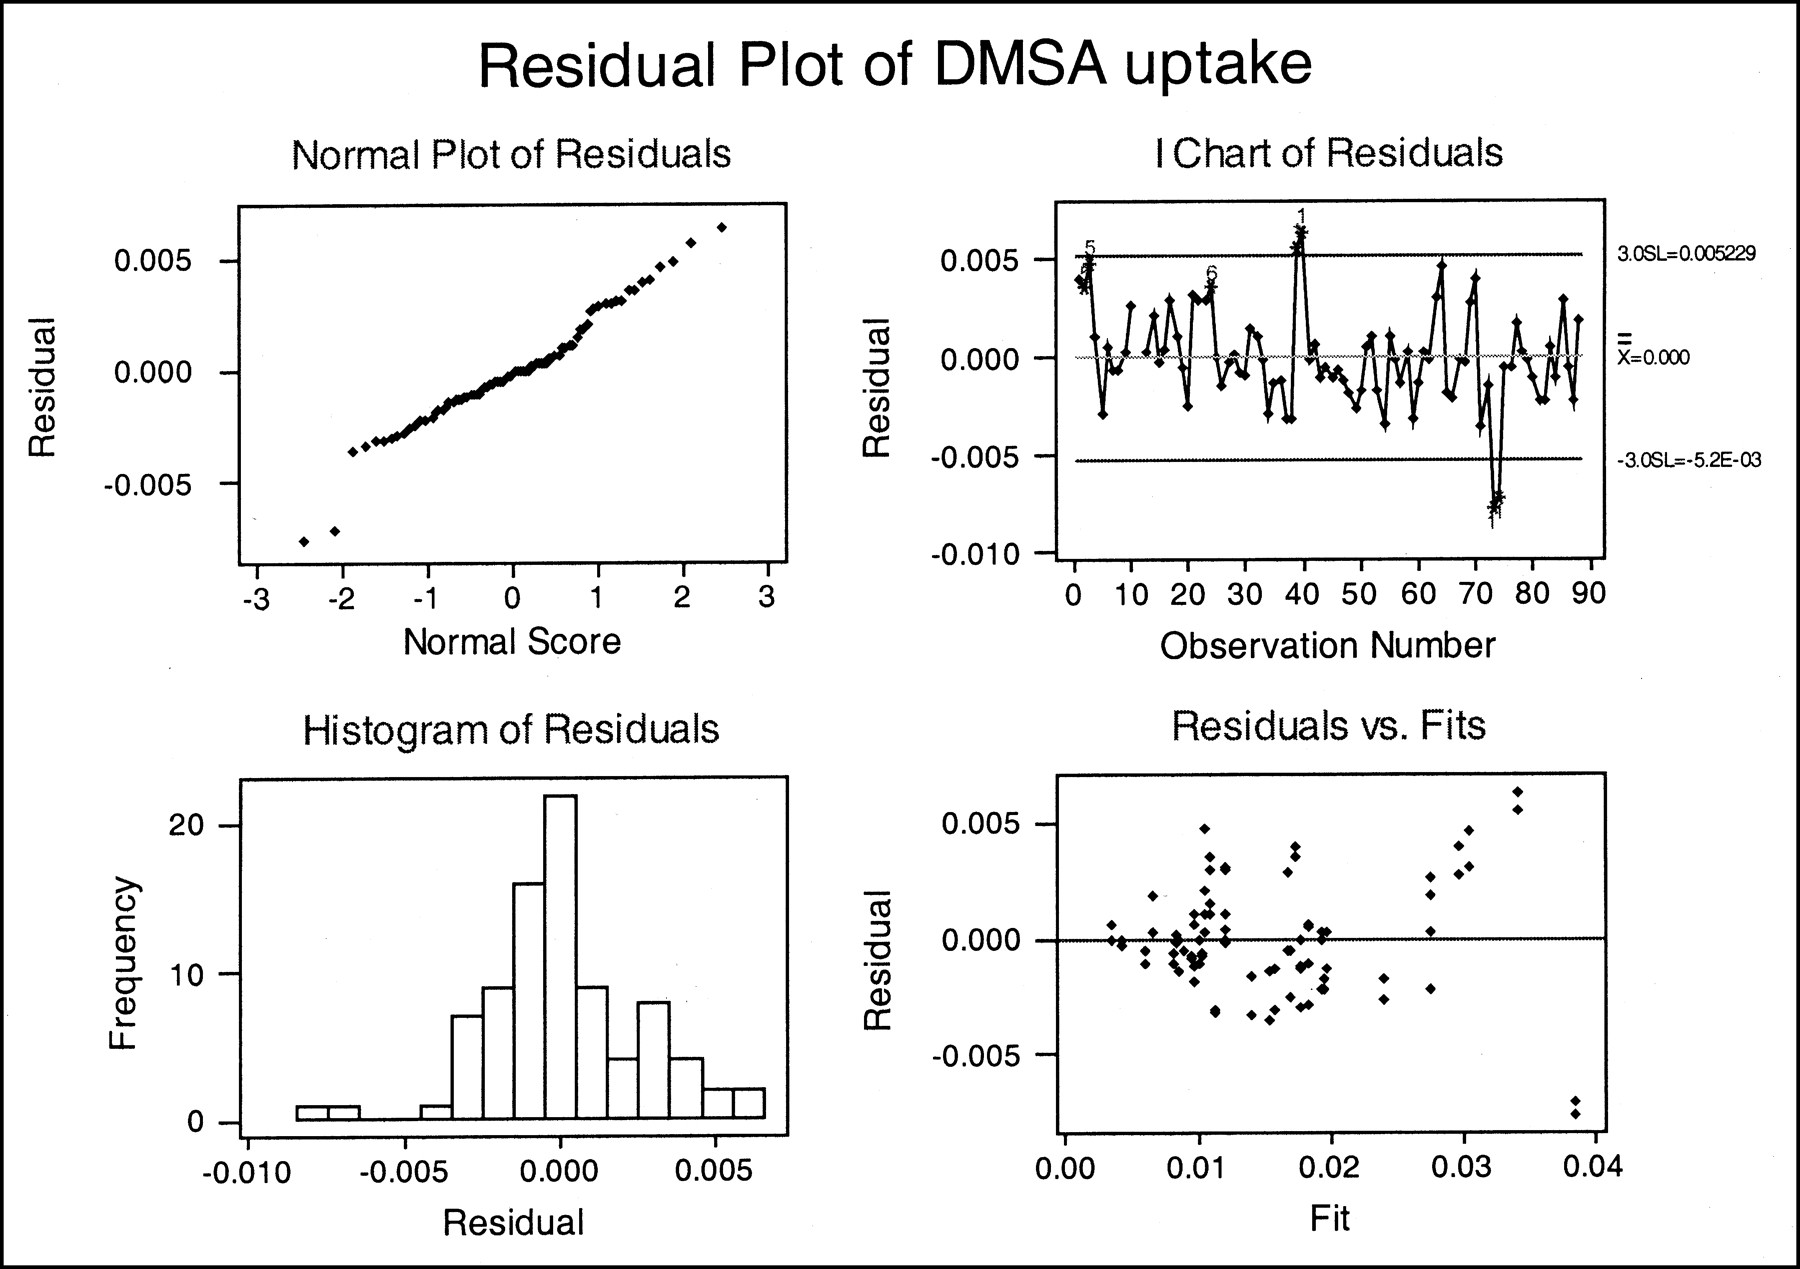
Checking the residuals is an important step in regression analysis, as this determines if the regression analysis is appropriate for the data and detects any points that may not fit the model well. Figure 4 shows plots of the residuals versus predicted values of the outcome variable (absolute DMSA uptake [mg]).

Residual plots for multiple regression analysis. The fit of the regression line is examined by plotting the differences between the observed and predicted values of y, the residuals. Outliers are points with unusually large residuals. The residuals above the regression line should ideally mirror those below.
The normal quantile plot of the residuals appeared to show 2 unusual observations lying below −0.005 and 2 lying above 0.005. The chart of residuals versus observation number also showed these 4 unusual points, 2 lying above and 2 lying below 3 SDs from zero. These observations would have a large influence on the regression analysis and on the error, and, therefore, the confidence and prediction intervals.
The cases responsible for these large residual values were carefully assessed. The plot of residual versus fit also revealed 4 large values (2 above and 2 below the zero line), indicating these points are extreme in the regression model. The data points showed that the large residual values belonged to 2 children (4 kidneys). The large positive residuals belonged to case 20R&L, a 14-y-old boy injected with 0.1580 mg of DMSA. The large negative residual belonged to case 37R&L, a 15-y-old boy injected with 0.1780 mg of DMSA. Both cases were exceptional in this dataset in that they had a large amount of DMSA injected as compared with all the other cases, mainly because they were much older subjects. Although these 2 children did serve to extend the useful range of the study, there were not enough cases to do so accurately.
Because of the large residual, which would have a considerable impact on the results, these 2 cases were excluded from the analysis. The regression analysis was repeated and the residual plots re-examined. Figure 5 shows the residual plots for DMSA uptake (mg), excluding these 2 children. Because of this exclusion, the normal quantile plot is more linear and the chart of residuals versus observation number does not exceed the 3 SD line.


Residual plots excluding the 4 outliers.
The F statistic for the multiple regression = 441.8 with a P value of < 0.0005. The R2 = 0.922 (92.2%) with an R value of 0.96 (96%). The SD for the multiple regression is 0.002017. All these values are slightly better than before the exclusion of the 2 extreme cases, which indicates their significance.
Confidence intervals were calculated for each of the regression coefficients. Figures 6 and 7 show the 95% confidence intervals for this model for each explanatory variable. This also shows how the data fits the model and gives an estimated range for the model.

Plot of 95% confidence intervals for age of child against DMSA absolute uptake. Confidence intervals are used to estimate the mean of the future observations of the population.

Plot of 95% confidence intervals for DMSA injected against DMSA absolute uptake.
To predict future observations, 95% prediction intervals were constructed. Figures 8 and 9 show the plots for the 95% prediction intervals, and clearly reveal that the prediction intervals are farther from the least square line than are the confidence limits. This is because the interval for a single future observation is larger than for the mean of its subpopulation, and is one reason why a large population is needed when constructing a model for future predictions (19).

Plot of 95% prediction intervals for age of child against DMSA absolute uptake. Prediction intervals are used to estimate a single future observation within the population.
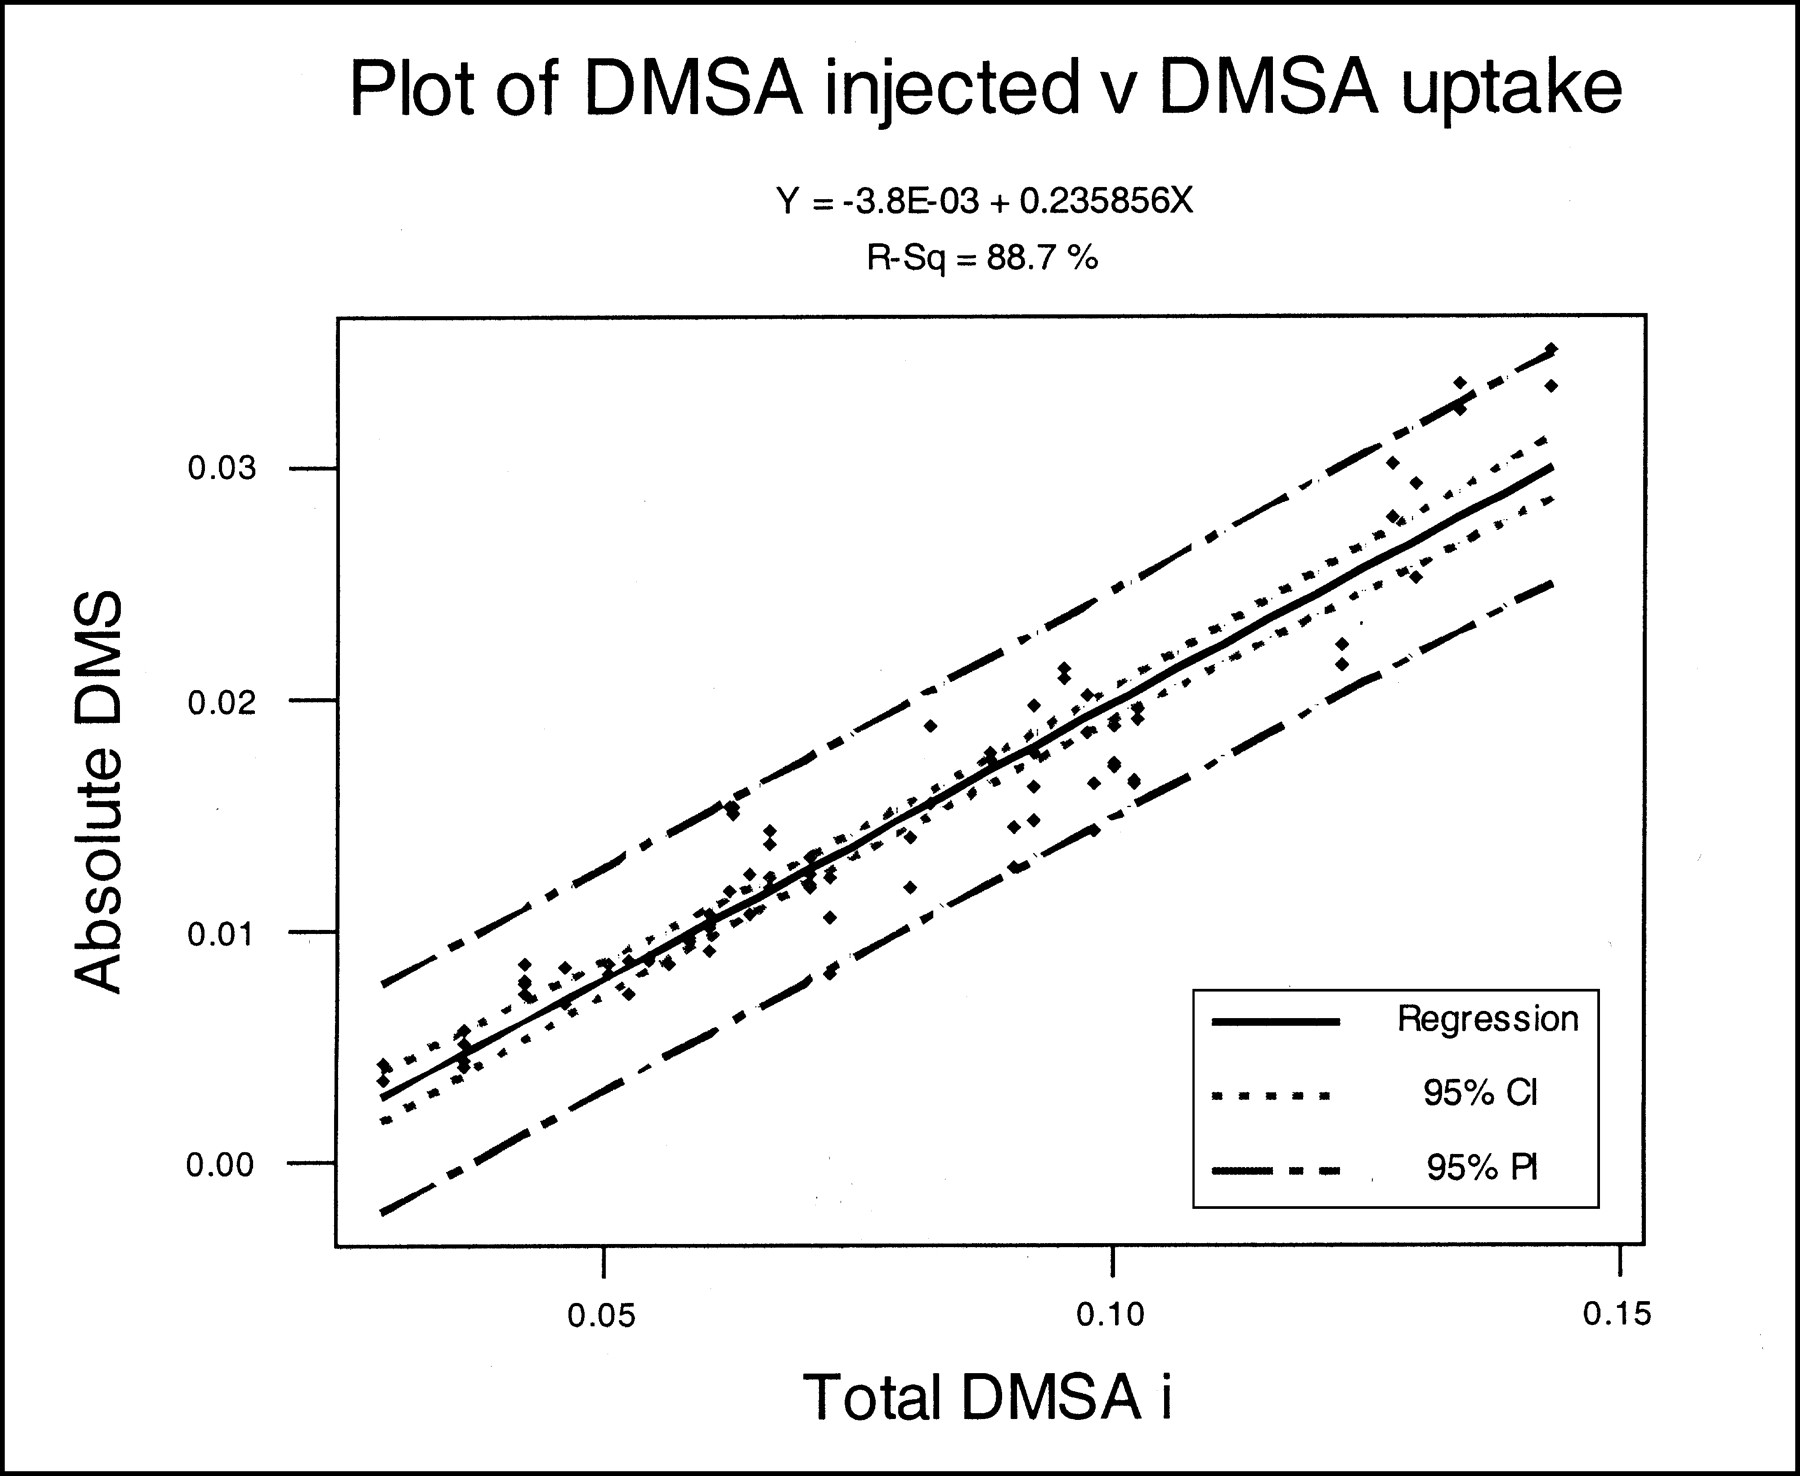
Plot of 95% prediction intervals for DMSA injected against DMSA absolute uptake.
Finally, a prediction interval for the model was computed to indicate the margin of error for any future individual observations:


DISCUSSION
This study suggests that absolute uptake of DMSA in a kidney can be predicted using the amount of DMSA injected and the patient’s age in the form of a multiple regression equation. This study also suggests that time between injection and scan over this time range (2–4 h) does not have a significant effect on absolute DMSA uptake, as shown by Figure 10. These results, although unexpected, are important.
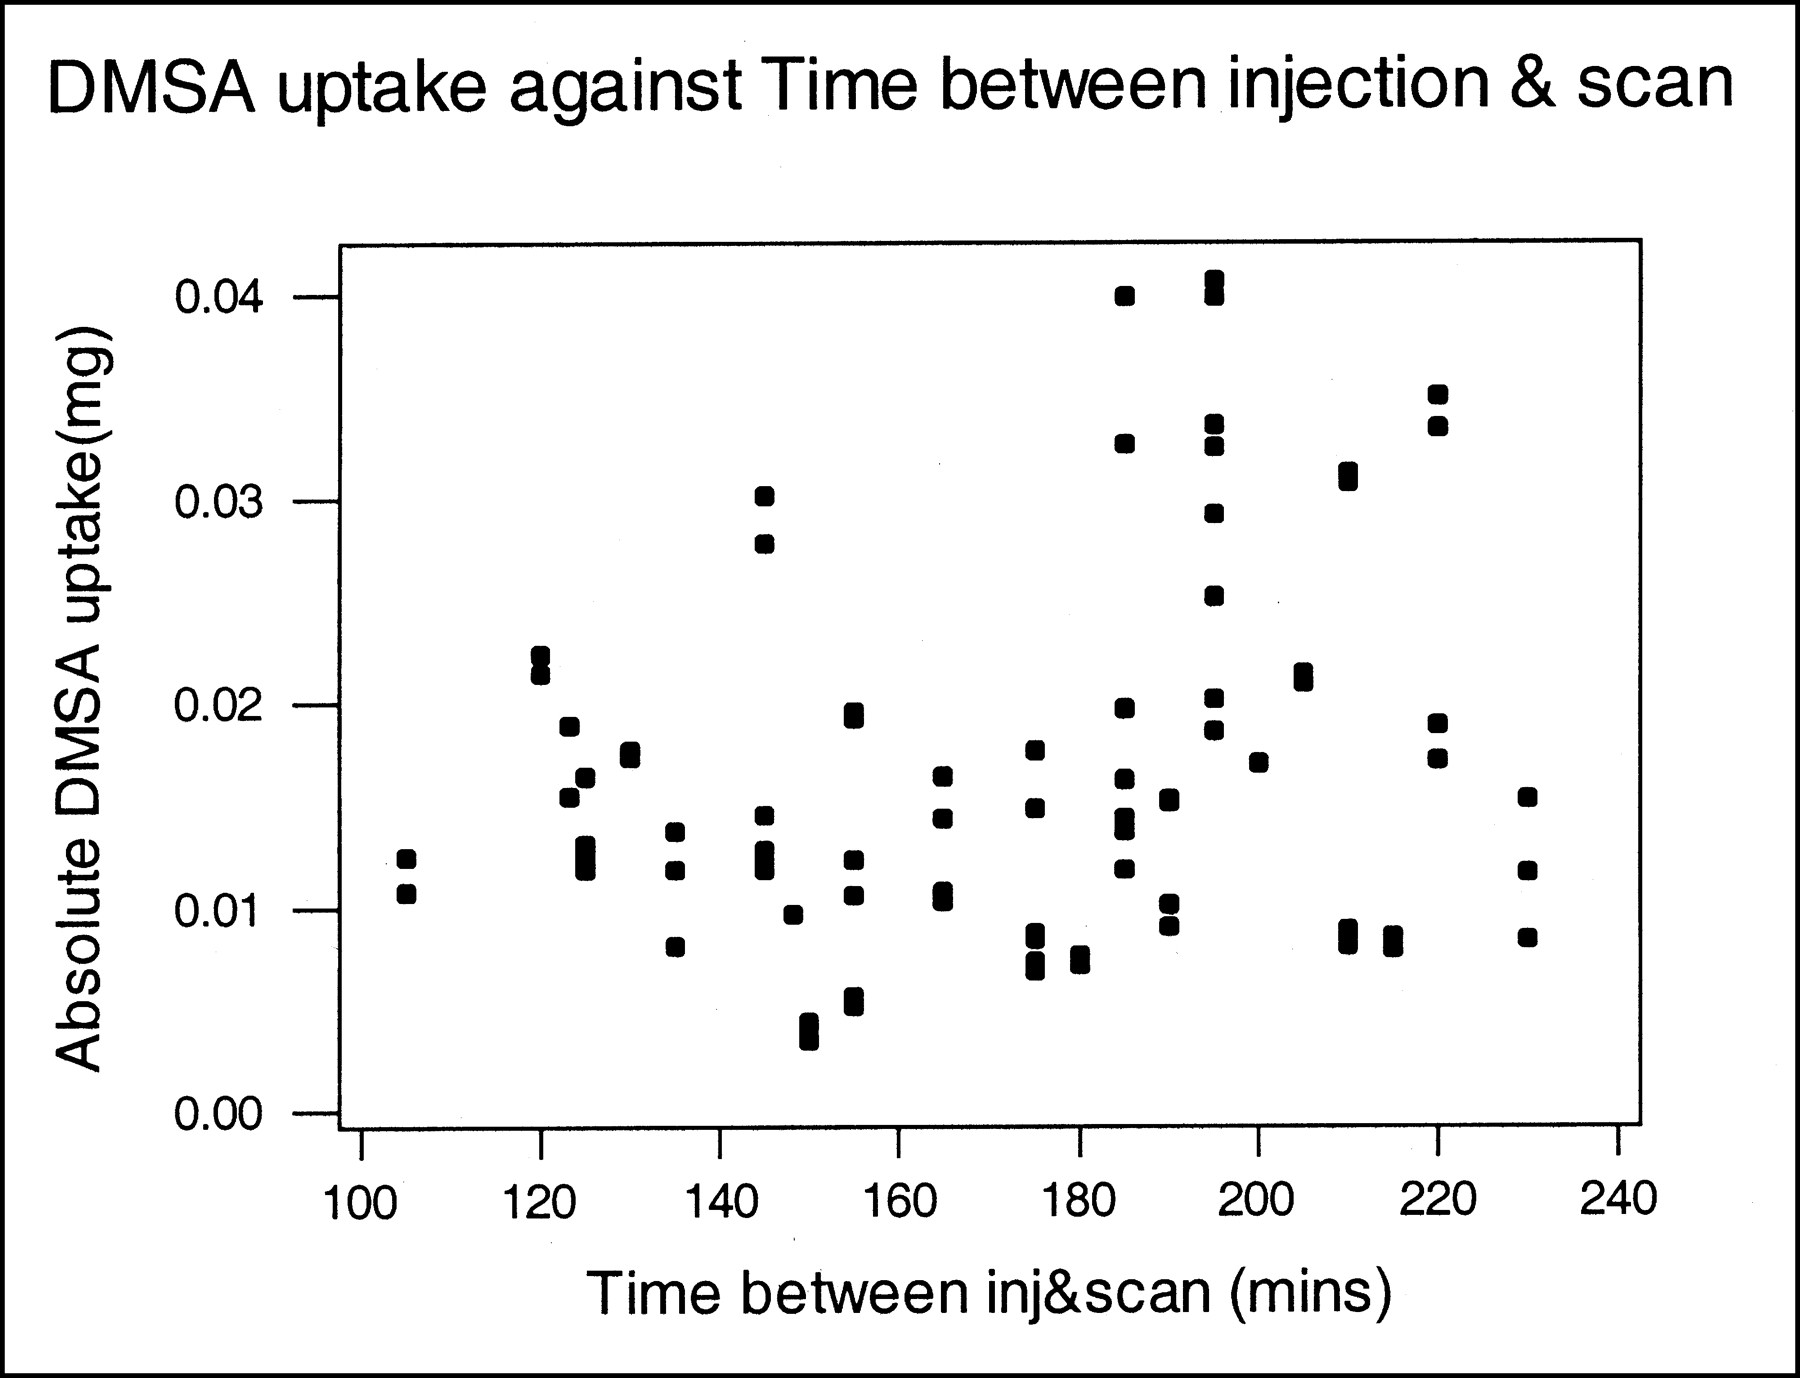
Plot of DMSA absolute uptake against time between injection and scanning.
Normally, vials of DMSA are reconstituted solely on the basis of radioactive concentration for ease of dose withdrawal at that session time. These results imply that DMSA uptake may be positively associated with the radiopharmaceutical concentration (mg/MBq). This factor should be kept in mind when reconstituting the DMSA kit and preparing patient injections.
Age was also an influential factor. In part, this finding may be due to the fact that the relatively few older children in this sample received a larger percentage of the reconstituted volume from a DMSA vial than did the younger children. As a result, the older children received more DMSA complex, which was found by the study to correlate to an increase in the absolute uptake by the kidney. This condition may have a confounding effect; however, it would seem sensible that if absolute DMSA uptake is a reflection of the amount of functional cortical mass, then this amount should positively increase with age. The correlation of age and DMSA uptake was fairly high (0.80), but was not significantly higher than the correlation between age and amount of DMSA injected (0.73). This finding indicates a high level of overlap of predictive information.
The correlation found between the amount of DMSA injected and absolute DMSA uptake was by far the most dominant factor with a very high (0.94) correlation. It implies that uptake of DMSA by the cortical cells may depend on the blood concentration of DMSA, and that lower concentrations may lead to lower uptake. Although direct blood sampling was not undertaken in this study, it was thought that this could be inferred because the correlation held true, even with children of the same age and approximate weight. It cannot be explained as simply older children being given larger amounts of DMSA. Figure 11 shows bands of children of the same age with varying amounts of DMSA injected; when this plot is compared with Figure 2, the same distribution can be seen with age and DMSA uptake. Within these bands of same-aged children (a subpopulation), there is no predictive overlap as exists in the group as a whole. The increase in uptake with regard to amount of DMSA injected must be independent of age and purely a result of the larger amount of DMSA injected. This effect has not been described previously. However, in the other studies cited, absolute uptake of DMSA was calculated on the basis of the percentage of the injected radioactivity only, and not related to the actual amount of DMSA complex absorbed. This basis would tend to weaken any relationship between absolute DMSA uptake and the variable being measured (creatinine clearance, etc.). Using the percentage of injection method only records the uptake relative to the injected radioactive dose (not necessarily the pharmaceutical component). Because this method does not account for differences in radiopharmaceutical-specific activities in the true sense (mg/MBq), it is therefore not a truly quantitative method of expressing function.
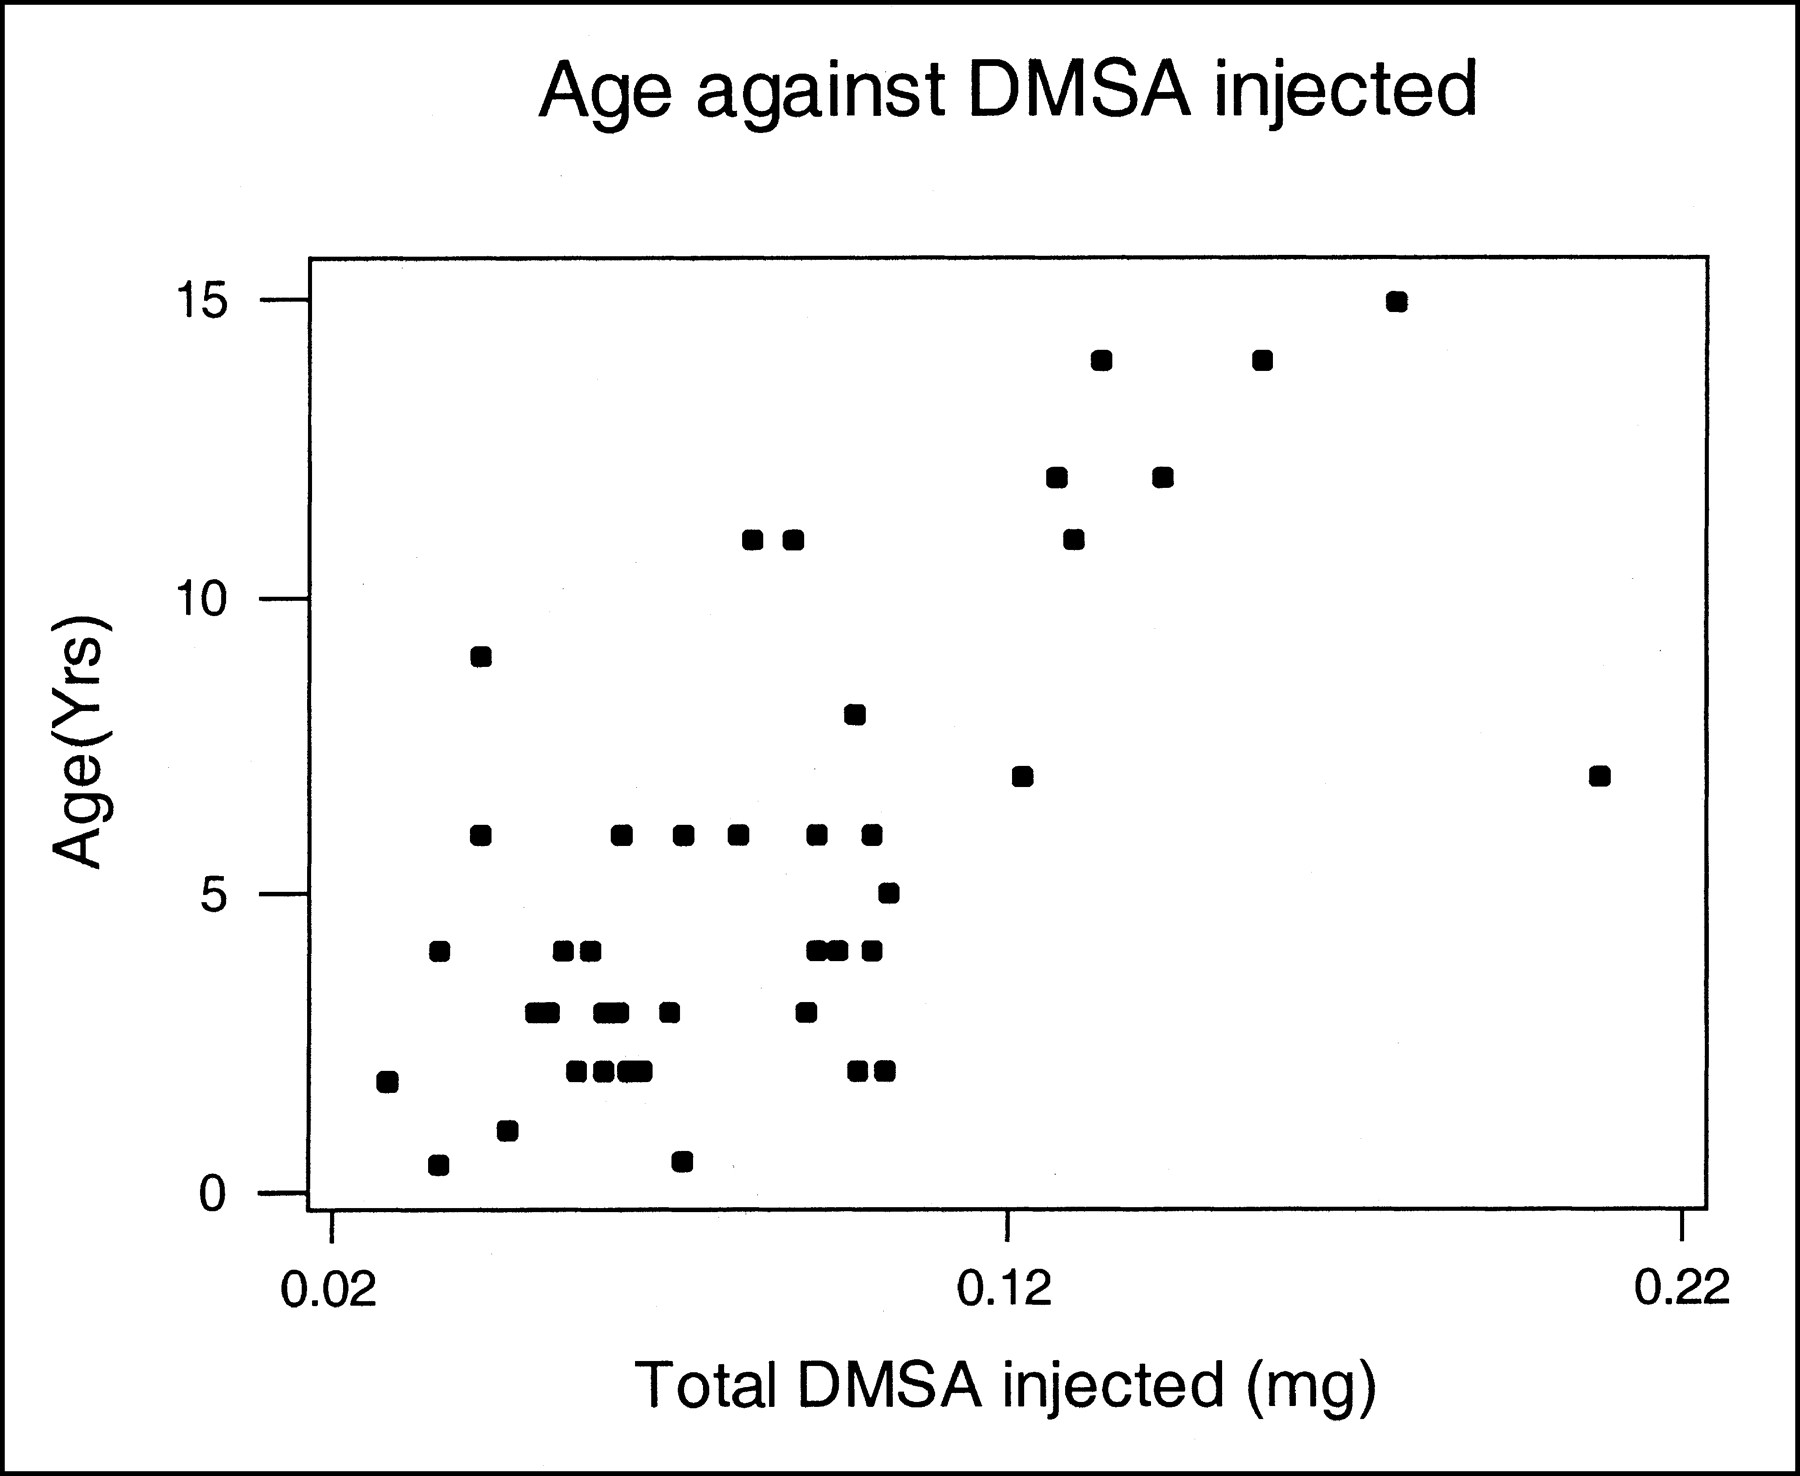
Plot of age against DMSA injected (mg).
The prediction intervals computed for the model cannot be used directly to predict future individual observations because 2 independently variable factors are involved (DMSA injected and age). However, the regression equation determined in this study can be used to manipulate the DMSA injected variable to produce an expected absolute uptake. From the model, a prediction can then be made based solely on the patient’s age; Figure 12 uses an example dose of 0.36 mg of DMSA.
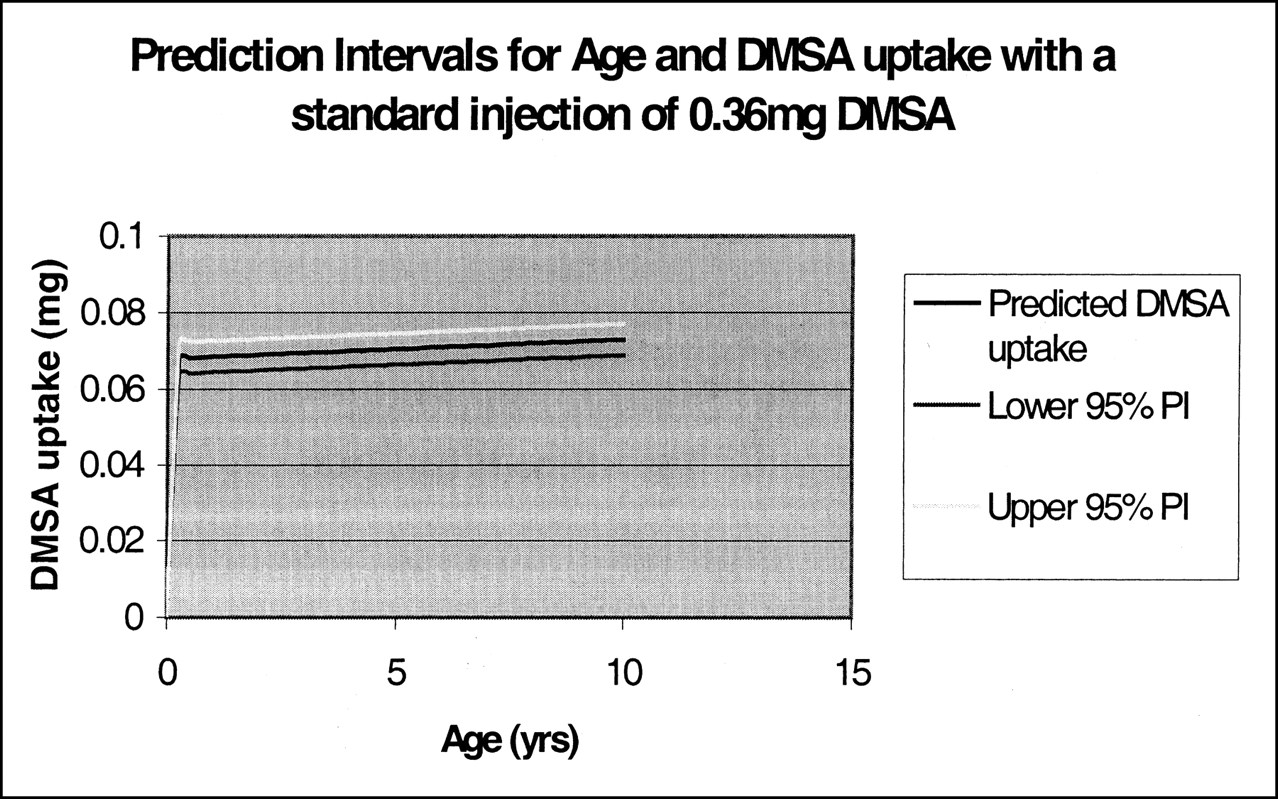
Plot of example prediction intervals for age and DMSA uptake with a standard injection of 0.36mg DMSA (calculated using the regression equation).
Further study needs to be done using a known standardized injected dose in milligrams of the DMSA complex correlating uptake with age to determine the relationship. Once this relationship is identified, it can then be used to predict normality of uptake at various ages. If only a very weak association is found, then normal absolute uptake for a kidney can be predicted—regardless of age—using the amount of DMSA injected. If a significant association were found, then age-related normal would need to be constructed.
Acknowledgments
The author wishes to acknowledge the Department of Nuclear Medicine, Southland Hospital, Ivercargill, New Zealand, where the data were collected.
Footnotes
For correspondence or reprints contact: Rachael Moorin, Nuclear Medicine, Perth Radiological Clinic, 215 Willmott Drive, Waikiki, Western Australia 6169; Phone: 0061-8-959-122; Fax: 0061-8-9592-9893.
REFERENCES


Jump to section
Related Articles
Cited By...
- No citing articles found.